Photos • Location


Vercourt | |
|---|---|
 The main square in Vercourt, with the town hall, chateau and war memorial | |
.svg) Coat of arms | |
 Vercourt  Vercourt | |
| Coordinates: 50°18′03″N 1°42′07″E / 50.3008°N 1.7019°E | |
| Country | France |
| Region | Hauts-de-France |
| Department | Somme |
| Arrondissement | Abbeville |
| Canton | Rue |
| Intercommunality | CC Ponthieu-Marquenterre |
| Government | |
| • Mayor (2020–2026) | Vincent Dubois [1] |
| Area 1 | 4.67 km2 (1.80 sq mi) |
| Population (2021)
[2] | 96 |
| • Density | 21/km2 (53/sq mi) |
| Time zone | UTC+01:00 ( CET) |
| • Summer ( DST) | UTC+02:00 ( CEST) |
| INSEE/Postal code |
80787 /80120 |
| Elevation | 3–31 m (9.8–101.7 ft) (avg. 4 m or 13 ft) |
| 1 French Land Register data, which excludes lakes, ponds, glaciers > 1 km2 (0.386 sq mi or 247 acres) and river estuaries. | |
Vercourt is a commune in the Somme department in Hauts-de-France in northern France.
Vercourt is situated 15 miles (24 km) north of Abbeville, on the D175 road
| Year | Pop. | ±% p.a. |
|---|---|---|
| 1968 | 119 | — |
| 1975 | 108 | −1.38% |
| 1982 | 90 | −2.57% |
| 1990 | 82 | −1.16% |
| 1999 | 85 | +0.40% |
| 2007 | 109 | +3.16% |
| 2012 | 103 | −1.13% |
| 2017 | 93 | −2.02% |
| Source: INSEE [3] | ||
-
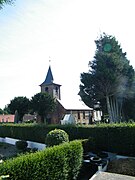
 Church Saint-Saturnin.
 -
 Castle.
 -
 Church.
 -
 Notre-Dame de joie, towards Cantereine.
 -

-
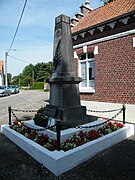 Monument aux morts.
 -
 Old school.
 -
 Church.


.JPG)


- ^ "Répertoire national des élus: les maires". data.gouv.fr, Plateforme ouverte des données publiques françaises (in French). 2 December 2020.
- ^ "Populations légales 2021" (in French). The National Institute of Statistics and Economic Studies. 28 December 2023.
- ^ Population en historique depuis 1968, INSEE
Wikimedia Commons has media related to
Vercourt.
| Authority control databases: National |
|---|
Vercourt | |
|---|---|
|
The main square in Vercourt, with the town hall, chateau and war memorial | |
|
Coat of arms | |
Vercourt Vercourt | |
| Coordinates: 50°18′03″N 1°42′07″E / 50.3008°N 1.7019°E | |
| Country | France |
| Region | Hauts-de-France |
| Department | Somme |
| Arrondissement | Abbeville |
| Canton | Rue |
| Intercommunality | CC Ponthieu-Marquenterre |
| Government | |
| • Mayor (2020–2026) | Vincent Dubois [1] |
| Area 1 | 4.67 km2 (1.80 sq mi) |
| Population (2021)
[2] | 96 |
| • Density | 21/km2 (53/sq mi) |
| Time zone | UTC+01:00 ( CET) |
| • Summer ( DST) | UTC+02:00 ( CEST) |
| INSEE/Postal code |
80787 /80120 |
| Elevation | 3–31 m (9.8–101.7 ft) (avg. 4 m or 13 ft) |
| 1 French Land Register data, which excludes lakes, ponds, glaciers > 1 km2 (0.386 sq mi or 247 acres) and river estuaries. | |
Vercourt is a commune in the Somme department in Hauts-de-France in northern France.
Vercourt is situated 15 miles (24 km) north of Abbeville, on the D175 road
| Year | Pop. | ±% p.a. |
|---|---|---|
| 1968 | 119 | — |
| 1975 | 108 | −1.38% |
| 1982 | 90 | −2.57% |
| 1990 | 82 | −1.16% |
| 1999 | 85 | +0.40% |
| 2007 | 109 | +3.16% |
| 2012 | 103 | −1.13% |
| 2017 | 93 | −2.02% |
| Source: INSEE [3] | ||
-
Church Saint-Saturnin.
-
Castle.
-
Church.
-
Notre-Dame de joie, towards Cantereine.
-
-
Monument aux morts.
-
Old school.
-
Church.
- ^ "Répertoire national des élus: les maires". data.gouv.fr, Plateforme ouverte des données publiques françaises (in French). 2 December 2020.
- ^ "Populations légales 2021" (in French). The National Institute of Statistics and Economic Studies. 28 December 2023.
- ^ Population en historique depuis 1968, INSEE
Wikimedia Commons has media related to
Vercourt.
| Authority control databases: National |
|---|