Please be assured, I've done all I could to make them as accurate as I can - using the tools I have available to me - and I take a lot of pride in them.
If you have any more concerns after having read what I've written in the FAQ, feel free to post them here. Thank you!
Hi
I noticed that u suport Spelng Reform. That's cool bro, I do to. If u need anything, feel fre to ask.
Cameron Nedland 18:08, 3 September 2006 (UTC)reply
Thanks. Glad too see other peeple out there supporting spelling reform.
Redtitan 04:55, 4 September 2006 (UTC)reply
Thanks for uploading
Image:344983.jpg. Wikipedia gets thousands of images uploaded every day, and in order to verify that the images can be legally used on Wikipedia, the source and copyright status must be indicated. Images need to have an
image tag applied to the
image description page indicating the copyright status of the image. This uniform and easy-to-understand method of indicating the license status allows potential re-users of the images to know what they are allowed to do with the images.
For more information on using images, see the following pages:
This is an automated notice by
OrphanBot. If you need help on selecting a tag to use, or in adding the tag to the image description, feel free to post a message at
Wikipedia:Media copyright questions. 04:04, 10 September 2006 (UTC)
Hello. I'm part of a research group at the University of Washington (Seattle campus), and my group is reaching out to Wikipedians in the Puget Sound area. We're hosting a focus group designed to gather information on what Wikipedians would like to know about each other when interacting on Wikipedia. Our end goal is to create an embedded application that helps people quickly know more about others' history and activity on Wikipedia, and we feel our design will be much more useful if it's based on insights of users like you.
I'm hoping that the chance to help out local researchers, to engage in lively face-to-face discussion with other Seattle Wikipedians, and to contribute to Wikipedia in a new way will entice you to join us. The session lasts 2 hours and snacks are provided. Sessions will be held on UW Seattle campus - directions will be sent after registration. Your contribution will be greatly appreciated!
Willing and able to help us out?
RSVP here. Want to know more? Visit our
user talk page . Please help us contact other local Wikipedians, too!
Commprac01 (
talk) 00:42, 15 March 2009 (UTC)reply
NEW CATEGORY PAGE
Hello Washington-user!! What do you think of
this category? Either on a scale of 1-10 or with commentary. Let me know through the "Special:EmailUser/" section. #TTiT# 13:23, 14 August 2009 (UTC) —Preceding
unsigned comment added by
The-Traveller-in-Tacoma (
talk •
contribs)
WP:ORE welcome
Welcome to
WikiProject Oregon! If you'd like, you can add the WP Oregon userbox to your user page using this code: {{
User WikiProject Oregon}}. Check out the ongoing and archived discussions at
WT:ORE and be sure to add the page to your
Watchlist. If you are new to Wikipedia, it's a good idea to browse through
the core principles of Wikipedia as well. The project home page at
WP:ORE has many useful links to get you started. The
recent changes and
recent discussions links will display recent edits on articles within the project's scope. Welcome!
Hi. Thank you for your recent edits. Wikipedia appreciates your help. We noticed though that when you edited
Scatter Creek Unit, you added a link pointing to the disambiguation page
Camas. Such links are almost always unintended, since a disambiguation page is merely a list of "Did you mean..." article titles. Read the
FAQ • Join us at the
DPL WikiProject.
It's OK to remove this message. Also, to stop receiving these messages, follow these
opt-out instructions. Thanks,
DPL bot (
talk) 09:27, 30 November 2015 (UTC)reply
Climate of Ireland
Adam - The image you created for the Koppen Classification for Ireland, only covers the Republic of Ireland, whereas the article covers the entire island of Ireland. If you have the data (which I think you have) could you redo the map to cover the entire island? Ta
CalzGuy (
talk) 12:58, 20 July 2016 (UTC)reply
User:CalzGuy Thanks for pointing that out and my bad! The article for ROI links to that page for its climate section, and so I just clicked on it and mistakenly thought it was ROI-specific. I can generate an island-wide map and will upload that soon.
Redtitan (
talk) 15:44, 20 July 2016 (UTC)reply
Hi! Thanks for the wonderful climate maps. I was always dissatisfied with the previous maps, because I knew they were too coarse to be accurate, but I don't have the expertise to create better maps myself. Could you create maps for the
Upper Midwest and the
Midwestern United States? Other articles in
Category:Census regions of the United States should probably have climate maps too.
I'm curious, would you be able to make fine-grained maps of average July and January temperatures, and annual or half-annual precipitation? As I recall from reading through World Book encyclopedias when I was younger, they typically had maps of summer and winter temperatures and precipitation. That would significantly add to articles by showing finer-grained variations of climate than are shown in the Koeppen maps. (Especially useful in states like
Maine that basically just have one climate type!)
BONAP has maps like this, but not very fine-grained, and there are no maps of individual states, so it's hard to see microclimates like those near coastal California. —
Eru·
tuon 18:22, 17 August 2016 (UTC)reply
User:Erutuon Thanks so much! I'm going to school for GIS this autumn and so making these maps has been my practicing ahead of time for class. I'd be happy to make some more regional maps - so far I've got the NW US and New England. I'd be happy to do the Upper Midwest and Midwestern US. Do you have any recommendations for the states I should include in the Upper Midwest? The current article seems to point to North and South Dakota, Minnesota, Wisconsin, and Michigan.
I could definitely make the same maps for July or January, or annual or half-annual precipitation. In fact, I already have calculated those layers for all these maps, while doing the calculations for Koeppen climate types, so it'd be extremely easy for me to format a map. Let me know if you have any specific requests for regions and climate parameters. I could just as easily do regions as individual states. Or I could even trim individual counties or sub-state/province regions, as I have for a few Koeppen maps:
I was actually already planning on doing a map showing the ratio of summer precipitation to annual precipitation for the West Coast - it'd be really fun to visualize the strength of summer dryness along the West Coast, since it does extend so far north.
Redtitan (
talk) 18:46, 17 August 2016 (UTC)reply
It seems that the Upper Midwest is defined in many different ways. Minimally, it would be Minnesota, Wisconsin, and Michigan; maximally, North and South Dakota, Minnesota, Iowa, Wisconsin, Illinois, Indiana, and Michigan. The article
Upper Midwest doesn't give any sources, so maybe you could start with the states you listed, leaving out Iowa, Illinois, and Indiana. I'm not sure what definition is most appropriate for a climate map, and you could always upload an expanded version if there's reason to.
I don't know if it would make much sense, but I have always been curious what a map of diurnal or seasonal temperature difference would look like. That would be neat, because it might show temperature moderation by bodies of water or urban heat island effect, as well as the opposite effect of high elevation or very little cloud cover. I don't think I've ever found a map like that online. It would probably be best to do separate diurnal temperature variation maps for July and January, since winter often has lower variation than summer. —
Eru·
tuon 20:07, 17 August 2016 (UTC)reply
User:Erutuon A diurnal variation map would be totally doable. I have max and min temperature datasets for each month, so all I'd have to do is subtract them for January and July. Great idea for a map - I think diurnal variation is something that's not really discussed that much when considering a regions particularly climate, but can make for large differences in climate between regions. I remember people from the eastern U.S. being shocked about the 40 degree swing in day and nightly temperature where I live in Washington state, while I was surprised it didn't change any more than 10 degrees where they lived, due to higher humidity. That, and the influence of bodies of water, altitude . . . I'm getting curious. I may make this map by the end of the day!
Redtitan (
talk) 20:38, 17 August 2016 (UTC)reply
User:Erutuon Here's July: Map of diurnal temperature variation for the month of July in the contiguous United StatesRedtitan (
talk) 23:34, 17 August 2016 (UTC)reply
Oh wait, that's actually horribly wrong. I converted from Celsius to Fahrenheit and added 32 by accident, since I forgot I'm dealing with absolute temperatures. All these should be much lower. Will fix very soon.
Redtitan (
talk) 23:43, 17 August 2016 (UTC)reply
Even though the legend is way off, at least the colors on the map are looking great, and I can see there's a definite difference in areas right near water! Could you add state boundaries as reference points? —
Eru·
tuon 23:54, 17 August 2016 (UTC)reply
User:Erutuon And it's fixed! Thanks for the state outline suggestion - I knew the map was missing something. You might have to click on it so it refreshes your browser's cache, in order to see the new version. Also, I made the pixel count higher (600 px) so if you hold down ctrl and scroll, you can zoom in and see a lot of detail on the .svg file.
Redtitan (
talk) 01:21, 18 August 2016 (UTC)reply
On the diurnal range note, it reminds me of an interesting conversation I had from someone from Northeastern CA: he said it could hit 80F by 2 p.m., but still hit freezing at night.
And here's an Upper Midwest koppen map:
Köppen climate types of the Upper Midwest
Thanks! I've added the Upper Midwest map to the page.
I also added the diurnal variation map to
Diurnal temperature variation. But I'm thinking maybe the legend should have ticks by fives, from 5°F to 45°F, rather than the oddly specific numbers it currently has. And it would be neat if the lower end was blue, since it might make climates moderated by water more visible. —
Eru·
tuon 19:00, 19 August 2016 (UTC)reply
Hi, sorry for the lack of activity. School has begun and been taking up most of my time. I'll try to make those modifications to the diurnal temperature map next chance I get. The software I have has issues with the color schema, so changing the tick marks also changed the color swath to the negative. The weird numbers were the result of picking an aesthetically pleasing range of colors. When I chose tick marks at 5 degree intervals, it ended up giving a really unattractive and less contrasting set of brownish hued greens and reds. I've switched to a more advanced version though, so hopefully I can get around that.
Redtitan (
talk) 00:19, 27 August 2016 (UTC)reply
Dear Adam Peterson/Redtitan,
I don’t know how active you are currently on Wikipedia, but I was wondering if you could render other Köppen climate maps for other Carribean island nations. I see you already have rendered maps for Hispaniola (both Dominican Republic and Haiti) and Puerto Rico. I was hoping you could do maps for Cuba, Jamaica, and The Bahamas. If it would not take too long, maybe you could also render maps for the Turks and Caicos Islands and for the Lesser antilles. I’m not sure how long it would take to render. You have said it took a whole day to render a map for Australia. I don’t know if the ocean area would interfer with the rendering.
Rigognos Molinarios (
talk) 06:01, 5 December 2018 (UTC)reply
@
Rigognos Molinarios: My goal is to get through the whole world in the next few months. Stay tuned - I'll have new maps uploading in the near future.
Redtitan 06:49, 5 December 2018 (UTC)reply
Climate map of Spain
Hi I have reverted your climatic map of Spain (which is good and better than what was before) for a number of reasons. Firstly, the Canary Islands are missing which are a significant part of the country population-wise. Secondly, I feel you slightly overestimated the size of the Oceanic areas in interior Spain (see Cuenca for example) and you definitely made a mistake with coastal Galicia, all of which should be categorized as Oceanic (see Santiago de Compostela, Vigo and La Coruña). Spain also has a small section of Hot desert climate in coastal Almeria which you have missed (rainfall around 160 mm annual). Hot semi-desert should also extend further south along the south east coast along Almeria almost into the Granada coast. Some of the semi-desert areas seem to be slightly out of place in the centre of the country but Im not 100%.
Best.
Asilah1981 (
talk) 15:51, 20 September 2016 (UTC)reply
@
Asilah1981: Hi - I calculated the types using climate normals from WordClim.org, so there was no subjective influence from myself at all (I actually just put in code for each climate type and calculated them). The data they have must not be entirely accurate for Spain if it's so far off. Thanks for the note. I'll look for a more accurate dataset for Spain, that can hopefully provide a more accurate map for the country.
Redtitan (
talk) 17:10, 20 September 2016 (UTC)reply
In the interest of transparency, here's a page that outlines the methods used to calculate the WorldClim data and that I input into my GIS program to calculate the climate types for the maps:
http://www.worldclim.org/methods1. Looks like the methods were published and peer reviewed, so it's a bit worrying it's so far off in the case of Spain. I used the formulas from this paper to calculate each Koppen type:
http://koeppen-geiger.vu-wien.ac.at/pdf/Paper_2006.pdfRedtitan (
talk) 17:31, 20 September 2016 (UTC)reply
@
Asilah1981: I've been reviewing the map, and I'm now wondering if it's not as wrong as it may first appear.
Galicia is right on the borderline between Csb and Cfb. You mentioned La Coruña as definitely oceanic. According to the climate data on its wiki page, it actually qualifies as Csb (the driest summer month is <40 mm, and that month is less than 1/3 the precipitation of wettest winter month). It's inaccurately listed on its wiki page as Cfb. Vigo and Cuenca almost qualify as Csb (their driest summer months are 43 and 44 mm, respectively). The WorldClim dataset is from 1960-1990, so it might be that the 30 year average of rainfall patterns have shifted a few mm, potentially explaining why Galicia is shown fairly dominantly as Csb in the map (there are scattered pixels of Cfb in Galicia - hard to see them without zooming in the SVG version).
I looked into the hot desert area around Almeria. The raster dataset I'm working with doesn't show any rainfall around 160 mm. I thought that was wrong, but then I tried to find any climate data source backing up the presence of BWh around Almeria, and I can't find any. (In fact, I can't find any city/town/village wiki page in any part of continental Spain with climate data qualifying as BWh). I did some googling, and nothing turned up either. Do you know of any sources to back that up? The current claim of Almeria containing BWh is unsourced on the Almeria wiki page.
Cuenca lies almost entirely within Csa or Csb on the map actually (I overlaid the climate map with a city map for Spain). A few small sections of the city lie under pixels for Cfb, but those pixels (each representing 1 sq. km) also mostly contain area in the surrounding mountains, which are >700 ft. higher than the city's terrain and so would be expected to have higher rainfall.
Let me know if you have any particular concerns about the semi-arid areas and their relative placement - I'd be happy to look up any particular towns and match the map up with current data sources.
Redtitan (
talk) 20:42, 20 September 2016 (UTC)reply
Almería province registers annual rainfall as low as 156 mm per year at "Faro del Cabo"
El observatorio Faro de Cabo de Gata (36°43′18.8″ N, 2°11′34.69″ W), registrado durante el período 1961-1990, 156 mm de precipitación anual promedio.[1]
@
Asilah1981: It appears the data used to calculate the WorldClim dataset is about 0.5C colder than the sources you've found, and somewhat wetter as well. It could be that when the WorldClim data was calculated, they weren't drawing on as many climate stations as the Spanish-language sources you've outlined. If there wasn't a weather station from that small area of desert coastline, it could've easily been skipped in their calculations.
Unfortunately, I can't change the WorldClim data and add those desert sections to my map. I would if I could. But I can't 'tweak' the map. These maps are not in any way subjectively influenced by me. I'm loading raw datasets (.bil files) into a GIS program - there's no way I can change those raw datasets. Unless you can track down some climate rasters which are more up to date (I'd be looking for .asc or .bil files that contain mean monthly temperatures and monthly precipitation values) from a Spanish language source, unfortunately, there's not much I can do. Until then, either we keep the old, inaccurate map up or we could put mine up, which does omit the desert section along the coast.
Redtitan (
talk) 19:20, 21 September 2016 (UTC)reply
Redtitan have you see p.18 of the link I post below? Can't you do anything with that? It's as good as it gets!
Asilah1981 (
talk) 19:23, 21 September 2016 (UTC)reply
@
Asilah1981: No, I can't. I can't load the zones from that map into my GIS program. I need a data file, not an image file embedded in a .pdf. That map is useful for comparison purposes, but I can't do anything with it in the program that I'm using.
When I do a side-by-side comparison though, my map seems a lot closer to the official Spanish source than the previous, old Koeppen map. The old map leaves out any Koppen zones with annual temps >18C (there's no BSk or BWk) anywhere in Spain. It adds an extra desert, west of Zaragoza, where there shouldn't be one. BSk is show much further in the west and is shown extending over a much larger area. The official Spanish version also shows an almost solidly Csb Galicia, like my map, but the old one, shows significant areas of Oceanic climate there.
The old map also shows an area of tundra along the northern coastline (the gray area), and then leaves that climate type out of the legend altogether.
Until I can find a more accurate set of climate rasters - which I'm guessing might be present from Spanish sources (but I don't speak Spanish, unfortunately, so I'm not able to), we can either keep the old, inaccurate map up, or restore mine, although it does leave out the desert regions on the coast. I won't edit war you on that, but I will say, I think mine is definitely less inaccurate. It does leave out the desert region, but it doesn't list Bilbao as tundra.
Redtitan (
talk) 19:40, 21 September 2016 (UTC)reply
Yes, of course your map is much better. I hadn't even noticed the other one until this morning. We can restore yours. I don't know much about wikicommons but can't we just upload the image from AEMET? There is no copyright on it or anything. I have another question for you since you know about this stuff. Can somewhere with low rainfall and strong summer drought be considered Oceanic climate? It seems that is the case for much of the high altitude cities of north central Spain, which are categorized on the basis of their summers not being warm enough and their winters not being below -3 degrees centigrade - including Spain's coldest city Soria.
Asilah1981 (
talk) 19:45, 21 September 2016 (UTC)reply
@
Asilah1981: Unfortunately, the AEMET map has a copyright on it - actually two copyrights, one from the Portuguese meterological organization, and then one from its Spanish counterpart. Theoretically, we could, but I believe we'd need written permission from both the copyright holders to allow us to do that. In fact, I could try to make a derivative map myself in another program by clicking and drawing boundaries, but I'd still need permission from the copyright holders of the original work.
Yes, a place can have low rainfall in the summer and still be classified as Oceanic, up to a point. However, the driest month in the summer half of the year (April-September) must be above 40 mm. Also, the driest summer month has to be greater than 1/3 the precipitation of the wettest month in the winter half of the year.
So in short, it can be dry in the summer, relatively speaking - just not too dry. If it reaches both of those two criteria, then it's listed as Mediterranean.
Redtitan (
talk) 20:01, 21 September 2016 (UTC)reply
Thanks. And thank you for your work. It is really cool. I hope somehow an AEMET based map can be made at some point.
Asilah1981 (
talk) 20:04, 21 September 2016 (UTC)reply
Btw, I guess odd climates like Soria where the driest month is 30mm is why new climatic categories are made up in Spain such as "continentalized Mediterranean". It fits the second requirement though. The wettest month is 67mm, so they went for "oceanic" in the map.
/info/en/?search=Soria#Climate
@
Asilah1981: So the actual names for Koeppen categories get a bit complicated and aren't that standardized. I've seen 'continental Mediterranean' used before, to refer to a Dsb or Dsa climate. However, Soria is safely a C climate and not a D climate (the mean temperatures of its winter months are above 0C), so I actually wouldn't consider it continental in any way. It's more a dry version of an oceanic climate.
The problem with Koppen is that places with climates right on the boundaries of being another type can look quite a bit different than you might expect them to. I'm sure Soria doesn't look like coastal England, a place you might typically associate with 'Oceanic'. Unfortunately, one of the weaknesses of the system. There are other systems - like Trewartha - that tried to correct the system, but they're less widely used.
Redtitan (
talk) 20:31, 21 September 2016 (UTC)reply
Interesting. Within Spain I associate Oceanic to coastal Galicia, where it rains all the time, doesn't get too hot in the summer and never has frosts in the winter. But Koppen shoves that in Mediterranean while considering the coldest city in Spain (which is also quite dry) oceanic. It is quite baffling! Anyways, I was surprised by the level of detail you put in your map, though, even if there were mistakes, I guess due to the low number of measuring stations used. Cuenca city is indeed surrounded by mountains. It is at the bottom of a canyon and quite a spectacular place.
Asilah1981 (
talk) 21:17, 21 September 2016 (UTC)reply
Yes, that's Koppen for you! I live in temperate rainforest in the northwestern US, where it snows each year, but I'm classified as living in a Mediterranean climate according to Koppen, based on our dry summers. It doesn't really make sense, but with every classification system, the places at the edges are often grouped in with categories that don't really sound like they fit.
Redtitan (
talk) 21:24, 21 September 2016 (UTC)reply
@
Sondrion:Hi Sondrion, thanks for bringing your concern about the Turkey Köppen map to me. Please read the FAQ on my user page - I talk in detail about why I can't modify maps and the limitations of the climate data raster files I use to calculate the climate types. If you look further up my talk page, there was a similar situation that emerged with an area in southern Spain. A similar situation has happened with some small islands in the Aegean Sea a few weeks ago too. These aren't uncommon issues, and unfortunately have to do with the data limitations of the climate raster files I work with.
To put it breifly, I can't modify the maps in a way that protects their integrity. Think of what I do as a complex version of colorizing a black and white picture. I could colorize a black and white photo of the Hagia Sofia. But I can't add another minaret. I actually could try, but it'd look like something that came out of Microsoft Paint. I've similarly attempted to change maps in a program called Inkscape - think of it as a better version of MSPaint, and it didn't turn out well. It looked very botched and unprofessional.
I should add, I have no subjective control over where the climate types go. I use a set of climate files that contain data for temperature and precipitation and then use those to calculate the different Köppen types using a set of code.
The problem is that the series of weather stations that was used to calculate the climate data (it's a worldwide set from WorldClim.org), might have thinner weather station coverage in certain areas. And so, if there was only one weather station in Istanbul used to calculate that climate dataset, and that station had a Csa climate, that might have caused the whole area for the city to be calculated as Csa in the map. Unfortunately, I can't add new weather station into the climate raster - it's a fairly complex process that I know nothing about.
The climate data I'm working with is the best that's publicly available, but sadly, it's not perfect. I'm trying my best, but without the right data, I'm powerless to make any changes.
There is one possibility though: If you speak Turkish and were able to find a climate rasters (.asc or .bil files would both work) for Turkey for mean monthly precipitation and mean monthly temperature on the Turkish GIS portal website, then I could potentially make another map based on that data. Often times, countries will have more accurate datasets in their own files than datasets that cover the whole planet.
In the mean time, I hope this map is at least better than the last one. I've been able to correct some serious errors: removing a section of tundra that a previous mampmaker had shown for the Northern Coast of Spain and I replaced an errant piece of humid subtropical climate in the Los Angeles area with the semi-arid climate it actually had.
If you feel the previous map was more accurate, feel free to remove mine and replace it with the old one. As you can see, I really care about these errors, like the people who find them care - I just can't do anything to change them.
Redtitan 15:48, 4 November 2016 (UTC)reply
They also have the whole Istanbul area as all Csa. So it appears I'm tied with the literature on accuracy (at least for published literature in English), although I feel my map might be a slight improvement, since it directly takes elevation's affect on climate into account, while Peel's analysis does not.
Redtitan 16:06, 4 November 2016 (UTC)reply
Wikipedia:WikiProject United States/The 50,000 Challenge
You are invited to participate in the
50,000 Challenge, aiming for 50,000 article improvements and creations for articles relating to the
United States. This effort began on November 1, 2016 and to reach our goal, we will need editors like you to participate, expand, and create. See more
here!
Hi,
Wikipedia:WikiProject Canada/The 10,000 Challenge is up and running based on
Wikipedia:The 10,000 Challenge for the UK which has currently produced over 2300 article improvements and creations. If you'd like to see large scale quality improvements happening for Canada like
The Africa Destubathon, which has produced over 1600 articles in 5 weeks, sign up on the page. The idea will be an ongoing national editathon/challenge for Canada but fuelled by a contest such as
The North America Destubathon to really get articles on every province and subject mass improved. I would like some support from Canadian wikipedians here to get the Challenge off to a start with some articles to make doing a Destubathon worthwhile! Cheers. --
MediaWiki message delivery (
talk) 01:55, 22 November 2016 (UTC)reply
Koppen maps
Hi, you uploaded this presumably newer Koppen map, including individual state uploads. What year is this data up to? Is it newer than 2012? Such as the new
plant hardiness zone map of 2012 that showed widespread changes of half a step. I ask because this also shows a larger area of warmer climates, such as the New York upload on
climate of New York. Thanks.
B137 (
talk) 09:29, 2 December 2016 (UTC)reply
Oh now I see the giant red writing on the wall to go to the FAQ, where you say the data varies.
B137 (
talk) 09:33, 2 December 2016 (UTC)reply
I used a different isotherm (-3 deg C) instead of the 0 deg C that was used by the older map. That'd explain to some degree the increased amount of land listed as temperate rather than continental. That being said, the climate is ::growing warmer too. The data I used goes off 1980-2010 averages.
Redtitan 22:25, 23 January 2017 (UTC)reply
Hello Adam Peterson, I found this Köppen climate map of The Bahamas on Wikimedia Commons: How well does it match the data on WorldClim.org? — Preceding
unsigned comment added by
Rigognos Molinarios (
talkcontribs) 05:16, 26 December 2018 (UTC)reply
I guess I'll post it to the english Wikipedia page for The Bahamas if you don't have better data right now.
Rigognos Molinarios (
talk) 23:33, 30 December 2018 (UTC)reply
Rigognos Molinarios Beck's data is definitely better than WorldClim.org's, so that map is the most current. I just finished my world map a few weeks ago, and then realized a whole worldwide dataset had been calculated and published in the journal Nature. If only I had known - could have saved me three weeks of processing time on my laptop! So you're working with the latest data. I'm currently shifting to other projects at the moment.
Redtitan 23:44, 30 December 2018 (UTC)reply
I also found this recent climate map of Argentina at 1km. resolution. It seems to overepresent Dsb Dsc and Dfc climates so I don’t know if it’s using the same temperature isotherm as the Chile map.
Rigognos Molinarios (
talk) 04:07, 4 January 2019 (UTC)reply
I found another map of Chile by the same author. It has pockets of dfc dsb and dsc climates not reptesented in your map so it must be using a different isotherm.
Rigognos Molinarios (
talk) 05:07, 4 January 2019 (UTC)reply
Rigognos Molinarios You're correct. It appears Beck et al. is using a 0 deg C isotherm instead of a -3 deg C isotherm, as the original Koppen type calls for to distinguish 'C' from 'D' type climates. I believe the use of the 0 deg C is considered an Americanized version, so this modification is being applied to the world. I think I'll upload my world map soon, since it does use a -3 deg C isotherm and could be useful in visualizing differences.
Redtitan 19:43, 5 January 2019 (UTC)reply
I did some further searching and it looks like the user
NVergopolan posted all of the maps I found. He has also posted more köppen climate maps for seemingly every country—— all from the same dataset and all using the 0 deg C isotherm to define ‘C’ from ‘D’ climate. It seems though that he pulled the maps for various countries directly from an equirectangular world map projection without correcting for distortion. This is evident most clearly in the maps of countries closer to the poles e.g. Iceland, New Zealand, Greenland. I don’t think it would be easy to correct for distortion on the individual climate maps for the different countries without distorting the pixels also.
Rigognos Molinarios (
talk) 06:10, 7 January 2019 (UTC)reply
Rigognos Molinarios Interesting - it looks like some of them have been taken down because of a self-citation restriction, and that the author was temporarily blocked (or still is). I take it that the person making the maps is one of the authors of the paper, Noemi Vergopolan. Would be great to see if they have any input here. I noticed they said they were replacing low-resolution maps, but they did replace some of mine as well, which I believe are the same resolution as theirs since we both draw from WorldClim.org. Would be great if we could collaborate, and I really admire the work they did in their paper. There are still so many countries left to do that need better maps upgraded from Peel et al's version, which has issues. With over 190 countries, that's a lot of mapmaking work. Projection is important too (I certainly didn't do my best job in some of my earlier work) and would be happy to assist there.
Redtitan 06:55, 7 January 2019 (UTC)reply
Noemi Vergopolam still has not answered back since I posted on her user page two weeks ago. From reading her user contribtions history, it looks like she posted her first map to Wikimedia Commons on November 25, 2018 and made her last edit on Wikipedia on December 18, 2018 on her user page. Since she has been active for such a short time and has not been actively editing for a month, I'm wondering if she's still blocked.
Rigognos Molinarios (
talk) 21:27, 19 January 2019 (UTC)reply
I don't know if you've already looked at
Noemi Vergopolan's talk page, but if you want to know more about why she was blocked, you could contact the admin
Ian Thomson. He seems to be the admin who originally blocked Noemi Vergopolan. I might be able to find out if any of the maps Noemi Nvergopolan uploaded can still be used in any article on Wikipedia or if they must be deleted from wikimedia commons.
Rigognos Molinarios (
talk) 21:50, 20 January 2019 (UTC)reply
references
^Capel Molina, J.J. (1995) Mapa pluviométrico de España Peninsular y Baleares (en el periodo internacional 1961-1990) Investigaciones Geográficas nº 13: 29-466ISSN 0213-4691
pdf Idioma: español. Acceso: 3/7/2009.
Alternative Isotherm Maps
Hi Adam. Would you be able to make an alternative set of Köppen climate maps (at least for the United States) using the 0° isotherm and convert them to a .kml file? Thanks, Peter. Go Cougars!
JediScougale (
talk) 10:15, 9 December 2016 (UTC)reply
I've actually already put together a Koeppen map of the US using 0 deg isotherms. It's nationwide and I could convert it to a kml. If you'd like a copy, feel free to email me (the option is over on the left pane under 'tools'). Would you like me to add a certain level of transparency to the layer (that way, you can see underlying features and it's not entirely opaque)?
Redtitan 22:21, 23 January 2017 (UTC)reply
Worldbuilding project? Sent you an email
Hi there Adam. I just wanted to let you know here was well that I sent you an email from the tools bar on the side of your page about a climate worldbuilding project that you might be interested in/be able to help me with. I'm not sure how often you check your email or your Wiki page, so I figured one of these posts would catch your attention.
VT45 —Preceding
undated comment added 14:40, 17 March 2017 (UTC)reply
@
VulcanTrekkie45: Sure, would be happy to help. Before I write up a few paragraphs, do you have a background in GIS? If not, QGIS is a great free resource with a set of great tutorials online.
Redtitan 19:05, 5 April 2017 (UTC)reply
@
Redtitan: I've got QGIS, but I don't really know much about it beyond opening and displaying files. I've been playing around with .bil files recently, but what I've ended up doing is to screenshot the .bil files and edit and work with them in Paint.NET since I don't know how to edit them in QGIS.
VT45 22:12, 5 April 2017 (UTC)reply
@
VulcanTrekkie45: This is a really great website for getting started in QGIS:
http://www.qgistutorials.com/en/ It's where I started out, and is a great intro to the basics. To make a map like you're aiming to - of Earth with higher sea levels - you'll want to work with terrain data. If that's a raster, a simple way could be to take elevation data and using the Raster Calculator, simply subtract 200 ft (or however many feet sea level would rise if the sea caps melted). You could then symbolize the data in the raster based on its value. So, for instance, anything less than 0 ft elevation would be blue (for water).
The one challenge with that is that you'd end up with terrain below your new sea level that's far inland and that's marked blue (I'm thinking the Caspian Sea, Dead Sea area). So that would be a challenge. Perhaps you could clip the raster to exclude such areas, then symbolize everything below 0 ft or 0 m to be blue.
The second thing I think you wanted to do was to figure out the climate. That would be extremely hard to model with any level of accuracy. You might look around to see if you can find anything already modeled based on IPCC projections. I do know of one academic attempt to model future Koppen types based on various climate change projections through the end of this century (
http://koeppen-geiger.vu-wien.ac.at/shifts.htm). The data there has been a bit of a challenge to work with though. If you find data that has everything you need to calculate Koppen types (and that's what you're aiming for), let me know and I can send you my flow chart of equations I use to derive them from mean temperature and precipitation data.
If you wanted a detailed map, like the ones I've made, and aren't afraid of being very crude about it, you could use the Raster Calculator to just add a certain value to the temperatures for existing detailed rasters (e.g. PRISM for the US:
http://www.prism.oregonstate.edu/normals/ and for the world,
http://www.worldclim.org/). That would ignore changes in precipitation though, and climate change definitely is far more complicated than just temperatures increasing equally everywhere. But it's an option. Hope that's useful to you! Let me know if there's anything more I can do to help and happy conworlding!
Redtitan 22:31, 5 April 2017 (UTC)reply
(This message was sent to WikiProject members via
Wikipedia:Meetup/Eugene/WikiAPA/MailingList on 23:32, 10 May 2017 (UTC). To opt-out of future messages please remove your name from the mailing list.)
ArbCom 2017 election voter message
Hello, Redtitan. Voting in the 2017 Arbitration Committee elections is now open until 23.59 on Sunday, 10 December. All users who registered an account before Saturday, 28 October 2017, made at least 150 mainspace edits before Wednesday, 1 November 2017 and are not currently blocked are eligible to vote. Users with alternate accounts may only vote once.
The
Arbitration Committee is the panel of editors responsible for conducting the
Wikipedia arbitration process. It has the authority to impose binding solutions to disputes between editors, primarily for serious conduct disputes the community has been unable to resolve. This includes the authority to impose
site bans,
topic bans, editing restrictions, and other measures needed to maintain our editing environment. The
arbitration policy describes the Committee's roles and responsibilities in greater detail.
Hello, Redtitan. Voting in the 2018 Arbitration Committee elections is now open until 23.59 on Sunday, 3 December. All users who registered an account before Sunday, 28 October 2018, made at least 150 mainspace edits before Thursday, 1 November 2018 and are not currently blocked are eligible to vote. Users with alternate accounts may only vote once.
The
Arbitration Committee is the panel of editors responsible for conducting the
Wikipedia arbitration process. It has the authority to impose binding solutions to disputes between editors, primarily for serious conduct disputes the community has been unable to resolve. This includes the authority to impose
site bans,
topic bans, editing restrictions, and other measures needed to maintain our editing environment. The
arbitration policy describes the Committee's roles and responsibilities in greater detail.
Hi there, Adam. I thank you very much for the map of Brazil. We need a map in Portuguese to be able to put it on PT Wikipedia. I did the translation of the United States map (
File:Tipos climáticos dos Estados Unidos (Köppen).svg), this can help you in translating the map of Brazil. You can also access this page to see more translations (
PT translations). Take care! −
Allice Hunter(Inbox) 05:05, 20 January 2019 (UTC)reply
Unofficial World Hardiness Zone Maps
As far as I know, I cannot easily find accurate high resolution hardiness zone maps (Average annual minimum temperature) for areas outside the United States and North America. The only maps I find have low resolution. How long would it take to render maps that show the average minimum temperature of a given area the size of Australia? I'm assuming if that would be possible, the first priority would be for higher population countries. Another issue would be metric/imperial conversions. Does this sound like something you could do?
Rigognos Molinarios (
talk) 03:03, 8 March 2019 (UTC)reply
User:Rigognos Molinarios I wish I had access to hardiness zone data like that, but I'm afraid I don't. The average coldest temperature of a year is different data than just the average monthly temperatures, and can't be derived from it. So far, the only place I've found such data is in raster form is through OSU, which makes the data that is used for the USDA frost hardiness zone maps. I believe similar data is also available through ClimateWNA, but they use a slightly modified metric that's considered over 30 years. I'm keeping my eyes out for data like this to become available. If it does, I'd be really interested in making hardiness zone maps as I have time.
Redtitan 09:16, 24 December 2021 (UTC)reply
In the months of November and December,
WikiProject Numismatics will be running a cross-wiki upload-a-thon, the
2019 US Banknote Contest. The goal of the contest is to increase the number of US banknote images available to content creators on
all Wikimedia projects. Participants will claim points for uploading and importing 2D scans of US banknotes, and at the end of the contest all will receive
awards. Whether you want to claim the
Gold Wiki or you just want to have fun, all are invited to
participate.
If you do not want to receive invitations to future US Banknote Contests, follow the instructions
here
The
Arbitration Committee is the panel of editors responsible for conducting the
Wikipedia arbitration process. It has the authority to impose binding solutions to disputes between editors, primarily for serious conduct disputes the community has been unable to resolve. This includes the authority to impose
site bans,
topic bans, editing restrictions, and other measures needed to maintain our editing environment. The
arbitration policy describes the Committee's roles and responsibilities in greater detail.
If you wish to participate in the 2019 election, please review
the candidates and submit your choices on the voting page. If you no longer wish to receive these messages, you may add {{
NoACEMM}} to your user talk page.
MediaWiki message delivery (
talk) 00:07, 19 November 2019 (UTC)reply
PA Koppen Map with County Boundaries & 0C Threshold.
I'm wondering if you could make a Koppen map for Pennsylvania with county boundaries. Also wondering if you could make it using the 0C threshold for Humid Continental vs Humid Subtropical. I'd love to do it myself but I haven't had GIS software in several years. Too expensive!
ClimateGuy1 (
talk) 14:34, 7 October 2020 (UTC)reply


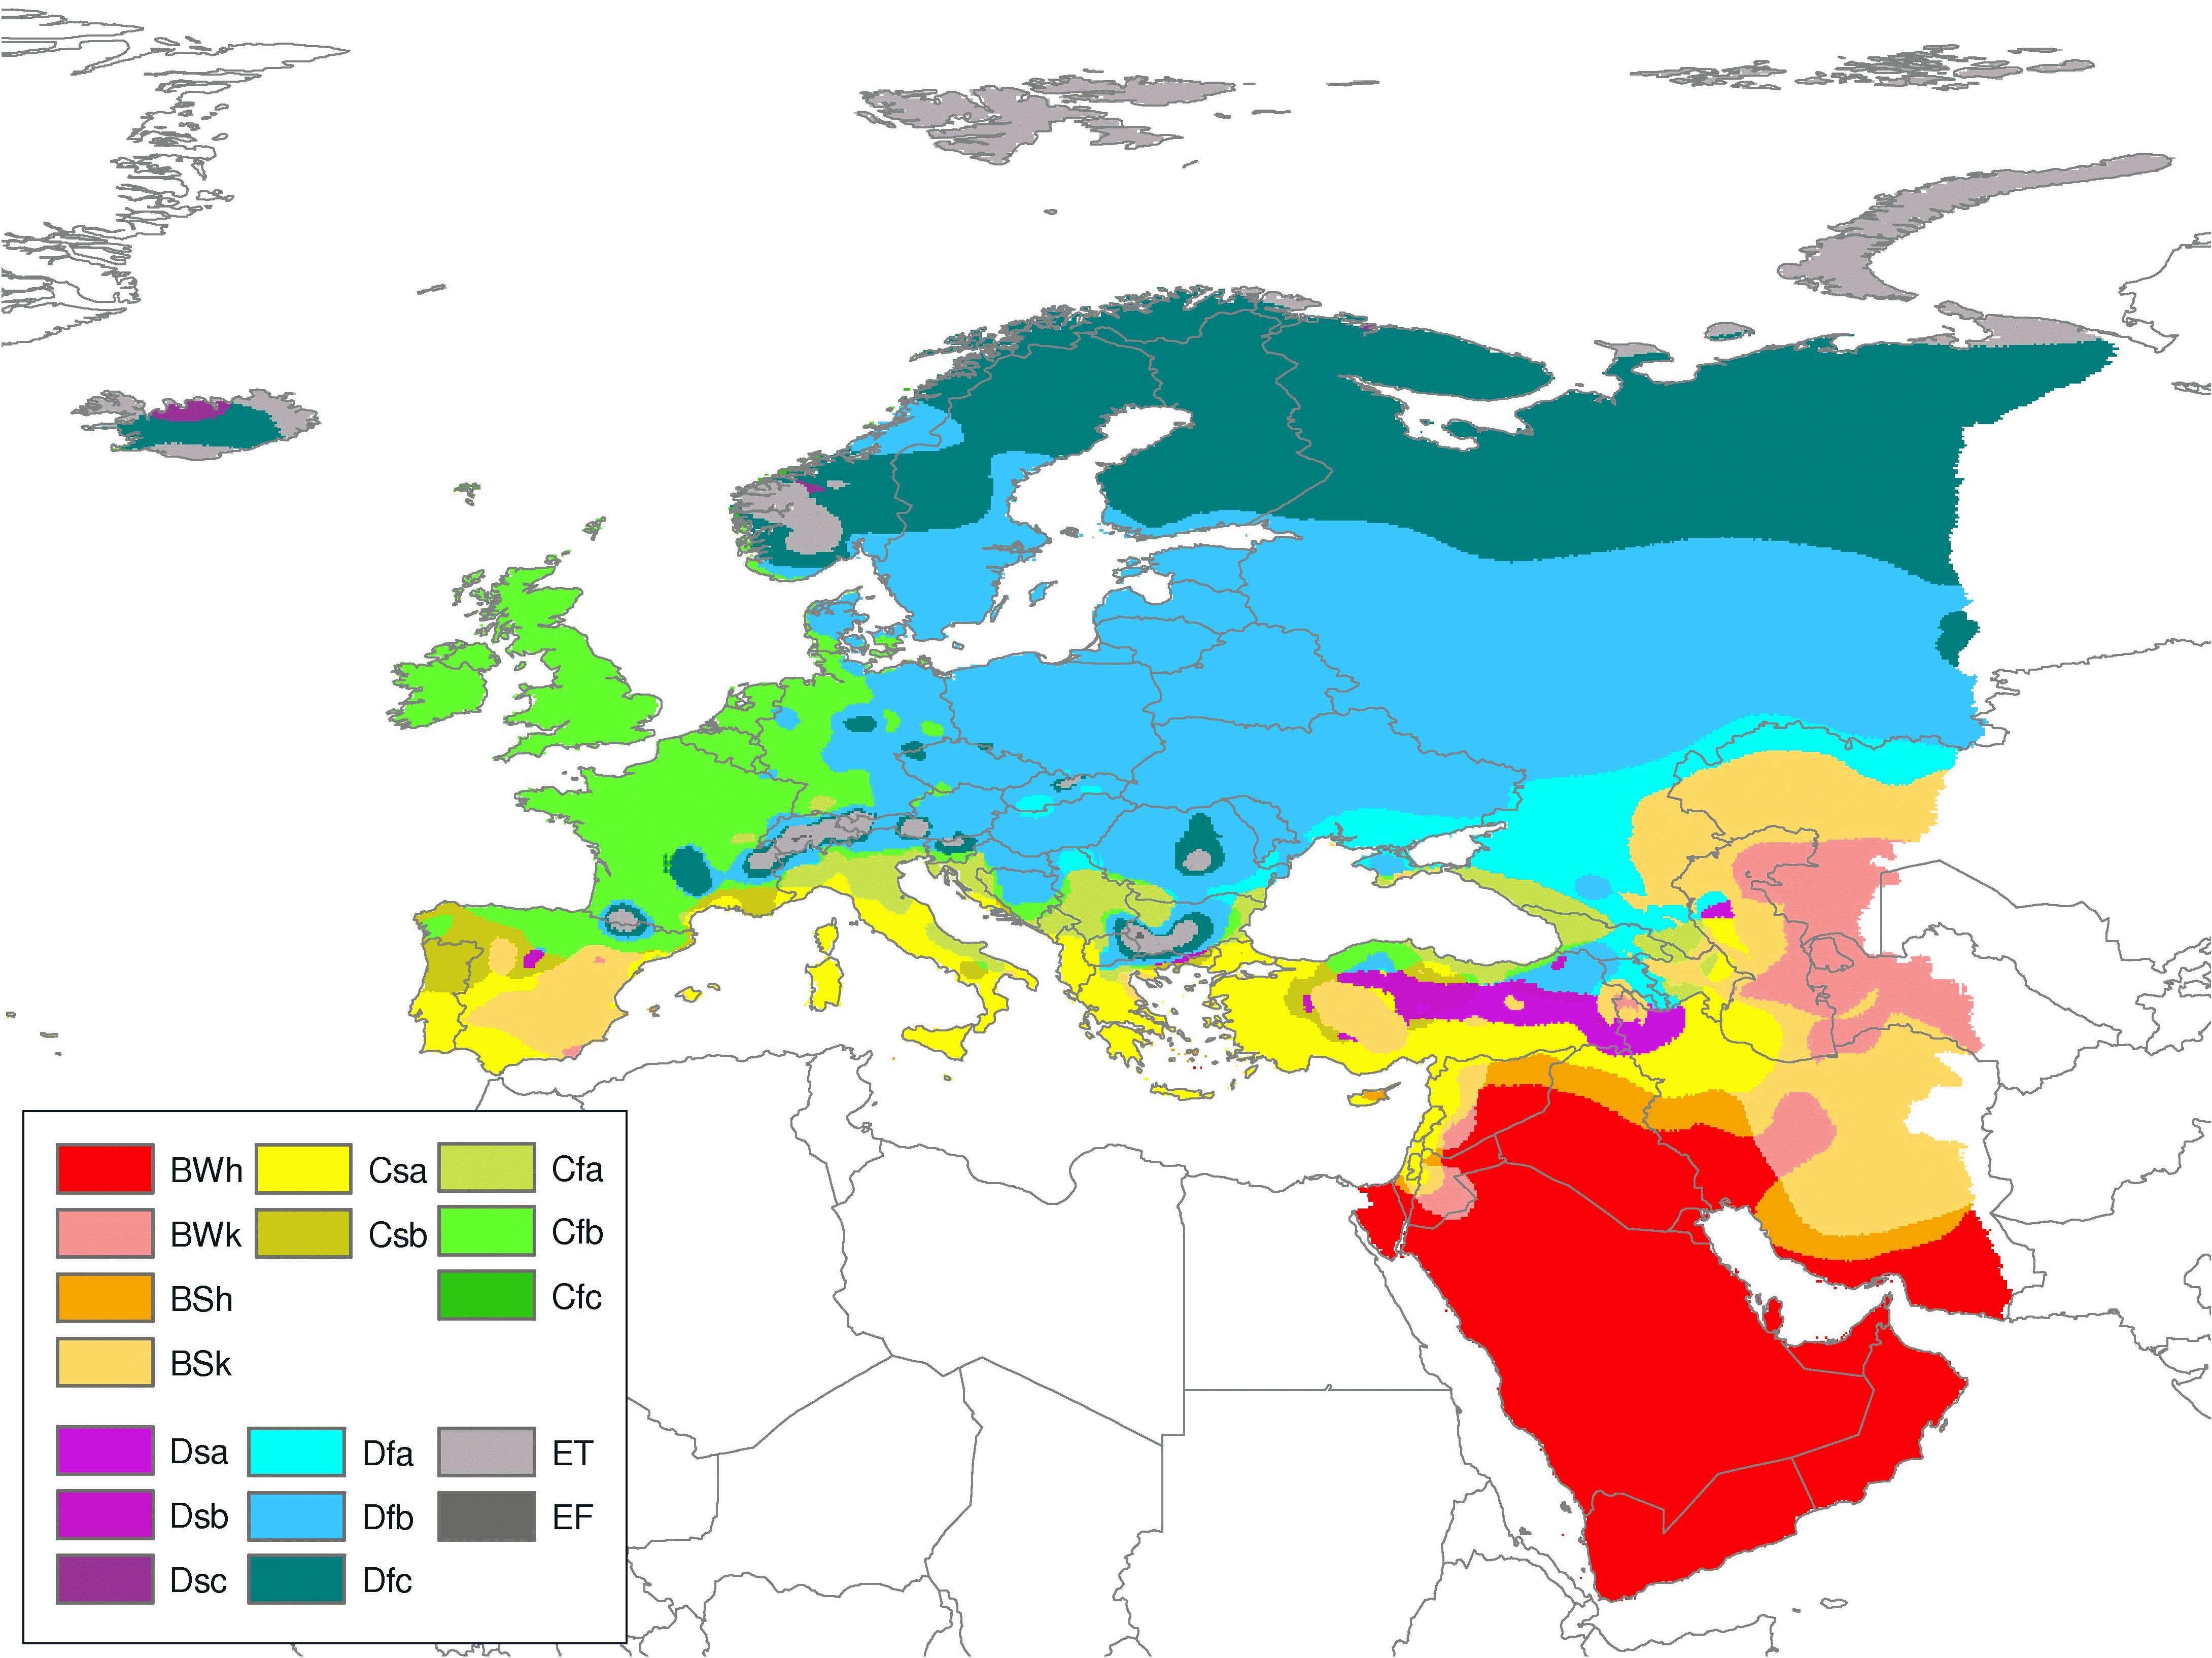
.svg)
