South Gloucestershire Council is the local authority for the a unitary authority of South Gloucestershire, England. It was created on 1 April 1996, covering the area of the abolished Kingswood and Northavon districts, and also taking on the services previously provided by the former Avon County Council in the area.
Council elections
- 1995 South Gloucestershire Council election
- 1999 South Gloucestershire Council election (New ward boundaries) [1]
- 2003 South Gloucestershire Council election [2]
- 2007 South Gloucestershire Council election (New ward boundaries) [3]
- 2011 South Gloucestershire Council election
- 2015 South Gloucestershire Council election
- 2019 South Gloucestershire Council election (New ward boundaries) [4]
- 2023 South Gloucestershire Council election
Results maps
-
 2015 results map
 -
 2019 results map
 -
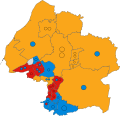 2023 results map


By-election results
1995–1999
| Party | Candidate | Votes | % | ±% | |
|---|---|---|---|---|---|
| Labour | 1,357 | 54.5 | |||
| Liberal Democrats | 570 | 22.9 | |||
| Conservative | 561 | 22.5 | |||
| Majority | 787 | 31.6 | |||
| Turnout | 2,488 | 29.4 | |||
| Labour hold | Swing | ||||
1999–2003
| Party | Candidate | Votes | % | ±% | |
|---|---|---|---|---|---|
| Conservative | 1,061 | 48.1 | +14.2 | ||
| Labour | 768 | 34.8 | +2.7 | ||
| Liberal Democrats | 379 | 17.2 | -16.8 | ||
| Majority | 293 | 13.3 | |||
| Turnout | 2,208 | 39.7 | |||
| Conservative hold | Swing | ||||
| Party | Candidate | Votes | % | ±% | |
|---|---|---|---|---|---|
| Liberal Democrats | 575 | 63.2 | +1.8 | ||
| Conservative | 194 | 21.3 | +8.7 | ||
| Labour | 141 | 15.5 | -10.5 | ||
| Majority | 381 | 41.9 | |||
| Turnout | 910 | 17.9 | |||
| Liberal Democrats hold | Swing | ||||
| Party | Candidate | Votes | % | ±% | |
|---|---|---|---|---|---|
| Conservative | 1,220 | ||||
| Conservative | 1,127 | ||||
| Liberal Democrats | 797 | ||||
| Liberal Democrats | 787 | ||||
| Labour | 734 | ||||
| Labour | 681 | ||||
| Turnout | 5,346 | 33.7 | |||
| Conservative gain from Labour | Swing | ||||
| Conservative gain from Labour | Swing | ||||
| Party | Candidate | Votes | % | ±% | |
|---|---|---|---|---|---|
| Liberal Democrats | 430 | 51.7 | -6.2 | ||
| Conservative | 273 | 32.8 | +7.9 | ||
| Labour | 129 | 15.5 | -1.7 | ||
| Majority | 157 | 18.9 | |||
| Turnout | 832 | 27.1 | |||
| Liberal Democrats hold | Swing | ||||
| Party | Candidate | Votes | % | ±% | |
|---|---|---|---|---|---|
| Labour | 1,303 | 55.0 | -9.8 | ||
| Conservative | 770 | 32.5 | +13.1 | ||
| Liberal Democrats | 294 | 12.4 | -3.4 | ||
| Majority | 533 | 22.5 | |||
| Turnout | 2,367 | 29.3 | |||
| Labour hold | Swing | ||||
2003–2007
| Party | Candidate | Votes | % | ±% | |
|---|---|---|---|---|---|
| Liberal Democrats | 487 | 44.8 | -8.5 | ||
| Conservative | 458 | 42.1 | +13.2 | ||
| Labour | 142 | 13.1 | -4.7 | ||
| Majority | 29 | 2.7 | |||
| Turnout | 1,087 | 34.6 | |||
| Liberal Democrats hold | Swing | ||||
| Party | Candidate | Votes | % | ±% | |
|---|---|---|---|---|---|
| Conservative | 1,036 | 56.6 | -6.9 | ||
| Liberal Democrats | 422 | 23.0 | +9.1 | ||
| Labour | 373 | 20.4 | -2.1 | ||
| Majority | 614 | 33.6 | |||
| Turnout | 1,831 | 31.7 | |||
| Conservative hold | Swing | ||||
2007–2011
| Party | Candidate | Votes | % | ±% | |
|---|---|---|---|---|---|
| Liberal Democrats | Dave Hockey | 1,624 | |||
| Liberal Democrats | Pat Hockey | 1,546 | |||
| Conservative | John Farbrother | 1,179 | |||
| Conservative | Sarah Kitching | 1,165 | |||
| Labour | Terry Trollope | 225 | |||
| Labour | Ray Bazeley | 162 | |||
| Turnout | 5,901 | 54.0 | |||
| Liberal Democrats hold | Swing | ||||
2011–2015
| Party | Candidate | Votes | % | ±% | |
|---|---|---|---|---|---|
| Liberal Democrats | Tony Davis | 787 | 56.9 | -7.3 | |
| Labour | Michael McGrath | 243 | 17.6 | +3.5 | |
| UKIP | Aaron Foot | 213 | 15.4 | +15.4 | |
| Conservative | Kate Duffy | 139 | 10.1 | -11.6 | |
| Majority | 544 | 39.4 | |||
| Turnout | 1,382 | ||||
| Liberal Democrats hold | Swing | ||||
2015–2019
| Party | Candidate | Votes | % | ±% | |
|---|---|---|---|---|---|
| Conservative | Nic Labuschagne | 873 | 47.9 | +1.5 | |
| Labour | George Angus | 615 | 33.8 | +18.6 | |
| Liberal Democrats | Peter Bruce | 333 | 18.3 | -3.8 | |
| Majority | 258 | 14.2 | |||
| Turnout | 1,821 | ||||
| Conservative hold | Swing | ||||
| Party | Candidate | Votes | % | ±% | |
|---|---|---|---|---|---|
| Liberal Democrats | Louise Harris | 693 | 49.0 | +8.1 | |
| Conservative | Ian Livermore | 564 | 39.9 | +17.3 | |
| Labour | John Malone | 158 | 11.2 | -1.6 | |
| Majority | 129 | 9.1 | |||
| Turnout | 1,415 | ||||
| Liberal Democrats hold | Swing | ||||
2019–2023
| Party | Candidate | Votes | % | ±% | |
|---|---|---|---|---|---|
| Conservative | Liz Brennan | 1,819 | 37.8 | -6.5 | |
| Liberal Democrats | Raj Sood | 1,598 | 33.2 | +13.0 | |
| Labour | Sean Rhodes | 1,049 | 21.8 | -3.0 | |
| Green | Oliver Owen | 347 | 7.2 | +7.2 | |
| Majority | 221 | 4.6 | |||
| Turnout | 4,813 | ||||
| Conservative hold | Swing | ||||
References
- ^ "The District of South Gloucestershire (Electoral Changes) Order 1998". legislation.gov.uk. 3 November 1998. Retrieved 4 October 2015.
- ^ "South Gloucestershire". BBC News Online. Retrieved 16 August 2009.
- ^ "The District of South Gloucestershire (Electoral Changes) Order 2007". legislation.gov.uk. 25 January 2007. Retrieved 3 November 2015.
- ^ "The District of South Gloucestershire (Electoral Changes) Order 2018". legislation.gov.uk. 26 April 2018. Retrieved 3 May 2019.
- ^ "View district candidates (by name)". South Gloucestershire Council. Retrieved 16 August 2009.
- ^ "Local Elections Archive Project — Dodington Ward". www.andrewteale.me.uk. Retrieved 11 March 2024.
- ^ "Local Elections Archive Project — Winterbourne Ward". www.andrewteale.me.uk. Retrieved 11 March 2024.
- ^ "Local Elections Archive Project — Dodington Ward". www.andrewteale.me.uk. Retrieved 11 March 2024.
- ^ "Local Elections Archive Project — Frenchay and Downend Ward". www.andrewteale.me.uk. Retrieved 11 March 2024.
External links

South Gloucestershire Council is the local authority for the a unitary authority of South Gloucestershire, England. It was created on 1 April 1996, covering the area of the abolished Kingswood and Northavon districts, and also taking on the services previously provided by the former Avon County Council in the area.
Council elections
- 1995 South Gloucestershire Council election
- 1999 South Gloucestershire Council election (New ward boundaries) [1]
- 2003 South Gloucestershire Council election [2]
- 2007 South Gloucestershire Council election (New ward boundaries) [3]
- 2011 South Gloucestershire Council election
- 2015 South Gloucestershire Council election
- 2019 South Gloucestershire Council election (New ward boundaries) [4]
- 2023 South Gloucestershire Council election
Results maps
-
2015 results map
-
2019 results map
-
2023 results map
By-election results
1995–1999
| Party | Candidate | Votes | % | ±% | |
|---|---|---|---|---|---|
| Labour | 1,357 | 54.5 | |||
| Liberal Democrats | 570 | 22.9 | |||
| Conservative | 561 | 22.5 | |||
| Majority | 787 | 31.6 | |||
| Turnout | 2,488 | 29.4 | |||
| Labour hold | Swing | ||||
1999–2003
| Party | Candidate | Votes | % | ±% | |
|---|---|---|---|---|---|
| Conservative | 1,061 | 48.1 | +14.2 | ||
| Labour | 768 | 34.8 | +2.7 | ||
| Liberal Democrats | 379 | 17.2 | -16.8 | ||
| Majority | 293 | 13.3 | |||
| Turnout | 2,208 | 39.7 | |||
| Conservative hold | Swing | ||||
| Party | Candidate | Votes | % | ±% | |
|---|---|---|---|---|---|
| Liberal Democrats | 575 | 63.2 | +1.8 | ||
| Conservative | 194 | 21.3 | +8.7 | ||
| Labour | 141 | 15.5 | -10.5 | ||
| Majority | 381 | 41.9 | |||
| Turnout | 910 | 17.9 | |||
| Liberal Democrats hold | Swing | ||||
| Party | Candidate | Votes | % | ±% | |
|---|---|---|---|---|---|
| Conservative | 1,220 | ||||
| Conservative | 1,127 | ||||
| Liberal Democrats | 797 | ||||
| Liberal Democrats | 787 | ||||
| Labour | 734 | ||||
| Labour | 681 | ||||
| Turnout | 5,346 | 33.7 | |||
| Conservative gain from Labour | Swing | ||||
| Conservative gain from Labour | Swing | ||||
| Party | Candidate | Votes | % | ±% | |
|---|---|---|---|---|---|
| Liberal Democrats | 430 | 51.7 | -6.2 | ||
| Conservative | 273 | 32.8 | +7.9 | ||
| Labour | 129 | 15.5 | -1.7 | ||
| Majority | 157 | 18.9 | |||
| Turnout | 832 | 27.1 | |||
| Liberal Democrats hold | Swing | ||||
| Party | Candidate | Votes | % | ±% | |
|---|---|---|---|---|---|
| Labour | 1,303 | 55.0 | -9.8 | ||
| Conservative | 770 | 32.5 | +13.1 | ||
| Liberal Democrats | 294 | 12.4 | -3.4 | ||
| Majority | 533 | 22.5 | |||
| Turnout | 2,367 | 29.3 | |||
| Labour hold | Swing | ||||
2003–2007
| Party | Candidate | Votes | % | ±% | |
|---|---|---|---|---|---|
| Liberal Democrats | 487 | 44.8 | -8.5 | ||
| Conservative | 458 | 42.1 | +13.2 | ||
| Labour | 142 | 13.1 | -4.7 | ||
| Majority | 29 | 2.7 | |||
| Turnout | 1,087 | 34.6 | |||
| Liberal Democrats hold | Swing | ||||
| Party | Candidate | Votes | % | ±% | |
|---|---|---|---|---|---|
| Conservative | 1,036 | 56.6 | -6.9 | ||
| Liberal Democrats | 422 | 23.0 | +9.1 | ||
| Labour | 373 | 20.4 | -2.1 | ||
| Majority | 614 | 33.6 | |||
| Turnout | 1,831 | 31.7 | |||
| Conservative hold | Swing | ||||
2007–2011
| Party | Candidate | Votes | % | ±% | |
|---|---|---|---|---|---|
| Liberal Democrats | Dave Hockey | 1,624 | |||
| Liberal Democrats | Pat Hockey | 1,546 | |||
| Conservative | John Farbrother | 1,179 | |||
| Conservative | Sarah Kitching | 1,165 | |||
| Labour | Terry Trollope | 225 | |||
| Labour | Ray Bazeley | 162 | |||
| Turnout | 5,901 | 54.0 | |||
| Liberal Democrats hold | Swing | ||||
2011–2015
| Party | Candidate | Votes | % | ±% | |
|---|---|---|---|---|---|
| Liberal Democrats | Tony Davis | 787 | 56.9 | -7.3 | |
| Labour | Michael McGrath | 243 | 17.6 | +3.5 | |
| UKIP | Aaron Foot | 213 | 15.4 | +15.4 | |
| Conservative | Kate Duffy | 139 | 10.1 | -11.6 | |
| Majority | 544 | 39.4 | |||
| Turnout | 1,382 | ||||
| Liberal Democrats hold | Swing | ||||
2015–2019
| Party | Candidate | Votes | % | ±% | |
|---|---|---|---|---|---|
| Conservative | Nic Labuschagne | 873 | 47.9 | +1.5 | |
| Labour | George Angus | 615 | 33.8 | +18.6 | |
| Liberal Democrats | Peter Bruce | 333 | 18.3 | -3.8 | |
| Majority | 258 | 14.2 | |||
| Turnout | 1,821 | ||||
| Conservative hold | Swing | ||||
| Party | Candidate | Votes | % | ±% | |
|---|---|---|---|---|---|
| Liberal Democrats | Louise Harris | 693 | 49.0 | +8.1 | |
| Conservative | Ian Livermore | 564 | 39.9 | +17.3 | |
| Labour | John Malone | 158 | 11.2 | -1.6 | |
| Majority | 129 | 9.1 | |||
| Turnout | 1,415 | ||||
| Liberal Democrats hold | Swing | ||||
2019–2023
| Party | Candidate | Votes | % | ±% | |
|---|---|---|---|---|---|
| Conservative | Liz Brennan | 1,819 | 37.8 | -6.5 | |
| Liberal Democrats | Raj Sood | 1,598 | 33.2 | +13.0 | |
| Labour | Sean Rhodes | 1,049 | 21.8 | -3.0 | |
| Green | Oliver Owen | 347 | 7.2 | +7.2 | |
| Majority | 221 | 4.6 | |||
| Turnout | 4,813 | ||||
| Conservative hold | Swing | ||||
References
- ^ "The District of South Gloucestershire (Electoral Changes) Order 1998". legislation.gov.uk. 3 November 1998. Retrieved 4 October 2015.
- ^ "South Gloucestershire". BBC News Online. Retrieved 16 August 2009.
- ^ "The District of South Gloucestershire (Electoral Changes) Order 2007". legislation.gov.uk. 25 January 2007. Retrieved 3 November 2015.
- ^ "The District of South Gloucestershire (Electoral Changes) Order 2018". legislation.gov.uk. 26 April 2018. Retrieved 3 May 2019.
- ^ "View district candidates (by name)". South Gloucestershire Council. Retrieved 16 August 2009.
- ^ "Local Elections Archive Project — Dodington Ward". www.andrewteale.me.uk. Retrieved 11 March 2024.
- ^ "Local Elections Archive Project — Winterbourne Ward". www.andrewteale.me.uk. Retrieved 11 March 2024.
- ^ "Local Elections Archive Project — Dodington Ward". www.andrewteale.me.uk. Retrieved 11 March 2024.
- ^ "Local Elections Archive Project — Frenchay and Downend Ward". www.andrewteale.me.uk. Retrieved 11 March 2024.