Rogatica
Рогатица | |
|---|---|
Town and
municipality | |
 View on Rogatica | |
 Location of Rogatica within Republika Srpska | |
| Coordinates: 43°47′55″N 19°00′13″E / 43.79861°N 19.00361°E | |
| Country | |
| Entity | |
| Geographical region | Podrinje |
| Government | |
| • Municipal mayor | Milorad Jagodić ( SNSD) |
| • Municipality | 645 km2 (249 sq mi) |
| Population (2013 census) | |
| • Town | 6,855 |
| • Municipality | 10,723 |
| • Municipality density | 17/km2 (43/sq mi) |
| Time zone | UTC+1 ( CET) |
| • Summer ( DST) | UTC+2 ( CEST) |
| Area code | 57 |
| Website |
www |


Rogatica ( Serbian Cyrillic: Рогатица) is a town and municipality in Republika Srpska, Bosnia and Herzegovina. As of 2013, it has a population of 10,723 inhabitants, while the town of Rogatica has a population of 6,855 inhabitants.
Geography
The town lies on the river Rakitnica, on the magistral road between Podromanija and Ustiprača, roughly 25 kilometres (16 mi) west of Višegrad and 45 km (28 mi) east of Sarajevo.
History
From October 1941 until January 1942, Serbian Chetniks killed around 2,000 Muslim civilians from the Rogatica district. [1]
In 1942, the Croatian fascist Ustaše regime slaughtered about 6,000 Serbs in Stari Brod near Rogatica and Miloševići. [2] [3]
Demographics
Population
| Population of settlements – Rogatica municipality | |||||
|---|---|---|---|---|---|
| Settlement | 1971. | 1981. | 1991. | 2013. | |
| Total | 25,501 | 23,771 | 21,812 | 10,723 | |
| 1 | Plješevica | 454 | 426 | ||
| 2 | Rogatica | 4,792 | 6,496 | 8,916 | 6,855 |
| 3 | Seljani | 474 | 276 | ||
Ethnic composition
| Ethnic composition – Rogatica town | |||||||
|---|---|---|---|---|---|---|---|
| 2013. | 1991. | 1981. | 1971. | ||||
| Total | 6,855 (100,0%) | 8,916 (100,0%) | 6,496 (100,0%) | 4,792 (100,0%) | |||
| Bosniaks | 5,681 (63,72%) | 3,855 (59,34%) | 3,172 (66,19%) | ||||
| Serbs | 2,971 (33,32%) | 1,998 (30,76%) | 1,524 (31,80%) | ||||
| Yugoslavs | 140 (1,570%) | 584 (8,990%) | 41 (0,856%) | ||||
| Others | 108 (1,211%) | 9 (0,139%) | 17 (0,355%) | ||||
| Croats | 16 (0,179%) | 21 (0,323%) | 25 (0,522%) | ||||
| Montenegrins | 15 (0,231%) | 10 (0,209%) | |||||
| Albanians | 9 (0,139%) | 2 (0,042%) | |||||
| Slovenes | 4 (0,062%) | 1 (0,021%) | |||||
| Macedonians | 1 (0,015%) | ||||||
| Ethnic composition – Rogatica municipality | |||||||
|---|---|---|---|---|---|---|---|
| 2013. | 1991. | 1981. | 1971. | ||||
| Total | 10,723 (100,0%) | 21 978 (100,0%) | 23,771 (100,0%) | 25,501 (100,0%) | |||
| Serbs | 9,527 (88,85%) | 8,391 (38,18%) | 8,877 (37,34%) | 10,208 (40,03%) | |||
| Bosniaks | 1,117 (10,42%) | 13,209 (60,10%) | 14,020 (58,98%) | 15,096 (59,20%) | |||
| Others | 60 (0,560%) | 173 (0,787%) | 31 (0,130%) | 66 (0,259%) | |||
| Croats | 19 (0,177%) | 19 (0,086%) | 32 (0,135%) | 45 (0,176%) | |||
| Yugoslavs | 186 (0,846%) | 762 (3,206%) | 62 (0,243%) | ||||
| Montenegrins | 22 (0,093%) | 17 (0,067%) | |||||
| Albanians | 20 (0,084%) | 4 (0,016%) | |||||
| Slovenes | 5 (0,021%) | 1 (0,004%) | |||||
| Macedonians | 2 (0,008%) | 2 (0,008%) | |||||
Economy
The following table gives a preview of total number of registered people employed in legal entities per their core activity (as of 2018): [4]
| Activity | Total |
|---|---|
| Agriculture, forestry and fishing | 255 |
| Mining and quarrying | - |
| Manufacturing | 363 |
| Electricity, gas, steam and air conditioning supply | 69 |
| Water supply; sewerage, waste management and remediation activities | 65 |
| Construction | 30 |
| Wholesale and retail trade, repair of motor vehicles and motorcycles | 346 |
| Transportation and storage | 48 |
| Accommodation and food services | 71 |
| Information and communication | 15 |
| Financial and insurance activities | 25 |
| Real estate activities | - |
| Professional, scientific and technical activities | 22 |
| Administrative and support service activities | 6 |
| Public administration and defense; compulsory social security | 180 |
| Education | 149 |
| Human health and social work activities | 104 |
| Arts, entertainment and recreation | 26 |
| Other service activities | 29 |
| Total | 1,803 |
Notable people
- Zehra Bajraktarević, singer
- Kemal Mešić, athlete
- Muhamed Mustafić, handball player
- Ibrahim Šehić, football goalkeeper
- Mersad Selimbegović, football player
- Nezir Škaljić, third mayor of Sarajevo (1899–1905)
- Safet Zec, painter
Gallery
-
 Ancient Roman tomb
 -
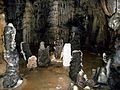
 Ossuary of the Serbian Army member killed in action in World War I
 -
-
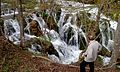 Waterfall located in the municipality
 -
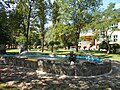 Park in the city
 -
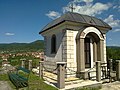
 Monastery of Saint John the Baptist
 -
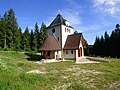
 Church in Obrtići


References
- ^ Čekić, Smail (1996). Genocid nad Bošnjacima u Drugom svjetskom ratu: dokumenti [Genocide against Bosniaks in the Second World War: documents]. Udruženje Muslimana za antigenocidne aktivnosti. p. 21.
- ^ Sokol, Anida (2014). "War Monuments: Instruments of Nation-building in Bosnia and Herzegovina". Croatian Political Science Review. 51 (5): 105–126.
- ^ "Prime Minister Višković attends the commemorating ceremony in memory of the Serbs killed in Stari Brod and Miloševići in 1942". Republic of Srpska Government. Retrieved 12 May 2020.
- ^ "Cities and Municipalities of Republika Srpska" (PDF). rzs.rs.ba. Republika Srspka Institute of Statistics. 25 December 2019. Retrieved 31 December 2019.
External links
| International | |
|---|---|
| National | |
Rogatica
Рогатица | |
|---|---|
Town and
municipality | |
|
View on Rogatica | |
|
Location of Rogatica within Republika Srpska | |
| Coordinates: 43°47′55″N 19°00′13″E / 43.79861°N 19.00361°E | |
| Country | |
| Entity | |
| Geographical region | Podrinje |
| Government | |
| • Municipal mayor | Milorad Jagodić ( SNSD) |
| • Municipality | 645 km2 (249 sq mi) |
| Population (2013 census) | |
| • Town | 6,855 |
| • Municipality | 10,723 |
| • Municipality density | 17/km2 (43/sq mi) |
| Time zone | UTC+1 ( CET) |
| • Summer ( DST) | UTC+2 ( CEST) |
| Area code | 57 |
| Website |
www |
Rogatica ( Serbian Cyrillic: Рогатица) is a town and municipality in Republika Srpska, Bosnia and Herzegovina. As of 2013, it has a population of 10,723 inhabitants, while the town of Rogatica has a population of 6,855 inhabitants.
Geography
The town lies on the river Rakitnica, on the magistral road between Podromanija and Ustiprača, roughly 25 kilometres (16 mi) west of Višegrad and 45 km (28 mi) east of Sarajevo.
History
From October 1941 until January 1942, Serbian Chetniks killed around 2,000 Muslim civilians from the Rogatica district. [1]
In 1942, the Croatian fascist Ustaše regime slaughtered about 6,000 Serbs in Stari Brod near Rogatica and Miloševići. [2] [3]
Demographics
Population
| Population of settlements – Rogatica municipality | |||||
|---|---|---|---|---|---|
| Settlement | 1971. | 1981. | 1991. | 2013. | |
| Total | 25,501 | 23,771 | 21,812 | 10,723 | |
| 1 | Plješevica | 454 | 426 | ||
| 2 | Rogatica | 4,792 | 6,496 | 8,916 | 6,855 |
| 3 | Seljani | 474 | 276 | ||
Ethnic composition
| Ethnic composition – Rogatica town | |||||||
|---|---|---|---|---|---|---|---|
| 2013. | 1991. | 1981. | 1971. | ||||
| Total | 6,855 (100,0%) | 8,916 (100,0%) | 6,496 (100,0%) | 4,792 (100,0%) | |||
| Bosniaks | 5,681 (63,72%) | 3,855 (59,34%) | 3,172 (66,19%) | ||||
| Serbs | 2,971 (33,32%) | 1,998 (30,76%) | 1,524 (31,80%) | ||||
| Yugoslavs | 140 (1,570%) | 584 (8,990%) | 41 (0,856%) | ||||
| Others | 108 (1,211%) | 9 (0,139%) | 17 (0,355%) | ||||
| Croats | 16 (0,179%) | 21 (0,323%) | 25 (0,522%) | ||||
| Montenegrins | 15 (0,231%) | 10 (0,209%) | |||||
| Albanians | 9 (0,139%) | 2 (0,042%) | |||||
| Slovenes | 4 (0,062%) | 1 (0,021%) | |||||
| Macedonians | 1 (0,015%) | ||||||
| Ethnic composition – Rogatica municipality | |||||||
|---|---|---|---|---|---|---|---|
| 2013. | 1991. | 1981. | 1971. | ||||
| Total | 10,723 (100,0%) | 21 978 (100,0%) | 23,771 (100,0%) | 25,501 (100,0%) | |||
| Serbs | 9,527 (88,85%) | 8,391 (38,18%) | 8,877 (37,34%) | 10,208 (40,03%) | |||
| Bosniaks | 1,117 (10,42%) | 13,209 (60,10%) | 14,020 (58,98%) | 15,096 (59,20%) | |||
| Others | 60 (0,560%) | 173 (0,787%) | 31 (0,130%) | 66 (0,259%) | |||
| Croats | 19 (0,177%) | 19 (0,086%) | 32 (0,135%) | 45 (0,176%) | |||
| Yugoslavs | 186 (0,846%) | 762 (3,206%) | 62 (0,243%) | ||||
| Montenegrins | 22 (0,093%) | 17 (0,067%) | |||||
| Albanians | 20 (0,084%) | 4 (0,016%) | |||||
| Slovenes | 5 (0,021%) | 1 (0,004%) | |||||
| Macedonians | 2 (0,008%) | 2 (0,008%) | |||||
Economy
The following table gives a preview of total number of registered people employed in legal entities per their core activity (as of 2018): [4]
| Activity | Total |
|---|---|
| Agriculture, forestry and fishing | 255 |
| Mining and quarrying | - |
| Manufacturing | 363 |
| Electricity, gas, steam and air conditioning supply | 69 |
| Water supply; sewerage, waste management and remediation activities | 65 |
| Construction | 30 |
| Wholesale and retail trade, repair of motor vehicles and motorcycles | 346 |
| Transportation and storage | 48 |
| Accommodation and food services | 71 |
| Information and communication | 15 |
| Financial and insurance activities | 25 |
| Real estate activities | - |
| Professional, scientific and technical activities | 22 |
| Administrative and support service activities | 6 |
| Public administration and defense; compulsory social security | 180 |
| Education | 149 |
| Human health and social work activities | 104 |
| Arts, entertainment and recreation | 26 |
| Other service activities | 29 |
| Total | 1,803 |
Notable people
- Zehra Bajraktarević, singer
- Kemal Mešić, athlete
- Muhamed Mustafić, handball player
- Ibrahim Šehić, football goalkeeper
- Mersad Selimbegović, football player
- Nezir Škaljić, third mayor of Sarajevo (1899–1905)
- Safet Zec, painter
Gallery
-
Ancient Roman tomb
-
Ossuary of the Serbian Army member killed in action in World War I
-
-
Waterfall located in the municipality
-
Park in the city
-
Monastery of Saint John the Baptist
-
Church in Obrtići
References
- ^ Čekić, Smail (1996). Genocid nad Bošnjacima u Drugom svjetskom ratu: dokumenti [Genocide against Bosniaks in the Second World War: documents]. Udruženje Muslimana za antigenocidne aktivnosti. p. 21.
- ^ Sokol, Anida (2014). "War Monuments: Instruments of Nation-building in Bosnia and Herzegovina". Croatian Political Science Review. 51 (5): 105–126.
- ^ "Prime Minister Višković attends the commemorating ceremony in memory of the Serbs killed in Stari Brod and Miloševići in 1942". Republic of Srpska Government. Retrieved 12 May 2020.
- ^ "Cities and Municipalities of Republika Srpska" (PDF). rzs.rs.ba. Republika Srspka Institute of Statistics. 25 December 2019. Retrieved 31 December 2019.
External links
 | |||||||||||||||
| International | |
|---|---|
| National | |