| Results of the Democratic Party presidential primaries | |
|---|---|
←
2020 |
|
2024 U.S. presidential election | |
|---|---|
|
|
| Democratic Party | |
| Republican Party | |
| Third parties | |
| Related races | |
| |
This article contains the results of the 2024 Democratic Party presidential primaries and caucuses, the processes by which the Democratic Party selects delegates to attend the 2024 Democratic National Convention. The series of primaries, caucuses, and state conventions culminate in the national convention, where the delegates cast their votes to formally select a candidate. A simple majority of the total delegate votes is required to become the nominee.
Overview of results
| |
| Winner not yet declared |
-
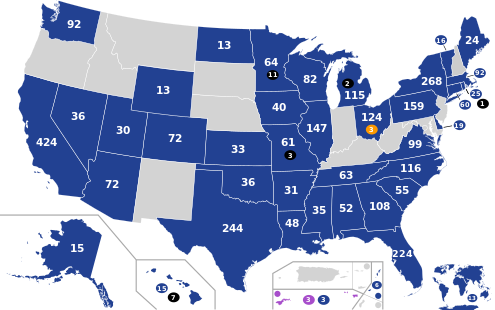 Initial pledged delegate allocation

|
| class="col-break col-break-2" |
-
 First-place results by county

Major candidates
| Legend: | 1st place (popular vote) |
2nd place (popular vote) |
3rd place (popular vote) |
Candidate has withdrawn |
Candidate not on ballot |
|---|
| Date (daily totals) [1] |
Pledged delegates |
Contest |
.jpg) Joe Biden |
.jpg) Dean Phillips (withdrawn) |
_(cropped).jpg) Marianne Williamson |
 Jason Palmer |
Uncommitted |
 Other |
Ref |
|---|---|---|---|---|---|---|---|---|---|
| Cancelled | 224 | Florida | 224 delegates [a] | Primary cancelled | [2] | ||||
| 19 | Delaware | 19 delegates [a] | [3] [4] [5] | ||||||
| January 23 | 0 [b] | New Hampshire | 63.8%
[c] 79,100 votes |
19.7% 24,377 votes |
4.1% 5,016 votes |
0.1% 142 votes |
Not on ballot | 12.4%
[d] 15,361 votes |
[7] |
| February 3 | 55 | South Carolina | 96.2% 55 delegates 126,493 votes |
1.7% 2,247 votes |
2.1% 2,732 votes |
Not on ballot | [8] | ||
| February 6 | 36 | Nevada | 89.3% 36 delegates 119,758 votes |
Not on ballot | 3.1% 4,101 votes |
0.4% 530 votes |
5.6% 7,448 votes |
1.7%
[e] 2,250 votes |
[9] |
| February 27 | 117 | Michigan | 81.1% 115 delegates 625,221 votes |
2.7% 20,684 votes |
3.0% 22,865 votes |
Not on ballot | 13.2% 2 delegates 101,623 votes |
0.0% 178 votes [f] |
[10] |
| January 12 – March 5 | 40 |
Iowa (mail-in votes) |
90.4% 40 delegates 12,337 votes |
2.9% 394 votes |
2.2% 307 votes |
Not on ballot | 4.5% 614 votes |
Not on ballot | [11] |
| March 5 ( Super Tuesday) (1,380) |
52 | Alabama | 89.5% 52 delegates 168,080 votes |
4.5% 8,442 votes |
Not on ballot | 6.0% 11,283 votes |
Not on ballot | [12] | |
| 6 | American Samoa | 44.0% 3 delegates 40 votes |
0.0% 0 votes |
Not on ballot | 56.0% 3 delegates 51 votes |
Not on ballot | [13] | ||
| 31 | Arkansas | 88.5% 31 delegates 71,978 votes |
2.9% 2,346 votes |
4.8% 3,883 votes |
Not on ballot | 3.9%
[g] 3,107 votes |
[14] | ||
| 424 | California | 89.1% 424 delegates 3,207,687 votes |
2.8% 100,284 votes |
4.1% 146,356 votes |
Not on ballot | 4.1%
[h] 143,430 votes |
[15] | ||
| 72 | Colorado | 82.5% 72 delegates 477,365 votes |
3.1% 17,936 votes |
2.9% 16,761 votes |
0.7% 3,986 votes |
9.0% 52,122 votes |
1.9%
[i] 10,787 votes |
[16] | |
| 24 | Maine | 82.8% 24 delegates 60,018 votes |
6.4% 4,623 votes |
Not on ballot | 10.9%
[j] 7,839 ballots |
[17] | |||
| 92 | Massachusetts | 80.5% 91 delegates 533,096 votes |
4.5% 29,728 votes |
3.1% 20,402 votes |
Not on ballot | 9.1% 1 delegate 60,236 votes |
2.8% 19,147 votes [k] |
[18] | |
| 75 | Minnesota | 70.1% 64 delegates 171,278 votes |
7.8% 18,960 votes |
1.4% 3,459 votes |
0.3% 758 votes |
18.8% 11 delegates 45,914 votes |
1.6%
[l] 3,912 votes |
[19] | |
| 116 | North Carolina | 87.3% 113 delegates 609,680 votes |
Not on ballot | 12.7% 88,900 votes |
Not on ballot | [20] | |||
| 36 | Oklahoma | 73.0% 36 delegates 66,882 votes |
8.9% 8,182 votes |
9.1% 8,356 votes |
Not on ballot | 9.1%
[m] 8,224 votes |
[21] | ||
| 63 | Tennessee | 92.2% 63 delegates 122,835 votes |
Not on ballot | 7.8% 10,461 votes |
Not on ballot | [22] | |||
| 244 | Texas | 84.6% 244 delegates 831,247 votes |
2.7% 26,473 votes |
4.4% 43,667 votes |
Not on ballot | 8.2%
[n] 80,682 votes |
[23] | ||
| 30 | Utah | 86.9% 30 delegates 58,872 votes |
4.5% 3,024 votes |
5.2% 3,521 votes |
Not on ballot | 3.5%
[o] 2,362 votes |
[24] | ||
| 16 | Vermont | 83.0% 16 delegates 56,924 votes |
2.8% 1,942 votes |
4.2% 2,873 votes |
0.6% 404 votes |
Not on ballot | 9.4%
[p] 6,456 votes |
[25] | |
| 99 | Virginia | 88.5% 99 delegates 317,329 votes |
3.5% 12,586 votes |
8.0% 28,599 votes |
Not on ballot | [26] | |||
| March 6 | 22 | Hawaii | 66.0% 15 delegates 1,032 votes |
1.0% 15 votes |
3.2% 50 votes |
0.4% 6 votes |
29.1% 7 delegates 455 votes |
0.3%
[q] 5 votes |
[27] |
| March 12 (254) |
13 | Democrats Abroad | 80.1% 13 delegates 6,910 votes |
Not on ballot | 6.7% 576 votes |
Not on ballot | 13.2% 1,136 votes |
Not on ballot | [28] |
| 108 | Georgia | 93.1% 108 delegates 272,363 votes |
1.8% 5,205 votes |
2.9% 8,569 ballots |
Not on ballot | 2.2% 6,429 votes [r] |
[29] [30] | ||
| 35 | Mississippi | 98.7% 35 delegates 87,922 votes |
Not on ballot | 1.3% 1,187 votes [f] |
[31] | ||||
| 6 | Northern Mariana Islands | 93.9% 6 delegates 93 votes |
0.0% 0 votes |
2.0% 2 votes |
4.0% 4 votes |
Not on ballot | [32] | ||
| 92 | Washington | 83.5% 92 delegates 763,576 votes |
2.8% 25,185 votes |
2.8% 25,297 votes |
Not on ballot | 9.8% 2 delegates 89,753 votes |
0.0% 10,964 votes [f] |
[33] | |
| March 19 (379) |
72 | Arizona | 89.3% 72 delegates 375,110 votes |
2.8% 11,611 votes |
3.8% 15,844 votes |
0.9% 3,752 votes |
Not on ballot | 3.3% 13,857 votes [s] |
[34] |
| 147 |
Illinois (95% in) |
91.5% 147 delegates 720,333 votes |
3.2% 25,124 votes |
3.6% 27,991 votes |
Not on ballot | Not on ballot | 1.8% 14,144 votes [t] |
||
| 33 | Kansas | 83.8% 33 delegates 35,369 votes |
1.3% 557 votes |
3.4% 1,453 votes |
1.2% 497 votes |
10.3% 4,330 votes |
Not on ballot | [35] | |
| 127 | Ohio | 87.1% 118 delegates 456,523 votes |
12.9% 67,889 votes |
Not on ballot | [36] | ||||
| March 23 (112) |
48 | Louisiana | 86.1% 48 delegates 143,371 votes |
2.6% 4,351 votes |
4.7% 7,898 votes |
Not on ballot | 6.7% 10,979 votes [u] |
[37] | |
| 64 | Missouri | 85.3% 61 delegates 16,295 votes |
0.9% 178 votes |
1.6% 298 votes |
0.2% 36 votes |
11.7% 3 delegates 2,229 votes |
0.3% 64 votes [v] |
[38] | |
| March 30 | 13 | North Dakota | 92.4% 13 delegates 840 votes |
1.8% 16 votes |
3.4% 31 votes |
0.2% 2 votes |
Not on ballot | 2.2% 20 votes [w] |
[39] |
| April 2 (436) |
60 | Connecticut | 84.9% 60 delegates 55,697 votes |
0.9% 578 votes |
2.3% 1,497 votes |
Not on ballot | 11.4% 7,489 votes |
0.5% 317 votes [x] |
[40] |
| 268 | New York | 91.5% 268 delegates 278,669 votes |
3.6% 10,989 votes |
4.9% 14,973 votes |
Not on ballot | [41] | |||
| 26 | Rhode Island | 82.6% 25 delegates 21,336 votes |
2.6% 660 votes |
Not on ballot | 14.8% 1 delegate 3,834 votes |
TBD [y] | [42] | ||
| 82 | Wisconsin | 88.6% 82 delegates 511,845 votes |
3.1% 17,714 votes |
Not on ballot | 8.3% 48,162 votes |
Not on ballot | [43] | ||
| April 13 (28) |
15 | Alaska | Voice vote 15 delegates |
Not on ballot | Not on ballot | [44] | |||
| 13 | Wyoming | 96.0% 13 delegates 380 votes |
0.0% 0 votes |
0.3% 1 vote |
0.0% 0 votes |
3.3% 13 votes |
0.5% 2 votes [z] |
[45] | |
| Totals as of April 18 |
3,067 | See above | 86.7% 3,073 delegates 11,298,198 votes |
3.4% 446,229 votes |
3.1% 407,235 votes |
0.1% 3 delegates 10,042 votes |
4.1% 27 delegates 530,528 votes |
2.2% 280,984 votes | |
| April 23 | 159 | Pennsylvania | 87.9% 159 delegates 943,232 votes |
6.4% 69,113 votes |
Not on ballot [y] | 5.6% 60,223 votes [f] |
[46] | ||
| April 28 | 55 | Puerto Rico | TBD | TBD | TBD | Not on ballot | |||
| May 7 | 79 | Indiana | TBD | Not on ballot | TBD [f] | ||||
| May 14 (144) |
95 | Maryland | TBD | TBD | TBD | Not on ballot | TBD | Not on ballot | |
| 29 | Nebraska | TBD | TBD | Not on ballot | |||||
| 20 | West Virginia | TBD | TBD | Not on ballot | TBD | Not on ballot | TBD [q] | ||
| May 21 (119) |
53 | Kentucky | TBD | TBD | TBD | Not on ballot | TBD | Not on ballot | |
| 66 | Oregon | TBD | Not on ballot | TBD | Not on ballot | ||||
| May 23 | 23 | Idaho | Filing deadline not yet passed | ||||||
| June 4 (216) |
20 | Washington D.C. | TBD | TBD | TBD | Not on ballot | TBD | TBD [q] | |
| 20 | Montana | TBD | Not on ballot | TBD | |||||
| 126 | New Jersey | Filing deadline not yet passed | |||||||
| 34 | New Mexico | TBD | TBD | TBD | Not on ballot | TBD | Not on ballot | ||
| 16 | South Dakota | Filing deadline not yet passed | |||||||
| June 8 (13) |
6 | Guam | No filing deadline | ||||||
| 7 | U.S. Virgin Islands | No filing deadline | |||||||
| Total | 3,934 [1] | N/A | TBD | TBD | TBD | TBD | TBD | TBD | |
Other candidates
Over a thousand individuals have filed with the Federal Election Commission to run for president. [47]
Candidates on the ballot in at least three states
| Legend: | 1st place (popular vote) |
2nd place (popular vote) |
3rd place (popular vote) |
Candidate has withdrawn |
Candidate not on ballot |
|---|
| Candidates | Eban Cambridge |
Gabriel Cornejo |
Frankie Lozada |
Stephen Lyons |
Armando Perez-Serrato |
Cenk Uygur | ||
|---|---|---|---|---|---|---|---|---|

| ||||||||
| Jan 23 | 0 | NH | 47 | 86 | 73 | 80 | 68 | Unknown [aa] |
| Feb 6 | 36 | NV | 0 | 811 | 315 | 147 | 264 | 0 |
| Mar 5 | 31 | AR | 786 | 1,442 | 879 | |||
| 424 | CA | 12,670 | 41,183 | 20,975 | 42,814 | 0 | ||
| 86 | CO | 4,310 | 2,402 | 1,480 | 2,591 | 0 | ||
| 92 | MN | 269 | 355 | 327 | 402 | 721 | ||
| 40 | OK | 0 | 4,435 | 1,805 | 1,971 | |||
| 272 | TX | 0 | 17,137 | 11,259 | 27,381 | 16,072 | ||
| 34 | UT | 0 | 1,503 | 859 | 0 | |||
| 23 | VT | 0 | 0 | 700 | ||||
| Mar 19 | 72 | AZ | 0 | 6,064 | 4,925 | 2,709 | 0 | |
| 147 | IL | 0 | 0 | 14,144 | 0 | 0 | ||
| 33 | KS | 0 | 0 | |||||
| Mar 23 | 54 | LA | 0 | 2,244 | 3,770 | 1,200 | 1,113 | |
| 70 | MO | 0 | 40 | 24 | 0 | |||
| Mar 30 | 14 | ND | 4 | 0 | 0 | 3 | 0 | 13 |
| Apr 2 | 60 | CT | 316 | |||||
| Totals as of April 4 | 12,990 | 72,079 | 34,945 | 31,271 | 76,204 | 19,793 | ||
Candidates on the ballot in fewer than three states
| National popular vote totals for other candidates | ||||||
|---|---|---|---|---|---|---|
| Candidate | Votes | States on ballot | ||||
| Other‡ | 4,949 | Various states | ||||
| "President" R. Boddie | 136 | 25,304 | ( NH, CA) | |||
| Mark Prascak | 35 | ( NV) | ||||
| Derek Nadeau | 1,587 | ( NH) | ||||
| Vermin Supreme | 905 | ( NH) | ||||
| John Vail | 679 | ( NH) | ||||
| Donald Picard | 365 | 117 | ( NH, NV) | |||
| Paperboy Prince | 316 | ( NH) | ||||
| Paul V. LaCava | 175 | ( NH) | ||||
| Mark Stewart Greenstein | 131 | 779 | ( NH, VT) | |||
| Terrisa Bukovinac | 101 | ( NH) | ||||
| Tom Koos | 71 | ( NH) | ||||
| Star Locke | 57 | 8,326 | ( NH, TX) | |||
| Raymond Michael Moroz | 51 | ( NH) | ||||
| Richard Rist | 37 | ( NH) | ||||
| Superpayaseria Crystalroc | 128 | ( NV) | ||||
| Bob Ely | 2,652 | ( LA) | ||||
| Brent Foutz | 91 | ( NV) | ||||
| John Haywood | 225 | ( NV) | ||||
| Stephen Alan Leon | 92 | ( NV) | ||||
†Sometimes listed as "None of the Above"
‡Some states don't count some write-ins or minor candidates individually but lump them together.
Candidates with significant write-in totals
The following candidates and terms received significant numbers of tabulated votes as a write-in candidate nationwide.
| Candidate | Votes |
|---|---|
| Nikki Haley [ab] | 4,937 |
| Donald Trump [ab] | 2,143 |
| "Ceasefire" | 1,512 |
| Robert F. Kennedy, Jr. [ab] | 754 |
| Rashida Tlaib [ab] | 735 |
| "Blank" | 539 |
| Bernie Sanders [ab] | 405 |
| Cornel West [ab] | 77 |
Results by state
New Hampshire

- 50–60%
- 60–70%

- 40–50%
- 50–60%
- 60–70%
- 70–80%
- 80–90%
- >90%
- 30–40%
- 80–90%
| Candidate | Votes | Percentage | |||
|---|---|---|---|---|---|
| Joe Biden (incumbent; write-in) | 79,100 | 63.8% | |||
| Dean Phillips | 24,377 | 19.7% | |||
| Marianne Williamson | 5,016 | 4.0% | |||
| Nikki Haley (write-in) (Republican) | 4,760 | 3.8% | |||
| Donald Trump (write-in) (Republican) | 2,079 | 1.7% | |||
| Derek Nadeau | 1,616 | 1.3% | |||
| " Ceasefire" (write-in) [48] | 1,512 | 1.2% | |||
| Vermin Supreme | 912 | 0.7% | |||
| John Vail | 685 | 0.6% | |||
| Robert F. Kennedy Jr. (write-in) (Independent) | 439 | 0.4% | |||
| Donald Picard | 371 | 0.3% | |||
| Paperboy Prince | 326 | 0.3% | |||
| Paul V. LaCava | 176 | 0.1% | |||
| Jason Michael Palmer | 142 | 0.1% | |||
| President R. Boddie | 136 | 0.1% | |||
| Mark Stewart Greenstein | 133 | 0.1% | |||
| Bernie Sanders (write-in) (Independent) | 125 | 0.1% | |||
| Terrisa Bukovinac | 101 | <0.1% | |||
| Gabriel Cornejo | 86 | <0.1% | |||
| Stephen P. Lyons | 80 | <0.1% | |||
| Frankie Lozada | 73 | <0.1% | |||
| Tom Koos | 71 | <0.1% | |||
| Armando "Mando" Perez-Serrato | 68 | <0.1% | |||
| Star Locke | 59 | <0.1% | |||
| Raymond Michael Moroz | 52 | <0.1% | |||
| Eban Cambridge | 47 | <0.1% | |||
| Chris Christie (write-in) (Republican) | 41 | <0.1% | |||
| Richard Rist | 37 | <0.1% | |||
| Ron DeSantis (write-in) (Republican) | 33 | <0.1% | |||
| Vivek Ramaswamy (write-in) (Republican) | 2 | <0.1% | |||
| Other write-ins [ac] | 1,341 | 1.1% | |||
| Total: | 123,996 | 100.00% | |||
| Source: [49] | |||||
No delegates were awarded from the New Hampshire primary.
South Carolina

- >90%
| Candidate | Votes | Percentage | Actual delegate count | ||
|---|---|---|---|---|---|
| Pledged | Unpledged | Total | |||
| Joe Biden (incumbent) | 126,493 | 96.2% | 55 | TBD | 55 |
| Marianne Williamson | 2,732 | 2.1% | 0 | TBD | 0 |
| Dean Phillips | 2,247 | 1.7% | 0 | 0 | |
| Total: | 131,472 | 100% | 55 | 10 | 65 |
Nevada

- 60–70%
- 70–80%
- 80–90%
- >90%
| Candidate | Votes | Percentage | Actual delegate count | ||
|---|---|---|---|---|---|
| Pledged | Unpledged | Total | |||
| Joe Biden (incumbent) | 119,758 | 89.3% | 36 | 36 | |
| None of These Candidates | 7,448 | 5.6% | |||
| Marianne Williamson | 4,101 | 3.1% | |||
| Gabriel Cornejo | 811 | 0.6% | |||
| Jason Palmer | 530 | 0.4% | |||
| Frankie Lozada | 315 | 0.2% | |||
| Armando Perez-Serrato | 264 | 0.2% | |||
| John Haywood | 241 | 0.2% | |||
| Stephen Lyons | 147 | 0.1% | |||
| Superpayaseria Crystalroc | 133 | 0.1% | |||
| Donald Picard | 124 | 0.1% | |||
| Brent Foutz | 93 | 0.1% | |||
| Stephen Alan Leon | 89 | 0.1% | |||
| Mark R. Prascak | 33 | <0.1% | |||
| Total: | 134,087 | 100% | 36 | 13 | 49 |
| Source: [51] | |||||
Michigan

- 70–80%
- 80–90%

- 70–80%
- 80–90%
| Candidate | Votes | Percentage | Actual delegate count | ||
|---|---|---|---|---|---|
| Pledged | Unpledged | Total | |||
| Joe Biden (incumbent) | 625,221 | 81.1% | 115 | 115 | |
| Uncommitted | 101,623 | 13.2% | 2 | 2 | |
| Marianne Williamson (withdrawn) | 22,865 | 3.0% | |||
| Dean Phillips | 20,684 | 2.7% | |||
| Write-in votes | 178 | <0.1% | |||
| Total: | 770,571 | 100% | 117 | 23 | 140 |
| Source: [52] | |||||
Alabama

- 60–70%
- 70–80%
- 80–90%
- >90%
| Candidate | Votes | Percentage | Actual delegate count | ||
|---|---|---|---|---|---|
| Bound | Unbound | Total | |||
| Joe Biden (incumbent) | 168,080 | 89.5% | 52 | ||
| Uncommitted | 11,283 | 6.0% | |||
| Dean Phillips | 8,442 | 4.5% | |||
| Total: | 187,805 | 100.00% | 50 | 50 | |
| Source: [53] | |||||
Arkansas

- 70–80%
- 80–90%
- >90%
| Candidate | Votes | Percentage | Actual delegate count | ||
|---|---|---|---|---|---|
| Bound | Unbound | Total | |||
| Joe Biden (incumbent) | 71,978 | 88.5% | 31 | ||
| Marianne Williamson | 3,883 | 4.8% | |||
| Dean Phillips | 2,346 | 2.9% | |||
| Stephen Lyons | 1,442 | 1.8% | |||
| Armando Perez-Serrato | 879 | 1.1% | |||
| Frankie Lozada | 786 | 1.0% | |||
| Total: | 81,314 | 100.00% | 37 | 37 | |
| Source: [54] | |||||
American Samoa
| Candidate | Votes | Percentage | Actual delegate count | ||
|---|---|---|---|---|---|
| Bound | Unbound | Total | |||
| Jason Palmer | 51 | 56.0% | 3 | ||
| Joe Biden (incumbent) | 40 | 44.0% | 3 | ||
| Dean Phillips | 0 | 0.0% | |||
| Total: | 91 | 100.00% | 6 | 6 | |
| Source: [55] | |||||
California

- 80–90%
- >90%

- 70–80%
- 80–90%
- >90%
| Candidate | Votes | Percentage | Actual delegate count | ||
|---|---|---|---|---|---|
| Bound | Unbound | Total | |||
| Joe Biden (incumbent) | 3,207,687 | 89.1% | 424 | 424 | |
| Marianne Williamson | 146,356 | 4.1% | |||
| Dean Phillips | 100,284 | 2.8% | |||
| Armando Perez-Serrato | 43,105 | 1.2% | |||
| Gabriel Cornejo | 41,390 | 1.2% | |||
| "President" R. Boddie | 25,455 | 0.7% | |||
| Stephen P. Lyons | 21,062 | 0.6% | |||
| Eban Cambridge | 12,758 | 0.3% | |||
| Total (including write-ins): | 3,598,126 | 100.00% | 424 | 73 | 497 |
| Source: [56] [57] | |||||
Colorado

- 50–60%
- 60–70%
- 70–80%
- 80–90%
- >90%
| Candidate | Votes | Percentage | Actual delegate count | ||
|---|---|---|---|---|---|
| Pledged | Unpledged | Total | |||
| Joe Biden (incumbent) | 477,365 | 82.5% | 72 | 72 | |
| Noncommitted Delegate | 52,122 | 9.0% | |||
| Dean Phillips | 17,936 | 3.1% | |||
| Marianne Williamson | 16,761 | 2.9% | |||
| Gabriel Cornejo | 4,313 | 0.7% | |||
| Jason Palmer | 3,986 | 0.7% | |||
| Armando Perez-Serrato | 2,591 | 0.5% | |||
| Frankie Lozada | 2,402 | 0.4% | |||
| Stephen Lyons | 1,481 | 0.3% | |||
| Total: | 578,957 | 100% | 72 | 72 | |
| Source: [58] | |||||
Iowa

- 60–70%
- 70–80%
- 80–90%
- >90%
| Candidate | Votes | Percentage | Actual delegate count | ||
|---|---|---|---|---|---|
| Pledged | Unpledged | Total | |||
| Joe Biden (incumbent) | 12,337 | 90.4% | 40 | ||
| Uncommitted | 614 | 4.5% | |||
| Dean Phillips | 394 | 2.9% | |||
| Marianne Williamson [ad] | 307 | 2.2% | |||
| Total: | 13,652 | 100.0% | 40 | 46 | |
| Source: [59] | |||||
Maine

- 80–90%
- >90%
| Candidate | Votes | Percentage | Actual delegate count | ||
|---|---|---|---|---|---|
| Pledged | Unpledged | Total | |||
| Joe Biden (incumbent) | 60,018 | 82.8% | 24 | ||
| Dean Phillips | 4,623 | 6.4% | |||
| Other candidates | 480 | 0.7% | |||
| Blank ballots | 7,359 | 10.2% | |||
| Total: | 72,480 | 100% | 24 | 8 | 32 |
| Source: [60] | |||||
Massachusetts

- 70–80%
- 80–90%
| Candidate | Votes | Percentage | Actual delegate count | ||
|---|---|---|---|---|---|
| Pledged | Unpledged | Total | |||
| Joe Biden (incumbent) | 533,096 | 80.5% | 91 | ||
| No Preference | 60,236 | 9.1% | 1 | ||
| Dean Phillips | 29,728 | 4.5% | |||
| Marianne Williamson | 20,402 | 3.1% | |||
| Other candidates | 10,135 | 1.5% | |||
| Cenk Uygur (write-in) | 82 | <0.1% | |||
| Blank ballots | 8,930 | 1.3% | |||
| Total: | 662,609 | 100% | 92 | 92 | |
| Source: [61] | |||||
Minnesota

- 50–60%
- 60–70%
- 70–80%
- 80–90%

- 50–60%
- 60–70%
- 70–80%
| Candidate | Votes | Percentage | Actual delegate count | ||
|---|---|---|---|---|---|
| Pledged | Unpledged | Total | |||
| Joe Biden (incumbent) | 171,278 | 70.1% | 64 | ||
| Uncommitted | 45,914 | 18.8% | 11 | ||
| Dean Phillips | 18,960 | 7.8% | |||
| Marianne Williamson | 3,459 | 1.4% | |||
| Write-in votes | 2,000 | 0.8% | |||
| Jason Palmer | 758 | 0.3% | |||
| Cenk Uygur | 692 | 0.3% | |||
| Armando Perez-Serrato | 372 | 0.2% | |||
| Gabriel Cornejo | 323 | 0.1% | |||
| Frankie Lozada | 290 | 0.1% | |||
| Eban Cambridge | 235 | 0.1% | |||
| Total: | 242,594 | 100% | 75 | 17 | 92 |
| Source: [62] | |||||
North Carolina

- 60–70%
- 70–80%
- 80–90%
- >90%
| Candidate | Votes | Percentage | Actual delegate count | ||
|---|---|---|---|---|---|
| Pledged | Unpledged | Total | |||
| Joe Biden (incumbent) | 609,680 | 87.3% | 113 | ||
| No Preference | 88,900 | 12.7% | |||
| Total: | 698,580 | 100.0% | 132 | 132 | |
| Source: [63] | |||||
Oklahoma

- 30–40%
- 40–50%
- 50–60%
- 60–70%
- 70–80%
- 80–90%
- 40–50%
| Candidate | Votes | Percentage | Actual delegate count | ||
|---|---|---|---|---|---|
| Pledged | Unpledged | Total | |||
| Joe Biden (incumbent) | 66,882 | 72.98% | 36 | 36 | |
| Marianne Williamson | 8,356 | 9.12% | |||
| Dean Phillips | 8,182 | 8.93% | |||
| Stephen Lyons | 4,441 | 4.85% | |||
| Cenk Uygur | 1,974 | 2.15% | |||
| Armando Perez-Serrato | 1,809 | 1.97% | |||
| Total: | 91,644 | 100.00% | 40 | 40 | |
| Source: [64] | |||||
Tennessee

- 80–90%
- >90%
| Candidate | Votes | Percentage | Actual delegate count | ||
|---|---|---|---|---|---|
| Pledged | Unpledged | Total | |||
| Joe Biden (incumbent) | 122,803 | 92.14% | 63 | 63 | |
| Uncommitted | 10,475 | 7.86% | |||
| Total: | 133,278 | 100.00% | 63 | 7 | 70 |
| Source: [65] [66] [67] | |||||
Texas

- 40–50%
- 50–60%
- 60–70%
- 70–80%
- 80–90%
- >90%
- 100%
| Candidate | Votes | Percentage | Actual delegate count | ||
|---|---|---|---|---|---|
| Pledged | Unpledged | Total | |||
| Joe Biden (incumbent) | 831,247 | 84.6% | 244 | 244 | |
| Marianne Williamson | 43,667 | 4.5% | |||
| Armando Perez-Serrato | 27,473 | 2.8% | |||
| Dean Phillips | 26,473 | 2.7% | |||
| Gabriel Cornejo | 17,196 | 1.8% | |||
| Cenk Uygur | 16,100 | 1.6% | |||
| Frankie Lozada | 11,311 | 1.2% | |||
| Star Locke | 8,602 | 0.9% | |||
| Total: | 982,069 | 100% | 272 | 272 | |
| Source: [68] | |||||
Utah
| Candidate | Votes | Percentage | Actual delegate count | ||
|---|---|---|---|---|---|
| Pledged | Unpledged | Total | |||
| Joe Biden (incumbent) | 58,872 | 86.9% | 30 | ||
| Marianne Williamson | 3,521 | 5.2% | |||
| Dean Phillips | 3,024 | 4.5% | |||
| Gabriel Cornejo | 1,503 | 2.2% | |||
| Frankie Lozada | 859 | 1.3% | |||
| Total: | 67,779 | 100% | 34 | 34 | |
| Source: [69] | |||||
Vermont

- 80–90%
- >90%
| Candidate | Votes | Percentage | Actual delegate count | ||
|---|---|---|---|---|---|
| Pledged | Unpledged | Total | |||
| Joe Biden (incumbent) | 56,924 | 82.98% | 16 | ||
| Marianne Williamson | 2,873 | 4.19% | |||
| Dean Phillips | 1,942 | 2.83% | |||
| Other write-ins | 1,260 | 1.84% | |||
| Mark Greenstein | 779 | 1.14% | |||
| Rashida Tlaib (write-in) | 763 | 1.11% | |||
| Cenk Uygur | 700 | 1.02% | |||
| "Blank" (write-in) | 556 | 0.81% | |||
| Jason Palmer | 404 | 0.59% | |||
| Robert F. Kennedy Jr. (write-in) (Independent) | 322 | 0.47% | |||
| Bernie Sanders (write-in) (Independent) | 288 | 0.42% | |||
| Nikki Haley (write-in) (Republican) | 187 | 0.27% | |||
| Overvotes | 73 | 0.10% | |||
| Blank ballots | 1,525 | 2.22% | |||
| Total: | 68,599 | 100% | 16 | 8 | 24 |
| Source: [70] [71] | |||||
Virginia

- 70–80%
- 80–90%
- >90%
| Candidate | Votes | Percentage | Actual delegate count | ||
|---|---|---|---|---|---|
| Pledged | Unpledged | Total | |||
| Joe Biden (incumbent) | 317,329 | 88.5% | 99 | ||
| Marianne Williamson | 28,599 | 8.0% | |||
| Dean Phillips | 12,586 | 3.5% | |||
| Total: | 358,514 | 100.0% | 99 | 19 | 118 |
| Source: [72] | |||||
Hawaii
| Candidate | Votes | Percentage | Actual delegate count | ||
|---|---|---|---|---|---|
| Bound | Unbound | Total | |||
| Joe Biden (incumbent) | 1,032 | 66.0% | 15 | 15 | |
| Uncommitted | 455 | 29.1% | 7 | 7 | |
| Marianne Williamson | 50 | 3.2% | 0 | ||
| Dean Phillips | 15 | 1.0% | 0 | ||
| Jason Palmer | 6 | 0.4% | 0 | ||
| Armando Perez-Serrato | 5 | 0.3% | 0 | ||
| Total: | 1,563 | 100.00% | 22 | 9 | 31 |
| Source: [73] | |||||
Democrats Abroad
| Candidate | Votes | Percentage | Actual delegate count | ||
|---|---|---|---|---|---|
| Bound | Unbound | Total | |||
| Joe Biden (incumbent) | 6,907 | 80.1% | 13 | ||
| Uncommitted | 1,136 | 13.2% | |||
| Marianne Williamson | 575 | 6.7% | |||
| Total: | 8,618 | 100.00% | 13 | 8 | 21 |
| Source: [74] [75] | |||||
Georgia
| Candidate | Votes | Percentage | Actual delegate count | ||
|---|---|---|---|---|---|
| Bound | Unbound | Total | |||
| Joe Biden (incumbent) | 272,363 | 93.1% | 108 | ||
| Marianne Williamson | 8,569 | 2.9% | |||
| Dean Phillips (withdrawn) | 5,205 | 1.8% | |||
| Blank ballots | 6,429 | 2.2% | |||
| Overvotes | 2 | <0.1% | |||
| Total: | 292,568 | 100.00% | 108 | 16 | 124 |
| Source: [76] | |||||
Mississippi
| Candidate | Votes | Percentage | Actual delegate count | ||
|---|---|---|---|---|---|
| Bound | Unbound | Total | |||
| Joe Biden (incumbent) | 87,922 | 98.7% | 35 | ||
| Write-in votes | 1,187 | 1.3% | |||
| Total: | 89,109 | 100.00% | 35 | 35 | |
| Source: [77] | |||||
Northern Mariana Islands
| Candidate | Votes | Percentage | Actual delegate count | ||
|---|---|---|---|---|---|
| Bound | Unbound | Total | |||
| Joe Biden (incumbent) | 93 | 93.94% | 6 | 6 | |
| Jason Palmer | 4 | 4.04% | 0 | ||
| Marianne Williamson | 2 | 2.02% | 0 | ||
| Dean Phillips (withdrawn) | 0 | 0.00% | 0 | ||
| Total: | 99 | 100.00% | 6 | 5 | 11 |
| Source: [78] | |||||
Washington
| Candidate | Votes | Percentage | Actual delegate count | ||
|---|---|---|---|---|---|
| Pledged | Unpledged | Total | |||
| Joe Biden (incumbent) | 763,739 | 83.5% | 90 | ||
| Uncommitted delegates | 89,764 | 9.8% | 2 | ||
| Marianne Williamson | 25,308 | 2.8% | 0 | ||
| Dean Phillips (withdrawn) | 25,190 | 2.8% | 0 | ||
| Write-in votes | 10,966 | 1.2% | 0 | ||
| Total: | 914,967 | 100.0% | 92 | 19 | 111 |
| Source: [79] | |||||
Arizona
| Candidate | Votes | Percentage | Actual delegate count | ||
|---|---|---|---|---|---|
| Bound | Unbound | Total | |||
| Joe Biden (incumbent) | 375,110 | 89.3% | 72 | 72 | |
| Marianne Williamson | 15,844 | 3.8% | |||
| Dean Phillips (withdrawn) | 11,611 | 2.8% | |||
| Gabriel Cornejo (withdrawn) | 6,128 | 1.5% | |||
| Frankie Lozada (withdrawn) | 4,976 | 1.2% | |||
| Jason Palmer | 3,752 | 0.9% | |||
| Stephen Lyons (withdrawn) | 2,753 | 0.7% | |||
| Total: | 420,174 | 100.0% | 72 | 13 | 85 |
| Source: [80] | |||||
Illinois
| Candidate | Votes | Percentage | Actual delegate count | ||
|---|---|---|---|---|---|
| Bound | Unbound | Total | |||
| Joe Biden (incumbent) | 734,585 | 91.4% | 147 | ||
| Marianne Williamson | 28,596 | 3.6% | |||
| Dean Phillips (withdrawn) | 25,525 | 3.2% | |||
| Frankie Lozada (withdrawn) | 14,398 | 1.8% | |||
| Write-in | 927 | 0.1% | |||
| Total: | 804,031 | 100.00% | 147 | 27 | 174 |
| Source: [81] | |||||
Kansas
| Candidate | Votes | Percentage | Actual delegate count | ||
|---|---|---|---|---|---|
| Bound | Unbound | Total | |||
| Joe Biden (incumbent) | 35,369 | 83.8% | 33 | ||
| None of the Names Shown | 4,330 | 10.3% | |||
| Marianne Williamson | 1,453 | 3.4% | |||
| Dean Phillips (withdrawn) | 557 | 1.3% | |||
| Jason Palmer | 497 | 1.2% | |||
| Total: | 42,206 | 100.00% | 33 | 6 | 39 |
| Source: [82] | |||||
Ohio
| Candidate | Votes | Percentage | Actual delegate count | ||
|---|---|---|---|---|---|
| Bound | Unbound | Total | |||
| Joe Biden (incumbent) | 461,558 | 87.1% | 124 | ||
| Dean Phillips (withdrawn) | 68,629 | 12.9% | 3 | ||
| Total: | 530,187 | 100.0% | 127 | 16 | 133 |
| Source: [83] | |||||
Louisiana
| Candidate | Votes | Percentage | Actual delegate count | ||
|---|---|---|---|---|---|
| Pledged | Unpledged | Total | |||
| Joe Biden (incumbent) | 143,371 | 86.1% | 48 | ||
| Marianne Williamson | 7,898 | 4.7% | |||
| Dean Phillips (withdrawn) | 4,351 | 2.6% | |||
| Stephen Lyons (withdrawn) | 3,770 | 2.3% | |||
| Bob Ely | 2,652 | 1.6% | |||
| Frankie Lozada (withdrawn) | 2,244 | 1.4% | |||
| Armando Perez-Serrato | 1,200 | 0.7% | |||
| Cenk Uygur (withdrawn) | 1,113 | 0.7% | |||
| Total: | 166,599 | 100.0% | 48 | 6 | 52 |
| Source: [84] | |||||
Missouri
| Candidate | Votes | Percentage | Actual delegate count | ||
|---|---|---|---|---|---|
| Pledged | Unpledged | Total | |||
| Joe Biden (incumbent) | 16,295 | 85.3% | 61 | ||
| Uncommitted | 2,229 | 11.7% | 3 | ||
| Marianne Williamson | 298 | 1.6% | |||
| Dean Phillips (withdrawn) | 178 | 0.9% | |||
| Stephen Lyons (withdrawn) | 40 | 0.2% | |||
| Jason Palmer | 36 | 0.2% | |||
| Armando Perez-Serrato | 24 | 0.1% | |||
| Total: | 19,100 | 100.0% | 64 | 6 | 70 |
| Source: [85] | |||||
North Dakota
| Candidate | Votes | Percentage | Actual delegate count | ||
|---|---|---|---|---|---|
| Pledged | Unpledged | Total | |||
| Joe Biden (incumbent) | 840 | 92.4% | 13 | 13 | |
| Marianne Williamson | 31 | 3.4% | |||
| Dean Phillips (withdrawn) | 16 | 1.8% | |||
| Cenk Uygur (withdrawn) | 13 | 1.4% | |||
| Eban Cambridge | 4 | 0.4% | |||
| Stephen Lyons (withdrawn) | 3 | 0.3% | |||
| Jason Palmer | 2 | 0.2% | |||
| Armando Perez-Serrato | 0 | 0% | |||
| Total: | 909 | 100.0% | 13 | 4 | 17 |
| Source: [86] | |||||
Connecticut
| Candidate | Votes | Percentage | Actual delegate count | ||
|---|---|---|---|---|---|
| Pledged | Unpledged | Total | |||
| Joe Biden (incumbent) | 55,697 | 84.9% | 60 | 60 | |
| Uncommitted | 7,488 | 11.4% | |||
| Marianne Williamson | 1,497 | 2.3% | |||
| Dean Phillips (withdrawn) | 578 | 0.9% | |||
| Cenk Uygur (withdrawn) | 317 | 0.5% | |||
| Total: | 65,577 | 100.0% | 60 | 14 | 79 |
| Source: [87] | |||||
New York
| Candidate | Votes | Percentage | Actual delegate count | ||
|---|---|---|---|---|---|
| Pledged | Unpledged | Total | |||
| Joe Biden (incumbent) | 278,669 | 91.5% | 268 | 268 | |
| Marianne Williamson | 14,973 | 4.9% | |||
| Dean Phillips (withdrawn) | 10,989 | 3.6% | |||
| Total: | 302,811 | 100.0% | 268 | 38 | 306 |
| Source: [88] | |||||
Rhode Island
| Candidate | Votes | Percentage | Actual delegate count | ||
|---|---|---|---|---|---|
| Pledged | Unpledged | Total | |||
| Joe Biden (incumbent) | 21,336 | 82.6% | 25 | 25 | |
| Uncommitted | 3,834 | 14.8% | 1 | 1 | |
| Dean Phillips (withdrawn) | 660 | 2.6% | |||
| Total: | 25,830 | 100.0% | 26 | 8 | 34 |
| Source: [89] | |||||
Wisconsin
| Candidate | Votes | Percentage | Actual delegate count | ||
|---|---|---|---|---|---|
| Pledged | Unpledged | Total | |||
| Joe Biden (incumbent) | 511,845 | 88.6% | 82 | 82 | |
| Uninstructed | 48,162 | 8.3% | |||
| Dean Phillips (withdrawn) | 17,714 | 3.1% | |||
| Total: | 577,721 | 100.0% | 82 | 13 | 95 |
| Source: [90] | |||||
Wyoming
| Candidate | Votes | Percentage | Actual delegate count | ||
|---|---|---|---|---|---|
| Pledged | Unpledged | Total | |||
| Joe Biden (incumbent) | 380 | 96.0% | 13 | 13 | |
| Uncommitted | 13 | 3.3% | |||
| David Olscamp | 2 | 0.5% | |||
| Marianne Williamson | 1 | 0.3% | |||
| Jason Palmer | 0 | 0.0% | |||
| Armando Perez-Serrato | 0 | 0.0% | |||
| Dean Phillips (withdrawn) | 0 | 0.0% | |||
| Stephen Lyons (withdrawn) | 0 | 0.0% | |||
| Total: | 361 | 100.0% | 13 | 4 | 17 |
| Source: [91] | |||||
Pennsylvania
| Candidate | Votes | Percentage | Actual delegate count | ||
|---|---|---|---|---|---|
| Pledged | Unpledged | Total | |||
| Joe Biden (incumbent) | 926,633 | 88.2% | 156 | ||
| Dean Phillips (withdrawn) | 68,310 | 6.5% | |||
| Write-in votes | 55,611 | 5.3% | |||
| Total: | 1,050,554 | 100.0% | 159 | 27 | 186 |
| Source: [92] | |||||
See also
- Results of the 2024 Republican Party presidential primaries
- Results of the 2020 Democratic Party presidential primaries
Notes
- ^ a b Delegates have not been officially bound yet.
- ^ New Hampshire's delegates will not be awarded through this unofficial primary. [6]
- ^ The candidate did not appear on the ballot, but the candidate or allies ran a write-in campaign.
-
^ Includes:
- 7.1% for other write-in candidates (8,820 votes)
- 4.1% for other on-ballot candidates (5,029 votes)
- 1.2% for "ceasefire" as a write-in (1,512 votes)
-
^ Includes:
- 1.7% for other on-ballot candidates (2,250 votes)
- ^ a b c d e All for write-in candidates.
-
^ Includes:
- 1.8% for Stephen Lyons (1,442 votes)
- 1.1% for Armando Perez-Serrato (879 votes)
- 1.0% for Frankie Lozada (786 votes)
-
^ Includes:
- 1.2% for Armando Perez-Serrato (43,105 votes)
- 1.2% for Gabriel Cornejo (41,390 votes)
- 0.7% for "President" Boddie (25,455 votes)
- 0.6% for Stephen Lyons (21,062 votes)
- 0.4% for Eban Cambridge (12,758 votes)
-
^ Includes:
- 0.7% for Gabriel Cornejo (4,313 votes)
- 0.4% for Armando Perez-Serrato (2,591 votes)
- 0.4% for Frankie Lozada (2,402 votes)
- 0.3% for Stephen Lyons (1,481 votes)
-
^ Includes:
- 10.2% as blank ballots (7,359 ballots)
- 0.7% for other candidates (480 votes)
-
^ Includes:
- 1.5% for other candidates (10,217 votes)
- 1.3% as blank ballots (8,930 ballots)
-
^ Includes:
- 0.8% for write-in candidates (2,000 votes)
- 0.8% for other on-ballot candidates (1,912 votes)
-
^ Includes:
- 4.9% for Stephen Lyons (4,441 votes)
- 2.2% for Cenk Uygur (1,974 votes)
- 2.0% for Armando Perez-Serrato (1,809 votes)
-
^ Includes:
- 2.8% for Armando Perez-Serrato (27,473 votes)
- 1.8% for Gabriel Cornejo (17,196 votes)
- 1.6% for Cenk Uygur (16,100 votes)
- 1.2% for Frankie Lozada (11,131 votes)
- 0.9% for Star Locke (8,602 votes)
-
^ Includes:
- 2.2% for Gabriel Cornejo (1,503 votes)
- 1.3% for Frankie Lozada (859 votes)
-
^ Includes:
- 4.9% for write-in candidates (3,379 votes)
- 2.2% as blank ballots (1,525 ballots)
- 2.2% for other on-ballot candidates (1,479 votes)
- 0.1% as overvotes (73 ballots)
- ^ a b c All for Armando Perez-Serrato.
- ^ All as blank ballots
-
^ Includes:
- 1.5% for Gabriel Cornejo (withdrawn, 6,128 votes)
- 1.2% for Frankie Lozada (withdrawn, 4,976 votes)
- 0.7% for Stephen Lyons (withdrawn, 2,753 votes)
- ^ All for Frankie Lozada (withdrawn)
-
^ Includes:
- 2.3% for Stephen Lyons (withdrawn, 3,770 votes)
- 1.6% for Bob Ely (2,652 votes)
- 1.4% for Frankie Lozada (withdrawn, 2,244 votes)
- 0.7% for Armando Perez-Serrato (1,200 votes)
- 0.7% for Cenk Uygur (withdrawn, 1,113 votes)
-
^ Includes:
- 0.2% for Stephen Lyons (withdrawn, 40 votes)
- 0.1% for Armando Perez-Serrato (24 votes)
-
^ Includes:
- 1.4% for Cenk Uygur (withdrawn, 13 votes)
- 0.4% for Eban Cambridge (4 votes)
- 0.3% for Stephen Lyons (withdrawn, 3 votes)
- ^ All for Cenk Uygur (withdrawn)
- ^ a b Automatic write-in access
-
^ Includes:
- 0.5% for David Olscamp (2 votes)
- 0.0% Armando Perez-Serrato (0 votes)
- 0.0% for Stephen Lyons (withdrawn, 0 votes)
- ^ Write-in, reported as "scatter".
- ^ a b c d e f Candidate was not running in this primary.
- ^ Reported as "scatter".
- ^ While voting was ongoing, Williamson suspended and then unsuspended her campaign.
References
- ^ a b "2024 Democratic Pledged and Unpledged Delegate Summary". The Green Papers. Archived from the original on February 15, 2024. Retrieved January 15, 2024.
-
^ Greenwood, Max (December 5, 2023).
"'No conspiracy.' Florida Democrats explain cancellation of state presidential primary". Miami Herald.
Archived from the original on January 30, 2024. Retrieved March 7, 2024.
The Florida Democratic Party is standing by its decision to scrap its presidential primary after it submitted only President Joe Biden's name for the 2024 ballot [...] Under state law, if a political party lists only one presidential candidate, that person will be declared the automatic winner of the primary and no vote will be held. Florida is expected to award 250 delegates to the winner of the Democratic primary on March 19.
- ^ "2024 Presidential Primary Election Candidate List - Department of Elections - State of Delaware". elections.delaware.gov. Archived from the original on February 7, 2024. Retrieved February 8, 2024.
-
^
"DELEGATE SELECTION PLAN FOR THE 2024 DEMOCRATIC NATIONAL CONVENTION" (PDF). Delaware Dems.
Archived (PDF) from the original on February 3, 2024. Retrieved February 7, 2024.
Pursuant to Delaware State Law, if the Delaware Democratic Party submits the name of only one Presidential Candidate, and no other candidates file for the ballot, the state run presidential primary shall be cancelled.
-
^
"2024 Presidential Primary Election Candidate List – Department of Elections – State of Delaware". elections.delaware.gov.
Archived from the original on February 7, 2024. Retrieved February 8, 2024.
(c) In the event that only one candidate files for a party's nomination by the filing deadline set forth in subsection (a) of this section and no additional candidates are added to the ballot pursuant to subsection (b) of this section, that candidate shall be considered as having received 100% of the vote for that party's presidential primary election automatically upon the expiration of the filing deadline and thus declared the winner of that election. In the event no candidate files for the party's nomination, no election shall be held for that party's nomination.
- ^ Yoon, Robert (January 17, 2024). "This is why zero delegates are at stake when Democrats vote in New Hampshire". Associated Press. Archived from the original on January 20, 2024. Retrieved January 21, 2024.
- ^ "2024 Democratic Presidential Primary Election Results". New Hampshire Secretary of State. Archived from the original on January 25, 2024. Retrieved March 10, 2024.
- ^ "2024 Democratic Presidential Preference Primary". State of South Carolina. Archived from the original on February 22, 2024. Retrieved March 10, 2024.
- ^ "2024 Presidential Preference Primary". Nevada Secretary of State. Archived from the original on March 4, 2024. Retrieved March 10, 2024.
- ^ "2024 Michigan Election Results". Michigan Secretary of State. March 19, 2024. Archived from the original on March 7, 2024. Retrieved April 6, 2024.
- ^ "Iowa Democratic Caucus Results". The New York Times. March 17, 2024. ISSN 0362-4331. Archived from the original on March 5, 2024. Retrieved April 18, 2024.
- ^ "Certification of Results - Democratic Party (Excel file with vote totals)". Alabama Secretary of State. Retrieved March 28, 2024.
- ^ "American Samoa Presidential Caucus Election Results 2024". NBC News. March 5, 2024. Archived from the original on March 5, 2024. Retrieved March 5, 2024.
- ^ "Arkansas Democratic Primary Election Results". The New York Times. March 5, 2024. Archived from the original on March 5, 2024. Retrieved March 5, 2024.
- ^ "California Primary Election Results 2024". The New York Times. March 5, 2024. Archived from the original on March 10, 2024. Retrieved March 10, 2024.
- ^ "Colorado Democratic Primary Election Results". The New York Times. April 3, 2024. Archived from the original on March 5, 2024. Retrieved April 12, 2024.
- ^ "Tabulations for Elections held in 2024: March 5, 2024 Presidential Primary Election". Maine Secretary of State. Retrieved March 28, 2024.
- ^ "2024 President Democratic Primary". State of Massachusetts. Retrieved March 28, 2024.
- ^ "2024 PRESIDENTIAL PRIMARY RESULTS". OFFICE OF THE MINNESOTA SECRETARY OF STATE STEVE SIMON. Retrieved April 10, 2024.
- ^ "03/05/2024 OFFICIAL PRIMARY ELECTION RESULTS - STATEWIDE". North Carolina State Board of Elections. Retrieved March 28, 2024.
- ^ "Official Results". Oklahoma State Election Board. Retrieved March 28, 2024.
- ^ "Tennessee Democratic Primary Election Results". The New York Times. March 5, 2024. Archived from the original on March 5, 2024. Retrieved March 5, 2024.
- ^ "Texas Democratic Primary Election Results". The New York Times. April 10, 2024. Archived from the original on March 5, 2024. Retrieved April 12, 2024.
- ^ "Utah Democratic Primary Election Results". The New York Times. March 5, 2024. Archived from the original on March 5, 2024. Retrieved March 5, 2024.
- ^ "OFFICIAL REPORT OF THE CANVASSING COMMITTEE UNITED STATES AND VERMONT STATEWIDE OFFICES" (PDF). Vermont Secretary of State. Retrieved April 10, 2024.
- ^ "Virginia Democratic Primary Election Results". The New York Times. March 20, 2024. Archived from the original on March 5, 2024. Retrieved April 10, 2024.
- ^ "Hawaii Democratic Caucus Results". The New York Times. March 7, 2024. Archived from the original on March 6, 2024. Retrieved March 7, 2024.
- ^ "The Democrats Abroad 2024 Global Presidential Primary Results are in". Democrats Abroad. Retrieved March 19, 2024.
- ^ "2024 PRES PREF PRIMARY ELECTIO". Varun's Live Election Maps. Retrieved March 12, 2024.
- ^ Niesse, Mark; Quinton, Phoebe. "Over 6,000 Georgia Dems cast blank ballots in apparent slap at Biden on Israel". The Atlanta Journal-Constitution. ISSN 1539-7459. Retrieved April 2, 2024.
- ^ "Mississippi Presidential Primary Election Results 2024". NBC News. March 12, 2024. Retrieved March 12, 2024.
- ^ "Northern Marianas Democrat". Green Papers. Retrieved March 12, 2024.
- ^ "Presidential Primary Results". Washington Secretary of State. March 23, 2024. Retrieved March 23, 2024.
- ^ "Arizona Presidential Primary". The AP. April 8, 2024. Retrieved April 18, 2024.
- ^ "Kansas Presidential Primary". The AP. Retrieved March 18, 2024.
- ^ "Ohio Presidential Primary". The AP. Retrieved March 18, 2024.
- ^ "Louisiana Presidential Primary". The AP. Retrieved March 22, 2024.
- ^ "2024 Primary - Congressional District and County Totals". Missouri Democratic Party. Retrieved March 26, 2024.
- ^ "North Dakota Presidential Primary Election Results 2024". NBC News. Retrieved April 2, 2024.
- ^ "Connecticut Presidential Primary". The AP. Retrieved April 1, 2024.
- ^ "New York Presidential Primary". The AP. Retrieved April 1, 2024.
- ^ "Rhode Island Presidential Primary". The AP. April 16, 2024. Retrieved April 18, 2024.
- ^ "Wisconsin Presidential Primary". The AP. Retrieved April 1, 2024.
- ^ Bohrer, Becky; Gruver, Mead (April 13, 2024). "Biden wins more delegates in Wyoming and Alaska as he heads toward Democratic nomination". The AP. Retrieved April 14, 2024.
- ^ "Wyoming Presidential Caucus". The AP. Retrieved April 18, 2024.
- ^ "Pennsylvania Presidential Primary Election Results 2024". NBC News. Retrieved April 23, 2024.
- ^ Candidates for president Archived January 18, 2024, at the Wayback Machine, FEC.gov.
- ^ Marrans, Daniel. "Pro-Palestine Activists Urge New Hampshire Voters To Write In 'Cease-Fire'". HuffPost.com. HuffPost. Retrieved January 23, 2024.
- ^ "2024 Democratic Presidential Primary Election Results". NH SOS. Retrieved February 2, 2024.
- ^ "South Carolina Democratic Primary Results". New York Times. Retrieved February 3, 2024.
- ^ "Silver State 2024 Election Results - Presidential Preference Primary". Secretary of State of Nevada. Retrieved February 6, 2024.
- ^ "2024 Michigan Election Results". Michigan Secretary of State. Retrieved April 5, 2024.
- ^ "Certification of Results - Democratic Party (Excel file with vote totals)". Alabama Secretary of State. Retrieved March 28, 2024.
- ^ "Arkansas Democratic Primary Election Results". The New York Times. March 5, 2024. Retrieved March 6, 2024.
- ^ "American Samoa Democratic Delegation 2024". The Green Papers. Retrieved March 6, 2024.
- ^ "Certified List of Presidential Candidates for voter-nominated offices for the March 5, 2024, presidential primary election" (PDF). Secretary of State of California. December 28, 2023. Retrieved December 29, 2023.
- ^ "California Presidential Primary". Associated Press. March 5, 2024. Retrieved April 5, 2024.
- ^ "Colorado Presidential Primary". Associated Press. Retrieved April 5, 2024.
- ^ "Iowa Democratic Presidential Caucus Results". Des Moines Register. Retrieved March 5, 2024.
- ^ "Tabulations for Elections held in 2024: March 5, 2024 Presidential Primary Election". Maine Secretary of State. Retrieved March 28, 2024.
- ^ "2024 President Democratic Primary". State of Massachusetts. Retrieved March 28, 2024.
- ^ "2024 PRESIDENTIAL PRIMARY RESULTS". OFFICE OF THE MINNESOTA SECRETARY OF STATE STEVE SIMON. Retrieved March 28, 2024.
- ^ "03/05/2024 OFFICIAL PRIMARY ELECTION RESULTS - STATEWIDE". North Carolina State Board of Elections. Retrieved March 28, 2024.
- ^ "Official Results". Oklahoma State Election Board. Retrieved March 28, 2024.
- ^ "March 5, 2024 Democratic Presidential Preference Primary" (PDF). Tennessee Secretary of State. Retrieved March 28, 2024.
- ^ "Tennessee Democratic Primary Election Results". The New York Times. Retrieved March 5, 2024.
- ^ "Tennessee Democratic Delegation 2024". www.thegreenpapers.com. Retrieved May 5, 2023.
- ^ "Texas Democratic Primary Election Results". Texas Secretary of State. Retrieved March 28, 2024.
- ^ "Utah Democratic Primary Election Results". The New York Times. Retrieved March 5, 2024.
- ^ "OFFICIAL REPORT OF THE CANVASSING COMMITTEE UNITED STATES AND VERMONT STATEWIDE OFFICES" (PDF). Vermont Secretary of State. Retrieved March 12, 2024.
- ^ "Vermont Election Night Results". Vermont Secretary of State. Retrieved March 15, 2024.
- ^ "Virginia Democratic Primary Election Results". The New York Times. Retrieved March 5, 2024.
- ^ "Hawaii Democratic Caucus Results". The New York Times. March 7, 2024. Retrieved March 7, 2024.
- ^ "Democratic Presidential Primaries: Democrats Abroad". CNN. Retrieved March 19, 2024.
- ^ Fobbs, Angela (March 25, 2024). "Democrats Abroad Announces 2024 Global Presidential Primary Results". Democrats Abroad. Archived from the original on March 29, 2024. Retrieved March 29, 2024.
- ^ "2024 PRES PREF PRIMARY ELECTIO". Varun's Live Election Maps. Retrieved March 12, 2024.
- ^ "Mississippi Presidential Primary Election Results 2024". NBC News. Retrieved March 12, 2024.
- ^ "Northern Marianas Democrat". Green Papers. Retrieved March 11, 2024.
- ^ "March 12, 2024 Presidential Primary Results". Washington Secretary of State. March 23, 2024. Retrieved April 5, 2024.
- ^ "Arizona Presidential Primary". The AP. April 8, 2024. Retrieved April 18, 2024.
- ^ "IIllinois Presidential Election Results 2024". NBC News. Retrieved March 31, 2024.
- ^ "Kansas Presidential Primary". The AP. Retrieved March 18, 2024.
- ^ "Ohio Presidential Primary". The AP. Retrieved April 27, 2024.
- ^ "Louisiana Presidential Primary". The AP. Retrieved March 22, 2024.
- ^ "Missouri Presidential Primary". The AP. Retrieved March 22, 2024.
- ^ "North Dakota Presidential Primary". The AP. Retrieved March 29, 2024.
- ^ "Connecticut Presidential Primary". The AP. April 12, 2024. Retrieved April 18, 2024.
- ^ "New York Presidential Primary". The AP. April 15, 2024. Retrieved April 18, 2024.
- ^ "Rhode Island Presidential Primary". The AP. April 16, 2024. Retrieved April 18, 2024.
- ^ "Wisconsin Presidential Primary". The AP. Retrieved April 1, 2024.
- ^ "Wyoming Presidential Caucus". The AP. Retrieved April 18, 2024.
- ^ "Pennsylvania Presidential Primary Election Results 2024". NBC News. Retrieved April 23, 2024.
| Results of the Democratic Party presidential primaries | |
|---|---|
←
2020 |
|
2024 U.S. presidential election | |
|---|---|
|
|
| Democratic Party | |
| Republican Party | |
| Third parties | |
| Related races | |
| |
This article contains the results of the 2024 Democratic Party presidential primaries and caucuses, the processes by which the Democratic Party selects delegates to attend the 2024 Democratic National Convention. The series of primaries, caucuses, and state conventions culminate in the national convention, where the delegates cast their votes to formally select a candidate. A simple majority of the total delegate votes is required to become the nominee.
Overview of results
| |
| Winner not yet declared |
-
Initial pledged delegate allocation
|
| class="col-break col-break-2" |
-
First-place results by county
Major candidates
| Legend: | 1st place (popular vote) |
2nd place (popular vote) |
3rd place (popular vote) |
Candidate has withdrawn |
Candidate not on ballot |
|---|
| Date (daily totals) [1] |
Pledged delegates |
Contest |
Joe Biden |
Dean Phillips (withdrawn) |
Marianne Williamson |
Jason Palmer |
Uncommitted |
Other |
Ref |
|---|---|---|---|---|---|---|---|---|---|
| Cancelled | 224 | Florida | 224 delegates [a] | Primary cancelled | [2] | ||||
| 19 | Delaware | 19 delegates [a] | [3] [4] [5] | ||||||
| January 23 | 0 [b] | New Hampshire | 63.8%
[c] 79,100 votes |
19.7% 24,377 votes |
4.1% 5,016 votes |
0.1% 142 votes |
Not on ballot | 12.4%
[d] 15,361 votes |
[7] |
| February 3 | 55 | South Carolina | 96.2% 55 delegates 126,493 votes |
1.7% 2,247 votes |
2.1% 2,732 votes |
Not on ballot | [8] | ||
| February 6 | 36 | Nevada | 89.3% 36 delegates 119,758 votes |
Not on ballot | 3.1% 4,101 votes |
0.4% 530 votes |
5.6% 7,448 votes |
1.7%
[e] 2,250 votes |
[9] |
| February 27 | 117 | Michigan | 81.1% 115 delegates 625,221 votes |
2.7% 20,684 votes |
3.0% 22,865 votes |
Not on ballot | 13.2% 2 delegates 101,623 votes |
0.0% 178 votes [f] |
[10] |
| January 12 – March 5 | 40 |
Iowa (mail-in votes) |
90.4% 40 delegates 12,337 votes |
2.9% 394 votes |
2.2% 307 votes |
Not on ballot | 4.5% 614 votes |
Not on ballot | [11] |
| March 5 ( Super Tuesday) (1,380) |
52 | Alabama | 89.5% 52 delegates 168,080 votes |
4.5% 8,442 votes |
Not on ballot | 6.0% 11,283 votes |
Not on ballot | [12] | |
| 6 | American Samoa | 44.0% 3 delegates 40 votes |
0.0% 0 votes |
Not on ballot | 56.0% 3 delegates 51 votes |
Not on ballot | [13] | ||
| 31 | Arkansas | 88.5% 31 delegates 71,978 votes |
2.9% 2,346 votes |
4.8% 3,883 votes |
Not on ballot | 3.9%
[g] 3,107 votes |
[14] | ||
| 424 | California | 89.1% 424 delegates 3,207,687 votes |
2.8% 100,284 votes |
4.1% 146,356 votes |
Not on ballot | 4.1%
[h] 143,430 votes |
[15] | ||
| 72 | Colorado | 82.5% 72 delegates 477,365 votes |
3.1% 17,936 votes |
2.9% 16,761 votes |
0.7% 3,986 votes |
9.0% 52,122 votes |
1.9%
[i] 10,787 votes |
[16] | |
| 24 | Maine | 82.8% 24 delegates 60,018 votes |
6.4% 4,623 votes |
Not on ballot | 10.9%
[j] 7,839 ballots |
[17] | |||
| 92 | Massachusetts | 80.5% 91 delegates 533,096 votes |
4.5% 29,728 votes |
3.1% 20,402 votes |
Not on ballot | 9.1% 1 delegate 60,236 votes |
2.8% 19,147 votes [k] |
[18] | |
| 75 | Minnesota | 70.1% 64 delegates 171,278 votes |
7.8% 18,960 votes |
1.4% 3,459 votes |
0.3% 758 votes |
18.8% 11 delegates 45,914 votes |
1.6%
[l] 3,912 votes |
[19] | |
| 116 | North Carolina | 87.3% 113 delegates 609,680 votes |
Not on ballot | 12.7% 88,900 votes |
Not on ballot | [20] | |||
| 36 | Oklahoma | 73.0% 36 delegates 66,882 votes |
8.9% 8,182 votes |
9.1% 8,356 votes |
Not on ballot | 9.1%
[m] 8,224 votes |
[21] | ||
| 63 | Tennessee | 92.2% 63 delegates 122,835 votes |
Not on ballot | 7.8% 10,461 votes |
Not on ballot | [22] | |||
| 244 | Texas | 84.6% 244 delegates 831,247 votes |
2.7% 26,473 votes |
4.4% 43,667 votes |
Not on ballot | 8.2%
[n] 80,682 votes |
[23] | ||
| 30 | Utah | 86.9% 30 delegates 58,872 votes |
4.5% 3,024 votes |
5.2% 3,521 votes |
Not on ballot | 3.5%
[o] 2,362 votes |
[24] | ||
| 16 | Vermont | 83.0% 16 delegates 56,924 votes |
2.8% 1,942 votes |
4.2% 2,873 votes |
0.6% 404 votes |
Not on ballot | 9.4%
[p] 6,456 votes |
[25] | |
| 99 | Virginia | 88.5% 99 delegates 317,329 votes |
3.5% 12,586 votes |
8.0% 28,599 votes |
Not on ballot | [26] | |||
| March 6 | 22 | Hawaii | 66.0% 15 delegates 1,032 votes |
1.0% 15 votes |
3.2% 50 votes |
0.4% 6 votes |
29.1% 7 delegates 455 votes |
0.3%
[q] 5 votes |
[27] |
| March 12 (254) |
13 | Democrats Abroad | 80.1% 13 delegates 6,910 votes |
Not on ballot | 6.7% 576 votes |
Not on ballot | 13.2% 1,136 votes |
Not on ballot | [28] |
| 108 | Georgia | 93.1% 108 delegates 272,363 votes |
1.8% 5,205 votes |
2.9% 8,569 ballots |
Not on ballot | 2.2% 6,429 votes [r] |
[29] [30] | ||
| 35 | Mississippi | 98.7% 35 delegates 87,922 votes |
Not on ballot | 1.3% 1,187 votes [f] |
[31] | ||||
| 6 | Northern Mariana Islands | 93.9% 6 delegates 93 votes |
0.0% 0 votes |
2.0% 2 votes |
4.0% 4 votes |
Not on ballot | [32] | ||
| 92 | Washington | 83.5% 92 delegates 763,576 votes |
2.8% 25,185 votes |
2.8% 25,297 votes |
Not on ballot | 9.8% 2 delegates 89,753 votes |
0.0% 10,964 votes [f] |
[33] | |
| March 19 (379) |
72 | Arizona | 89.3% 72 delegates 375,110 votes |
2.8% 11,611 votes |
3.8% 15,844 votes |
0.9% 3,752 votes |
Not on ballot | 3.3% 13,857 votes [s] |
[34] |
| 147 |
Illinois (95% in) |
91.5% 147 delegates 720,333 votes |
3.2% 25,124 votes |
3.6% 27,991 votes |
Not on ballot | Not on ballot | 1.8% 14,144 votes [t] |
||
| 33 | Kansas | 83.8% 33 delegates 35,369 votes |
1.3% 557 votes |
3.4% 1,453 votes |
1.2% 497 votes |
10.3% 4,330 votes |
Not on ballot | [35] | |
| 127 | Ohio | 87.1% 118 delegates 456,523 votes |
12.9% 67,889 votes |
Not on ballot | [36] | ||||
| March 23 (112) |
48 | Louisiana | 86.1% 48 delegates 143,371 votes |
2.6% 4,351 votes |
4.7% 7,898 votes |
Not on ballot | 6.7% 10,979 votes [u] |
[37] | |
| 64 | Missouri | 85.3% 61 delegates 16,295 votes |
0.9% 178 votes |
1.6% 298 votes |
0.2% 36 votes |
11.7% 3 delegates 2,229 votes |
0.3% 64 votes [v] |
[38] | |
| March 30 | 13 | North Dakota | 92.4% 13 delegates 840 votes |
1.8% 16 votes |
3.4% 31 votes |
0.2% 2 votes |
Not on ballot | 2.2% 20 votes [w] |
[39] |
| April 2 (436) |
60 | Connecticut | 84.9% 60 delegates 55,697 votes |
0.9% 578 votes |
2.3% 1,497 votes |
Not on ballot | 11.4% 7,489 votes |
0.5% 317 votes [x] |
[40] |
| 268 | New York | 91.5% 268 delegates 278,669 votes |
3.6% 10,989 votes |
4.9% 14,973 votes |
Not on ballot | [41] | |||
| 26 | Rhode Island | 82.6% 25 delegates 21,336 votes |
2.6% 660 votes |
Not on ballot | 14.8% 1 delegate 3,834 votes |
TBD [y] | [42] | ||
| 82 | Wisconsin | 88.6% 82 delegates 511,845 votes |
3.1% 17,714 votes |
Not on ballot | 8.3% 48,162 votes |
Not on ballot | [43] | ||
| April 13 (28) |
15 | Alaska | Voice vote 15 delegates |
Not on ballot | Not on ballot | [44] | |||
| 13 | Wyoming | 96.0% 13 delegates 380 votes |
0.0% 0 votes |
0.3% 1 vote |
0.0% 0 votes |
3.3% 13 votes |
0.5% 2 votes [z] |
[45] | |
| Totals as of April 18 |
3,067 | See above | 86.7% 3,073 delegates 11,298,198 votes |
3.4% 446,229 votes |
3.1% 407,235 votes |
0.1% 3 delegates 10,042 votes |
4.1% 27 delegates 530,528 votes |
2.2% 280,984 votes | |
| April 23 | 159 | Pennsylvania | 87.9% 159 delegates 943,232 votes |
6.4% 69,113 votes |
Not on ballot [y] | 5.6% 60,223 votes [f] |
[46] | ||
| April 28 | 55 | Puerto Rico | TBD | TBD | TBD | Not on ballot | |||
| May 7 | 79 | Indiana | TBD | Not on ballot | TBD [f] | ||||
| May 14 (144) |
95 | Maryland | TBD | TBD | TBD | Not on ballot | TBD | Not on ballot | |
| 29 | Nebraska | TBD | TBD | Not on ballot | |||||
| 20 | West Virginia | TBD | TBD | Not on ballot | TBD | Not on ballot | TBD [q] | ||
| May 21 (119) |
53 | Kentucky | TBD | TBD | TBD | Not on ballot | TBD | Not on ballot | |
| 66 | Oregon | TBD | Not on ballot | TBD | Not on ballot | ||||
| May 23 | 23 | Idaho | Filing deadline not yet passed | ||||||
| June 4 (216) |
20 | Washington D.C. | TBD | TBD | TBD | Not on ballot | TBD | TBD [q] | |
| 20 | Montana | TBD | Not on ballot | TBD | |||||
| 126 | New Jersey | Filing deadline not yet passed | |||||||
| 34 | New Mexico | TBD | TBD | TBD | Not on ballot | TBD | Not on ballot | ||
| 16 | South Dakota | Filing deadline not yet passed | |||||||
| June 8 (13) |
6 | Guam | No filing deadline | ||||||
| 7 | U.S. Virgin Islands | No filing deadline | |||||||
| Total | 3,934 [1] | N/A | TBD | TBD | TBD | TBD | TBD | TBD | |
Other candidates
Over a thousand individuals have filed with the Federal Election Commission to run for president. [47]
Candidates on the ballot in at least three states
| Legend: | 1st place (popular vote) |
2nd place (popular vote) |
3rd place (popular vote) |
Candidate has withdrawn |
Candidate not on ballot |
|---|
| Candidates | Eban Cambridge |
Gabriel Cornejo |
Frankie Lozada |
Stephen Lyons |
Armando Perez-Serrato |
Cenk Uygur | ||
|---|---|---|---|---|---|---|---|---|
|
| ||||||||
| Jan 23 | 0 | NH | 47 | 86 | 73 | 80 | 68 | Unknown [aa] |
| Feb 6 | 36 | NV | 0 | 811 | 315 | 147 | 264 | 0 |
| Mar 5 | 31 | AR | 786 | 1,442 | 879 | |||
| 424 | CA | 12,670 | 41,183 | 20,975 | 42,814 | 0 | ||
| 86 | CO | 4,310 | 2,402 | 1,480 | 2,591 | 0 | ||
| 92 | MN | 269 | 355 | 327 | 402 | 721 | ||
| 40 | OK | 0 | 4,435 | 1,805 | 1,971 | |||
| 272 | TX | 0 | 17,137 | 11,259 | 27,381 | 16,072 | ||
| 34 | UT | 0 | 1,503 | 859 | 0 | |||
| 23 | VT | 0 | 0 | 700 | ||||
| Mar 19 | 72 | AZ | 0 | 6,064 | 4,925 | 2,709 | 0 | |
| 147 | IL | 0 | 0 | 14,144 | 0 | 0 | ||
| 33 | KS | 0 | 0 | |||||
| Mar 23 | 54 | LA | 0 | 2,244 | 3,770 | 1,200 | 1,113 | |
| 70 | MO | 0 | 40 | 24 | 0 | |||
| Mar 30 | 14 | ND | 4 | 0 | 0 | 3 | 0 | 13 |
| Apr 2 | 60 | CT | 316 | |||||
| Totals as of April 4 | 12,990 | 72,079 | 34,945 | 31,271 | 76,204 | 19,793 | ||
Candidates on the ballot in fewer than three states
| National popular vote totals for other candidates | ||||||
|---|---|---|---|---|---|---|
| Candidate | Votes | States on ballot | ||||
| Other‡ | 4,949 | Various states | ||||
| "President" R. Boddie | 136 | 25,304 | ( NH, CA) | |||
| Mark Prascak | 35 | ( NV) | ||||
| Derek Nadeau | 1,587 | ( NH) | ||||
| Vermin Supreme | 905 | ( NH) | ||||
| John Vail | 679 | ( NH) | ||||
| Donald Picard | 365 | 117 | ( NH, NV) | |||
| Paperboy Prince | 316 | ( NH) | ||||
| Paul V. LaCava | 175 | ( NH) | ||||
| Mark Stewart Greenstein | 131 | 779 | ( NH, VT) | |||
| Terrisa Bukovinac | 101 | ( NH) | ||||
| Tom Koos | 71 | ( NH) | ||||
| Star Locke | 57 | 8,326 | ( NH, TX) | |||
| Raymond Michael Moroz | 51 | ( NH) | ||||
| Richard Rist | 37 | ( NH) | ||||
| Superpayaseria Crystalroc | 128 | ( NV) | ||||
| Bob Ely | 2,652 | ( LA) | ||||
| Brent Foutz | 91 | ( NV) | ||||
| John Haywood | 225 | ( NV) | ||||
| Stephen Alan Leon | 92 | ( NV) | ||||
†Sometimes listed as "None of the Above"
‡Some states don't count some write-ins or minor candidates individually but lump them together.
Candidates with significant write-in totals
The following candidates and terms received significant numbers of tabulated votes as a write-in candidate nationwide.
| Candidate | Votes |
|---|---|
| Nikki Haley [ab] | 4,937 |
| Donald Trump [ab] | 2,143 |
| "Ceasefire" | 1,512 |
| Robert F. Kennedy, Jr. [ab] | 754 |
| Rashida Tlaib [ab] | 735 |
| "Blank" | 539 |
| Bernie Sanders [ab] | 405 |
| Cornel West [ab] | 77 |
Results by state
New Hampshire
- 50–60%
- 60–70%
- 40–50%
- 50–60%
- 60–70%
- 70–80%
- 80–90%
- >90%
- 30–40%
- 80–90%
| Candidate | Votes | Percentage | |||
|---|---|---|---|---|---|
| Joe Biden (incumbent; write-in) | 79,100 | 63.8% | |||
| Dean Phillips | 24,377 | 19.7% | |||
| Marianne Williamson | 5,016 | 4.0% | |||
| Nikki Haley (write-in) (Republican) | 4,760 | 3.8% | |||
| Donald Trump (write-in) (Republican) | 2,079 | 1.7% | |||
| Derek Nadeau | 1,616 | 1.3% | |||
| " Ceasefire" (write-in) [48] | 1,512 | 1.2% | |||
| Vermin Supreme | 912 | 0.7% | |||
| John Vail | 685 | 0.6% | |||
| Robert F. Kennedy Jr. (write-in) (Independent) | 439 | 0.4% | |||
| Donald Picard | 371 | 0.3% | |||
| Paperboy Prince | 326 | 0.3% | |||
| Paul V. LaCava | 176 | 0.1% | |||
| Jason Michael Palmer | 142 | 0.1% | |||
| President R. Boddie | 136 | 0.1% | |||
| Mark Stewart Greenstein | 133 | 0.1% | |||
| Bernie Sanders (write-in) (Independent) | 125 | 0.1% | |||
| Terrisa Bukovinac | 101 | <0.1% | |||
| Gabriel Cornejo | 86 | <0.1% | |||
| Stephen P. Lyons | 80 | <0.1% | |||
| Frankie Lozada | 73 | <0.1% | |||
| Tom Koos | 71 | <0.1% | |||
| Armando "Mando" Perez-Serrato | 68 | <0.1% | |||
| Star Locke | 59 | <0.1% | |||
| Raymond Michael Moroz | 52 | <0.1% | |||
| Eban Cambridge | 47 | <0.1% | |||
| Chris Christie (write-in) (Republican) | 41 | <0.1% | |||
| Richard Rist | 37 | <0.1% | |||
| Ron DeSantis (write-in) (Republican) | 33 | <0.1% | |||
| Vivek Ramaswamy (write-in) (Republican) | 2 | <0.1% | |||
| Other write-ins [ac] | 1,341 | 1.1% | |||
| Total: | 123,996 | 100.00% | |||
| Source: [49] | |||||
No delegates were awarded from the New Hampshire primary.
South Carolina
- >90%
| Candidate | Votes | Percentage | Actual delegate count | ||
|---|---|---|---|---|---|
| Pledged | Unpledged | Total | |||
| Joe Biden (incumbent) | 126,493 | 96.2% | 55 | TBD | 55 |
| Marianne Williamson | 2,732 | 2.1% | 0 | TBD | 0 |
| Dean Phillips | 2,247 | 1.7% | 0 | 0 | |
| Total: | 131,472 | 100% | 55 | 10 | 65 |
Nevada
- 60–70%
- 70–80%
- 80–90%
- >90%
| Candidate | Votes | Percentage | Actual delegate count | ||
|---|---|---|---|---|---|
| Pledged | Unpledged | Total | |||
| Joe Biden (incumbent) | 119,758 | 89.3% | 36 | 36 | |
| None of These Candidates | 7,448 | 5.6% | |||
| Marianne Williamson | 4,101 | 3.1% | |||
| Gabriel Cornejo | 811 | 0.6% | |||
| Jason Palmer | 530 | 0.4% | |||
| Frankie Lozada | 315 | 0.2% | |||
| Armando Perez-Serrato | 264 | 0.2% | |||
| John Haywood | 241 | 0.2% | |||
| Stephen Lyons | 147 | 0.1% | |||
| Superpayaseria Crystalroc | 133 | 0.1% | |||
| Donald Picard | 124 | 0.1% | |||
| Brent Foutz | 93 | 0.1% | |||
| Stephen Alan Leon | 89 | 0.1% | |||
| Mark R. Prascak | 33 | <0.1% | |||
| Total: | 134,087 | 100% | 36 | 13 | 49 |
| Source: [51] | |||||
Michigan
- 70–80%
- 80–90%
- 70–80%
- 80–90%
| Candidate | Votes | Percentage | Actual delegate count | ||
|---|---|---|---|---|---|
| Pledged | Unpledged | Total | |||
| Joe Biden (incumbent) | 625,221 | 81.1% | 115 | 115 | |
| Uncommitted | 101,623 | 13.2% | 2 | 2 | |
| Marianne Williamson (withdrawn) | 22,865 | 3.0% | |||
| Dean Phillips | 20,684 | 2.7% | |||
| Write-in votes | 178 | <0.1% | |||
| Total: | 770,571 | 100% | 117 | 23 | 140 |
| Source: [52] | |||||
Alabama
- 60–70%
- 70–80%
- 80–90%
- >90%
| Candidate | Votes | Percentage | Actual delegate count | ||
|---|---|---|---|---|---|
| Bound | Unbound | Total | |||
| Joe Biden (incumbent) | 168,080 | 89.5% | 52 | ||
| Uncommitted | 11,283 | 6.0% | |||
| Dean Phillips | 8,442 | 4.5% | |||
| Total: | 187,805 | 100.00% | 50 | 50 | |
| Source: [53] | |||||
Arkansas
- 70–80%
- 80–90%
- >90%
| Candidate | Votes | Percentage | Actual delegate count | ||
|---|---|---|---|---|---|
| Bound | Unbound | Total | |||
| Joe Biden (incumbent) | 71,978 | 88.5% | 31 | ||
| Marianne Williamson | 3,883 | 4.8% | |||
| Dean Phillips | 2,346 | 2.9% | |||
| Stephen Lyons | 1,442 | 1.8% | |||
| Armando Perez-Serrato | 879 | 1.1% | |||
| Frankie Lozada | 786 | 1.0% | |||
| Total: | 81,314 | 100.00% | 37 | 37 | |
| Source: [54] | |||||
American Samoa
| Candidate | Votes | Percentage | Actual delegate count | ||
|---|---|---|---|---|---|
| Bound | Unbound | Total | |||
| Jason Palmer | 51 | 56.0% | 3 | ||
| Joe Biden (incumbent) | 40 | 44.0% | 3 | ||
| Dean Phillips | 0 | 0.0% | |||
| Total: | 91 | 100.00% | 6 | 6 | |
| Source: [55] | |||||
California
- 80–90%
- >90%
- 70–80%
- 80–90%
- >90%
| Candidate | Votes | Percentage | Actual delegate count | ||
|---|---|---|---|---|---|
| Bound | Unbound | Total | |||
| Joe Biden (incumbent) | 3,207,687 | 89.1% | 424 | 424 | |
| Marianne Williamson | 146,356 | 4.1% | |||
| Dean Phillips | 100,284 | 2.8% | |||
| Armando Perez-Serrato | 43,105 | 1.2% | |||
| Gabriel Cornejo | 41,390 | 1.2% | |||
| "President" R. Boddie | 25,455 | 0.7% | |||
| Stephen P. Lyons | 21,062 | 0.6% | |||
| Eban Cambridge | 12,758 | 0.3% | |||
| Total (including write-ins): | 3,598,126 | 100.00% | 424 | 73 | 497 |
| Source: [56] [57] | |||||
Colorado
- 50–60%
- 60–70%
- 70–80%
- 80–90%
- >90%
| Candidate | Votes | Percentage | Actual delegate count | ||
|---|---|---|---|---|---|
| Pledged | Unpledged | Total | |||
| Joe Biden (incumbent) | 477,365 | 82.5% | 72 | 72 | |
| Noncommitted Delegate | 52,122 | 9.0% | |||
| Dean Phillips | 17,936 | 3.1% | |||
| Marianne Williamson | 16,761 | 2.9% | |||
| Gabriel Cornejo | 4,313 | 0.7% | |||
| Jason Palmer | 3,986 | 0.7% | |||
| Armando Perez-Serrato | 2,591 | 0.5% | |||
| Frankie Lozada | 2,402 | 0.4% | |||
| Stephen Lyons | 1,481 | 0.3% | |||
| Total: | 578,957 | 100% | 72 | 72 | |
| Source: [58] | |||||
Iowa
- 60–70%
- 70–80%
- 80–90%
- >90%
| Candidate | Votes | Percentage | Actual delegate count | ||
|---|---|---|---|---|---|
| Pledged | Unpledged | Total | |||
| Joe Biden (incumbent) | 12,337 | 90.4% | 40 | ||
| Uncommitted | 614 | 4.5% | |||
| Dean Phillips | 394 | 2.9% | |||
| Marianne Williamson [ad] | 307 | 2.2% | |||
| Total: | 13,652 | 100.0% | 40 | 46 | |
| Source: [59] | |||||
Maine
- 80–90%
- >90%
| Candidate | Votes | Percentage | Actual delegate count | ||
|---|---|---|---|---|---|
| Pledged | Unpledged | Total | |||
| Joe Biden (incumbent) | 60,018 | 82.8% | 24 | ||
| Dean Phillips | 4,623 | 6.4% | |||
| Other candidates | 480 | 0.7% | |||
| Blank ballots | 7,359 | 10.2% | |||
| Total: | 72,480 | 100% | 24 | 8 | 32 |
| Source: [60] | |||||
Massachusetts
- 70–80%
- 80–90%
| Candidate | Votes | Percentage | Actual delegate count | ||
|---|---|---|---|---|---|
| Pledged | Unpledged | Total | |||
| Joe Biden (incumbent) | 533,096 | 80.5% | 91 | ||
| No Preference | 60,236 | 9.1% | 1 | ||
| Dean Phillips | 29,728 | 4.5% | |||
| Marianne Williamson | 20,402 | 3.1% | |||
| Other candidates | 10,135 | 1.5% | |||
| Cenk Uygur (write-in) | 82 | <0.1% | |||
| Blank ballots | 8,930 | 1.3% | |||
| Total: | 662,609 | 100% | 92 | 92 | |
| Source: [61] | |||||
Minnesota
- 50–60%
- 60–70%
- 70–80%
- 80–90%
- 50–60%
- 60–70%
- 70–80%
| Candidate | Votes | Percentage | Actual delegate count | ||
|---|---|---|---|---|---|
| Pledged | Unpledged | Total | |||
| Joe Biden (incumbent) | 171,278 | 70.1% | 64 | ||
| Uncommitted | 45,914 | 18.8% | 11 | ||
| Dean Phillips | 18,960 | 7.8% | |||
| Marianne Williamson | 3,459 | 1.4% | |||
| Write-in votes | 2,000 | 0.8% | |||
| Jason Palmer | 758 | 0.3% | |||
| Cenk Uygur | 692 | 0.3% | |||
| Armando Perez-Serrato | 372 | 0.2% | |||
| Gabriel Cornejo | 323 | 0.1% | |||
| Frankie Lozada | 290 | 0.1% | |||
| Eban Cambridge | 235 | 0.1% | |||
| Total: | 242,594 | 100% | 75 | 17 | 92 |
| Source: [62] | |||||
North Carolina
- 60–70%
- 70–80%
- 80–90%
- >90%
| Candidate | Votes | Percentage | Actual delegate count | ||
|---|---|---|---|---|---|
| Pledged | Unpledged | Total | |||
| Joe Biden (incumbent) | 609,680 | 87.3% | 113 | ||
| No Preference | 88,900 | 12.7% | |||
| Total: | 698,580 | 100.0% | 132 | 132 | |
| Source: [63] | |||||
Oklahoma
- 30–40%
- 40–50%
- 50–60%
- 60–70%
- 70–80%
- 80–90%
- 40–50%
| Candidate | Votes | Percentage | Actual delegate count | ||
|---|---|---|---|---|---|
| Pledged | Unpledged | Total | |||
| Joe Biden (incumbent) | 66,882 | 72.98% | 36 | 36 | |
| Marianne Williamson | 8,356 | 9.12% | |||
| Dean Phillips | 8,182 | 8.93% | |||
| Stephen Lyons | 4,441 | 4.85% | |||
| Cenk Uygur | 1,974 | 2.15% | |||
| Armando Perez-Serrato | 1,809 | 1.97% | |||
| Total: | 91,644 | 100.00% | 40 | 40 | |
| Source: [64] | |||||
Tennessee
- 80–90%
- >90%
| Candidate | Votes | Percentage | Actual delegate count | ||
|---|---|---|---|---|---|
| Pledged | Unpledged | Total | |||
| Joe Biden (incumbent) | 122,803 | 92.14% | 63 | 63 | |
| Uncommitted | 10,475 | 7.86% | |||
| Total: | 133,278 | 100.00% | 63 | 7 | 70 |
| Source: [65] [66] [67] | |||||
Texas
- 40–50%
- 50–60%
- 60–70%
- 70–80%
- 80–90%
- >90%
- 100%
| Candidate | Votes | Percentage | Actual delegate count | ||
|---|---|---|---|---|---|
| Pledged | Unpledged | Total | |||
| Joe Biden (incumbent) | 831,247 | 84.6% | 244 | 244 | |
| Marianne Williamson | 43,667 | 4.5% | |||
| Armando Perez-Serrato | 27,473 | 2.8% | |||
| Dean Phillips | 26,473 | 2.7% | |||
| Gabriel Cornejo | 17,196 | 1.8% | |||
| Cenk Uygur | 16,100 | 1.6% | |||
| Frankie Lozada | 11,311 | 1.2% | |||
| Star Locke | 8,602 | 0.9% | |||
| Total: | 982,069 | 100% | 272 | 272 | |
| Source: [68] | |||||
Utah
| Candidate | Votes | Percentage | Actual delegate count | ||
|---|---|---|---|---|---|
| Pledged | Unpledged | Total | |||
| Joe Biden (incumbent) | 58,872 | 86.9% | 30 | ||
| Marianne Williamson | 3,521 | 5.2% | |||
| Dean Phillips | 3,024 | 4.5% | |||
| Gabriel Cornejo | 1,503 | 2.2% | |||
| Frankie Lozada | 859 | 1.3% | |||
| Total: | 67,779 | 100% | 34 | 34 | |
| Source: [69] | |||||
Vermont
- 80–90%
- >90%
| Candidate | Votes | Percentage | Actual delegate count | ||
|---|---|---|---|---|---|
| Pledged | Unpledged | Total | |||
| Joe Biden (incumbent) | 56,924 | 82.98% | 16 | ||
| Marianne Williamson | 2,873 | 4.19% | |||
| Dean Phillips | 1,942 | 2.83% | |||
| Other write-ins | 1,260 | 1.84% | |||
| Mark Greenstein | 779 | 1.14% | |||
| Rashida Tlaib (write-in) | 763 | 1.11% | |||
| Cenk Uygur | 700 | 1.02% | |||
| "Blank" (write-in) | 556 | 0.81% | |||
| Jason Palmer | 404 | 0.59% | |||
| Robert F. Kennedy Jr. (write-in) (Independent) | 322 | 0.47% | |||
| Bernie Sanders (write-in) (Independent) | 288 | 0.42% | |||
| Nikki Haley (write-in) (Republican) | 187 | 0.27% | |||
| Overvotes | 73 | 0.10% | |||
| Blank ballots | 1,525 | 2.22% | |||
| Total: | 68,599 | 100% | 16 | 8 | 24 |
| Source: [70] [71] | |||||
Virginia
- 70–80%
- 80–90%
- >90%
| Candidate | Votes | Percentage | Actual delegate count | ||
|---|---|---|---|---|---|
| Pledged | Unpledged | Total | |||
| Joe Biden (incumbent) | 317,329 | 88.5% | 99 | ||
| Marianne Williamson | 28,599 | 8.0% | |||
| Dean Phillips | 12,586 | 3.5% | |||
| Total: | 358,514 | 100.0% | 99 | 19 | 118 |
| Source: [72] | |||||
Hawaii
| Candidate | Votes | Percentage | Actual delegate count | ||
|---|---|---|---|---|---|
| Bound | Unbound | Total | |||
| Joe Biden (incumbent) | 1,032 | 66.0% | 15 | 15 | |
| Uncommitted | 455 | 29.1% | 7 | 7 | |
| Marianne Williamson | 50 | 3.2% | 0 | ||
| Dean Phillips | 15 | 1.0% | 0 | ||
| Jason Palmer | 6 | 0.4% | 0 | ||
| Armando Perez-Serrato | 5 | 0.3% | 0 | ||
| Total: | 1,563 | 100.00% | 22 | 9 | 31 |
| Source: [73] | |||||
Democrats Abroad
| Candidate | Votes | Percentage | Actual delegate count | ||
|---|---|---|---|---|---|
| Bound | Unbound | Total | |||
| Joe Biden (incumbent) | 6,907 | 80.1% | 13 | ||
| Uncommitted | 1,136 | 13.2% | |||
| Marianne Williamson | 575 | 6.7% | |||
| Total: | 8,618 | 100.00% | 13 | 8 | 21 |
| Source: [74] [75] | |||||
Georgia
| Candidate | Votes | Percentage | Actual delegate count | ||
|---|---|---|---|---|---|
| Bound | Unbound | Total | |||
| Joe Biden (incumbent) | 272,363 | 93.1% | 108 | ||
| Marianne Williamson | 8,569 | 2.9% | |||
| Dean Phillips (withdrawn) | 5,205 | 1.8% | |||
| Blank ballots | 6,429 | 2.2% | |||
| Overvotes | 2 | <0.1% | |||
| Total: | 292,568 | 100.00% | 108 | 16 | 124 |
| Source: [76] | |||||
Mississippi
| Candidate | Votes | Percentage | Actual delegate count | ||
|---|---|---|---|---|---|
| Bound | Unbound | Total | |||
| Joe Biden (incumbent) | 87,922 | 98.7% | 35 | ||
| Write-in votes | 1,187 | 1.3% | |||
| Total: | 89,109 | 100.00% | 35 | 35 | |
| Source: [77] | |||||
Northern Mariana Islands
| Candidate | Votes | Percentage | Actual delegate count | ||
|---|---|---|---|---|---|
| Bound | Unbound | Total | |||
| Joe Biden (incumbent) | 93 | 93.94% | 6 | 6 | |
| Jason Palmer | 4 | 4.04% | 0 | ||
| Marianne Williamson | 2 | 2.02% | 0 | ||
| Dean Phillips (withdrawn) | 0 | 0.00% | 0 | ||
| Total: | 99 | 100.00% | 6 | 5 | 11 |
| Source: [78] | |||||
Washington
| Candidate | Votes | Percentage | Actual delegate count | ||
|---|---|---|---|---|---|
| Pledged | Unpledged | Total | |||
| Joe Biden (incumbent) | 763,739 | 83.5% | 90 | ||
| Uncommitted delegates | 89,764 | 9.8% | 2 | ||
| Marianne Williamson | 25,308 | 2.8% | 0 | ||
| Dean Phillips (withdrawn) | 25,190 | 2.8% | 0 | ||
| Write-in votes | 10,966 | 1.2% | 0 | ||
| Total: | 914,967 | 100.0% | 92 | 19 | 111 |
| Source: [79] | |||||
Arizona
| Candidate | Votes | Percentage | Actual delegate count | ||
|---|---|---|---|---|---|
| Bound | Unbound | Total | |||
| Joe Biden (incumbent) | 375,110 | 89.3% | 72 | 72 | |
| Marianne Williamson | 15,844 | 3.8% | |||
| Dean Phillips (withdrawn) | 11,611 | 2.8% | |||
| Gabriel Cornejo (withdrawn) | 6,128 | 1.5% | |||
| Frankie Lozada (withdrawn) | 4,976 | 1.2% | |||
| Jason Palmer | 3,752 | 0.9% | |||
| Stephen Lyons (withdrawn) | 2,753 | 0.7% | |||
| Total: | 420,174 | 100.0% | 72 | 13 | 85 |
| Source: [80] | |||||
Illinois
| Candidate | Votes | Percentage | Actual delegate count | ||
|---|---|---|---|---|---|
| Bound | Unbound | Total | |||
| Joe Biden (incumbent) | 734,585 | 91.4% | 147 | ||
| Marianne Williamson | 28,596 | 3.6% | |||
| Dean Phillips (withdrawn) | 25,525 | 3.2% | |||
| Frankie Lozada (withdrawn) | 14,398 | 1.8% | |||
| Write-in | 927 | 0.1% | |||
| Total: | 804,031 | 100.00% | 147 | 27 | 174 |
| Source: [81] | |||||
Kansas
| Candidate | Votes | Percentage | Actual delegate count | ||
|---|---|---|---|---|---|
| Bound | Unbound | Total | |||
| Joe Biden (incumbent) | 35,369 | 83.8% | 33 | ||
| None of the Names Shown | 4,330 | 10.3% | |||
| Marianne Williamson | 1,453 | 3.4% | |||
| Dean Phillips (withdrawn) | 557 | 1.3% | |||
| Jason Palmer | 497 | 1.2% | |||
| Total: | 42,206 | 100.00% | 33 | 6 | 39 |
| Source: [82] | |||||
Ohio
| Candidate | Votes | Percentage | Actual delegate count | ||
|---|---|---|---|---|---|
| Bound | Unbound | Total | |||
| Joe Biden (incumbent) | 461,558 | 87.1% | 124 | ||
| Dean Phillips (withdrawn) | 68,629 | 12.9% | 3 | ||
| Total: | 530,187 | 100.0% | 127 | 16 | 133 |
| Source: [83] | |||||
Louisiana
| Candidate | Votes | Percentage | Actual delegate count | ||
|---|---|---|---|---|---|
| Pledged | Unpledged | Total | |||
| Joe Biden (incumbent) | 143,371 | 86.1% | 48 | ||
| Marianne Williamson | 7,898 | 4.7% | |||
| Dean Phillips (withdrawn) | 4,351 | 2.6% | |||
| Stephen Lyons (withdrawn) | 3,770 | 2.3% | |||
| Bob Ely | 2,652 | 1.6% | |||
| Frankie Lozada (withdrawn) | 2,244 | 1.4% | |||
| Armando Perez-Serrato | 1,200 | 0.7% | |||
| Cenk Uygur (withdrawn) | 1,113 | 0.7% | |||
| Total: | 166,599 | 100.0% | 48 | 6 | 52 |
| Source: [84] | |||||
Missouri
| Candidate | Votes | Percentage | Actual delegate count | ||
|---|---|---|---|---|---|
| Pledged | Unpledged | Total | |||
| Joe Biden (incumbent) | 16,295 | 85.3% | 61 | ||
| Uncommitted | 2,229 | 11.7% | 3 | ||
| Marianne Williamson | 298 | 1.6% | |||
| Dean Phillips (withdrawn) | 178 | 0.9% | |||
| Stephen Lyons (withdrawn) | 40 | 0.2% | |||
| Jason Palmer | 36 | 0.2% | |||
| Armando Perez-Serrato | 24 | 0.1% | |||
| Total: | 19,100 | 100.0% | 64 | 6 | 70 |
| Source: [85] | |||||
North Dakota
| Candidate | Votes | Percentage | Actual delegate count | ||
|---|---|---|---|---|---|
| Pledged | Unpledged | Total | |||
| Joe Biden (incumbent) | 840 | 92.4% | 13 | 13 | |
| Marianne Williamson | 31 | 3.4% | |||
| Dean Phillips (withdrawn) | 16 | 1.8% | |||
| Cenk Uygur (withdrawn) | 13 | 1.4% | |||
| Eban Cambridge | 4 | 0.4% | |||
| Stephen Lyons (withdrawn) | 3 | 0.3% | |||
| Jason Palmer | 2 | 0.2% | |||
| Armando Perez-Serrato | 0 | 0% | |||
| Total: | 909 | 100.0% | 13 | 4 | 17 |
| Source: [86] | |||||
Connecticut
| Candidate | Votes | Percentage | Actual delegate count | ||
|---|---|---|---|---|---|
| Pledged | Unpledged | Total | |||
| Joe Biden (incumbent) | 55,697 | 84.9% | 60 | 60 | |
| Uncommitted | 7,488 | 11.4% | |||
| Marianne Williamson | 1,497 | 2.3% | |||
| Dean Phillips (withdrawn) | 578 | 0.9% | |||
| Cenk Uygur (withdrawn) | 317 | 0.5% | |||
| Total: | 65,577 | 100.0% | 60 | 14 | 79 |
| Source: [87] | |||||
New York
| Candidate | Votes | Percentage | Actual delegate count | ||
|---|---|---|---|---|---|
| Pledged | Unpledged | Total | |||
| Joe Biden (incumbent) | 278,669 | 91.5% | 268 | 268 | |
| Marianne Williamson | 14,973 | 4.9% | |||
| Dean Phillips (withdrawn) | 10,989 | 3.6% | |||
| Total: | 302,811 | 100.0% | 268 | 38 | 306 |
| Source: [88] | |||||
Rhode Island
| Candidate | Votes | Percentage | Actual delegate count | ||
|---|---|---|---|---|---|
| Pledged | Unpledged | Total | |||
| Joe Biden (incumbent) | 21,336 | 82.6% | 25 | 25 | |
| Uncommitted | 3,834 | 14.8% | 1 | 1 | |
| Dean Phillips (withdrawn) | 660 | 2.6% | |||
| Total: | 25,830 | 100.0% | 26 | 8 | 34 |
| Source: [89] | |||||
Wisconsin
| Candidate | Votes | Percentage | Actual delegate count | ||
|---|---|---|---|---|---|
| Pledged | Unpledged | Total | |||
| Joe Biden (incumbent) | 511,845 | 88.6% | 82 | 82 | |
| Uninstructed | 48,162 | 8.3% | |||
| Dean Phillips (withdrawn) | 17,714 | 3.1% | |||
| Total: | 577,721 | 100.0% | 82 | 13 | 95 |
| Source: [90] | |||||
Wyoming
| Candidate | Votes | Percentage | Actual delegate count | ||
|---|---|---|---|---|---|
| Pledged | Unpledged | Total | |||
| Joe Biden (incumbent) | 380 | 96.0% | 13 | 13 | |
| Uncommitted | 13 | 3.3% | |||
| David Olscamp | 2 | 0.5% | |||
| Marianne Williamson | 1 | 0.3% | |||
| Jason Palmer | 0 | 0.0% | |||
| Armando Perez-Serrato | 0 | 0.0% | |||
| Dean Phillips (withdrawn) | 0 | 0.0% | |||
| Stephen Lyons (withdrawn) | 0 | 0.0% | |||
| Total: | 361 | 100.0% | 13 | 4 | 17 |
| Source: [91] | |||||
Pennsylvania
| Candidate | Votes | Percentage | Actual delegate count | ||
|---|---|---|---|---|---|
| Pledged | Unpledged | Total | |||
| Joe Biden (incumbent) | 926,633 | 88.2% | 156 | ||
| Dean Phillips (withdrawn) | 68,310 | 6.5% | |||
| Write-in votes | 55,611 | 5.3% | |||
| Total: | 1,050,554 | 100.0% | 159 | 27 | 186 |
| Source: [92] | |||||
See also
- Results of the 2024 Republican Party presidential primaries
- Results of the 2020 Democratic Party presidential primaries
Notes
- ^ a b Delegates have not been officially bound yet.
- ^ New Hampshire's delegates will not be awarded through this unofficial primary. [6]
- ^ The candidate did not appear on the ballot, but the candidate or allies ran a write-in campaign.
-
^ Includes:
- 7.1% for other write-in candidates (8,820 votes)
- 4.1% for other on-ballot candidates (5,029 votes)
- 1.2% for "ceasefire" as a write-in (1,512 votes)
-
^ Includes:
- 1.7% for other on-ballot candidates (2,250 votes)
- ^ a b c d e All for write-in candidates.
-
^ Includes:
- 1.8% for Stephen Lyons (1,442 votes)
- 1.1% for Armando Perez-Serrato (879 votes)
- 1.0% for Frankie Lozada (786 votes)
-
^ Includes:
- 1.2% for Armando Perez-Serrato (43,105 votes)
- 1.2% for Gabriel Cornejo (41,390 votes)
- 0.7% for "President" Boddie (25,455 votes)
- 0.6% for Stephen Lyons (21,062 votes)
- 0.4% for Eban Cambridge (12,758 votes)
-
^ Includes:
- 0.7% for Gabriel Cornejo (4,313 votes)
- 0.4% for Armando Perez-Serrato (2,591 votes)
- 0.4% for Frankie Lozada (2,402 votes)
- 0.3% for Stephen Lyons (1,481 votes)
-
^ Includes:
- 10.2% as blank ballots (7,359 ballots)
- 0.7% for other candidates (480 votes)
-
^ Includes:
- 1.5% for other candidates (10,217 votes)
- 1.3% as blank ballots (8,930 ballots)
-
^ Includes:
- 0.8% for write-in candidates (2,000 votes)
- 0.8% for other on-ballot candidates (1,912 votes)
-
^ Includes:
- 4.9% for Stephen Lyons (4,441 votes)
- 2.2% for Cenk Uygur (1,974 votes)
- 2.0% for Armando Perez-Serrato (1,809 votes)
-
^ Includes:
- 2.8% for Armando Perez-Serrato (27,473 votes)
- 1.8% for Gabriel Cornejo (17,196 votes)
- 1.6% for Cenk Uygur (16,100 votes)
- 1.2% for Frankie Lozada (11,131 votes)
- 0.9% for Star Locke (8,602 votes)
-
^ Includes:
- 2.2% for Gabriel Cornejo (1,503 votes)
- 1.3% for Frankie Lozada (859 votes)
-
^ Includes:
- 4.9% for write-in candidates (3,379 votes)
- 2.2% as blank ballots (1,525 ballots)
- 2.2% for other on-ballot candidates (1,479 votes)
- 0.1% as overvotes (73 ballots)
- ^ a b c All for Armando Perez-Serrato.
- ^ All as blank ballots
-
^ Includes:
- 1.5% for Gabriel Cornejo (withdrawn, 6,128 votes)
- 1.2% for Frankie Lozada (withdrawn, 4,976 votes)
- 0.7% for Stephen Lyons (withdrawn, 2,753 votes)
- ^ All for Frankie Lozada (withdrawn)
-
^ Includes:
- 2.3% for Stephen Lyons (withdrawn, 3,770 votes)
- 1.6% for Bob Ely (2,652 votes)
- 1.4% for Frankie Lozada (withdrawn, 2,244 votes)
- 0.7% for Armando Perez-Serrato (1,200 votes)
- 0.7% for Cenk Uygur (withdrawn, 1,113 votes)
-
^ Includes:
- 0.2% for Stephen Lyons (withdrawn, 40 votes)
- 0.1% for Armando Perez-Serrato (24 votes)
-
^ Includes:
- 1.4% for Cenk Uygur (withdrawn, 13 votes)
- 0.4% for Eban Cambridge (4 votes)
- 0.3% for Stephen Lyons (withdrawn, 3 votes)
- ^ All for Cenk Uygur (withdrawn)
- ^ a b Automatic write-in access
-
^ Includes:
- 0.5% for David Olscamp (2 votes)
- 0.0% Armando Perez-Serrato (0 votes)
- 0.0% for Stephen Lyons (withdrawn, 0 votes)
- ^ Write-in, reported as "scatter".
- ^ a b c d e f Candidate was not running in this primary.
- ^ Reported as "scatter".
- ^ While voting was ongoing, Williamson suspended and then unsuspended her campaign.
References
- ^ a b "2024 Democratic Pledged and Unpledged Delegate Summary". The Green Papers. Archived from the original on February 15, 2024. Retrieved January 15, 2024.
-
^ Greenwood, Max (December 5, 2023).
"'No conspiracy.' Florida Democrats explain cancellation of state presidential primary". Miami Herald.
Archived from the original on January 30, 2024. Retrieved March 7, 2024.
The Florida Democratic Party is standing by its decision to scrap its presidential primary after it submitted only President Joe Biden's name for the 2024 ballot [...] Under state law, if a political party lists only one presidential candidate, that person will be declared the automatic winner of the primary and no vote will be held. Florida is expected to award 250 delegates to the winner of the Democratic primary on March 19.
- ^ "2024 Presidential Primary Election Candidate List - Department of Elections - State of Delaware". elections.delaware.gov. Archived from the original on February 7, 2024. Retrieved February 8, 2024.
-
^
"DELEGATE SELECTION PLAN FOR THE 2024 DEMOCRATIC NATIONAL CONVENTION" (PDF). Delaware Dems.
Archived (PDF) from the original on February 3, 2024. Retrieved February 7, 2024.
Pursuant to Delaware State Law, if the Delaware Democratic Party submits the name of only one Presidential Candidate, and no other candidates file for the ballot, the state run presidential primary shall be cancelled.
-
^
"2024 Presidential Primary Election Candidate List – Department of Elections – State of Delaware". elections.delaware.gov.
Archived from the original on February 7, 2024. Retrieved February 8, 2024.
(c) In the event that only one candidate files for a party's nomination by the filing deadline set forth in subsection (a) of this section and no additional candidates are added to the ballot pursuant to subsection (b) of this section, that candidate shall be considered as having received 100% of the vote for that party's presidential primary election automatically upon the expiration of the filing deadline and thus declared the winner of that election. In the event no candidate files for the party's nomination, no election shall be held for that party's nomination.
- ^ Yoon, Robert (January 17, 2024). "This is why zero delegates are at stake when Democrats vote in New Hampshire". Associated Press. Archived from the original on January 20, 2024. Retrieved January 21, 2024.
- ^ "2024 Democratic Presidential Primary Election Results". New Hampshire Secretary of State. Archived from the original on January 25, 2024. Retrieved March 10, 2024.
- ^ "2024 Democratic Presidential Preference Primary". State of South Carolina. Archived from the original on February 22, 2024. Retrieved March 10, 2024.
- ^ "2024 Presidential Preference Primary". Nevada Secretary of State. Archived from the original on March 4, 2024. Retrieved March 10, 2024.
- ^ "2024 Michigan Election Results". Michigan Secretary of State. March 19, 2024. Archived from the original on March 7, 2024. Retrieved April 6, 2024.
- ^ "Iowa Democratic Caucus Results". The New York Times. March 17, 2024. ISSN 0362-4331. Archived from the original on March 5, 2024. Retrieved April 18, 2024.
- ^ "Certification of Results - Democratic Party (Excel file with vote totals)". Alabama Secretary of State. Retrieved March 28, 2024.
- ^ "American Samoa Presidential Caucus Election Results 2024". NBC News. March 5, 2024. Archived from the original on March 5, 2024. Retrieved March 5, 2024.
- ^ "Arkansas Democratic Primary Election Results". The New York Times. March 5, 2024. Archived from the original on March 5, 2024. Retrieved March 5, 2024.
- ^ "California Primary Election Results 2024". The New York Times. March 5, 2024. Archived from the original on March 10, 2024. Retrieved March 10, 2024.
- ^ "Colorado Democratic Primary Election Results". The New York Times. April 3, 2024. Archived from the original on March 5, 2024. Retrieved April 12, 2024.
- ^ "Tabulations for Elections held in 2024: March 5, 2024 Presidential Primary Election". Maine Secretary of State. Retrieved March 28, 2024.
- ^ "2024 President Democratic Primary". State of Massachusetts. Retrieved March 28, 2024.
- ^ "2024 PRESIDENTIAL PRIMARY RESULTS". OFFICE OF THE MINNESOTA SECRETARY OF STATE STEVE SIMON. Retrieved April 10, 2024.
- ^ "03/05/2024 OFFICIAL PRIMARY ELECTION RESULTS - STATEWIDE". North Carolina State Board of Elections. Retrieved March 28, 2024.
- ^ "Official Results". Oklahoma State Election Board. Retrieved March 28, 2024.
- ^ "Tennessee Democratic Primary Election Results". The New York Times. March 5, 2024. Archived from the original on March 5, 2024. Retrieved March 5, 2024.
- ^ "Texas Democratic Primary Election Results". The New York Times. April 10, 2024. Archived from the original on March 5, 2024. Retrieved April 12, 2024.
- ^ "Utah Democratic Primary Election Results". The New York Times. March 5, 2024. Archived from the original on March 5, 2024. Retrieved March 5, 2024.
- ^ "OFFICIAL REPORT OF THE CANVASSING COMMITTEE UNITED STATES AND VERMONT STATEWIDE OFFICES" (PDF). Vermont Secretary of State. Retrieved April 10, 2024.
- ^ "Virginia Democratic Primary Election Results". The New York Times. March 20, 2024. Archived from the original on March 5, 2024. Retrieved April 10, 2024.
- ^ "Hawaii Democratic Caucus Results". The New York Times. March 7, 2024. Archived from the original on March 6, 2024. Retrieved March 7, 2024.
- ^ "The Democrats Abroad 2024 Global Presidential Primary Results are in". Democrats Abroad. Retrieved March 19, 2024.
- ^ "2024 PRES PREF PRIMARY ELECTIO". Varun's Live Election Maps. Retrieved March 12, 2024.
- ^ Niesse, Mark; Quinton, Phoebe. "Over 6,000 Georgia Dems cast blank ballots in apparent slap at Biden on Israel". The Atlanta Journal-Constitution. ISSN 1539-7459. Retrieved April 2, 2024.
- ^ "Mississippi Presidential Primary Election Results 2024". NBC News. March 12, 2024. Retrieved March 12, 2024.
- ^ "Northern Marianas Democrat". Green Papers. Retrieved March 12, 2024.
- ^ "Presidential Primary Results". Washington Secretary of State. March 23, 2024. Retrieved March 23, 2024.
- ^ "Arizona Presidential Primary". The AP. April 8, 2024. Retrieved April 18, 2024.
- ^ "Kansas Presidential Primary". The AP. Retrieved March 18, 2024.
- ^ "Ohio Presidential Primary". The AP. Retrieved March 18, 2024.
- ^ "Louisiana Presidential Primary". The AP. Retrieved March 22, 2024.
- ^ "2024 Primary - Congressional District and County Totals". Missouri Democratic Party. Retrieved March 26, 2024.
- ^ "North Dakota Presidential Primary Election Results 2024". NBC News. Retrieved April 2, 2024.
- ^ "Connecticut Presidential Primary". The AP. Retrieved April 1, 2024.
- ^ "New York Presidential Primary". The AP. Retrieved April 1, 2024.
- ^ "Rhode Island Presidential Primary". The AP. April 16, 2024. Retrieved April 18, 2024.
- ^ "Wisconsin Presidential Primary". The AP. Retrieved April 1, 2024.
- ^ Bohrer, Becky; Gruver, Mead (April 13, 2024). "Biden wins more delegates in Wyoming and Alaska as he heads toward Democratic nomination". The AP. Retrieved April 14, 2024.
- ^ "Wyoming Presidential Caucus". The AP. Retrieved April 18, 2024.
- ^ "Pennsylvania Presidential Primary Election Results 2024". NBC News. Retrieved April 23, 2024.
- ^ Candidates for president Archived January 18, 2024, at the Wayback Machine, FEC.gov.
- ^ Marrans, Daniel. "Pro-Palestine Activists Urge New Hampshire Voters To Write In 'Cease-Fire'". HuffPost.com. HuffPost. Retrieved January 23, 2024.
- ^ "2024 Democratic Presidential Primary Election Results". NH SOS. Retrieved February 2, 2024.
- ^ "South Carolina Democratic Primary Results". New York Times. Retrieved February 3, 2024.
- ^ "Silver State 2024 Election Results - Presidential Preference Primary". Secretary of State of Nevada. Retrieved February 6, 2024.
- ^ "2024 Michigan Election Results". Michigan Secretary of State. Retrieved April 5, 2024.
- ^ "Certification of Results - Democratic Party (Excel file with vote totals)". Alabama Secretary of State. Retrieved March 28, 2024.
- ^ "Arkansas Democratic Primary Election Results". The New York Times. March 5, 2024. Retrieved March 6, 2024.
- ^ "American Samoa Democratic Delegation 2024". The Green Papers. Retrieved March 6, 2024.
- ^ "Certified List of Presidential Candidates for voter-nominated offices for the March 5, 2024, presidential primary election" (PDF). Secretary of State of California. December 28, 2023. Retrieved December 29, 2023.
- ^ "California Presidential Primary". Associated Press. March 5, 2024. Retrieved April 5, 2024.
- ^ "Colorado Presidential Primary". Associated Press. Retrieved April 5, 2024.
- ^ "Iowa Democratic Presidential Caucus Results". Des Moines Register. Retrieved March 5, 2024.
- ^ "Tabulations for Elections held in 2024: March 5, 2024 Presidential Primary Election". Maine Secretary of State. Retrieved March 28, 2024.
- ^ "2024 President Democratic Primary". State of Massachusetts. Retrieved March 28, 2024.
- ^ "2024 PRESIDENTIAL PRIMARY RESULTS". OFFICE OF THE MINNESOTA SECRETARY OF STATE STEVE SIMON. Retrieved March 28, 2024.
- ^ "03/05/2024 OFFICIAL PRIMARY ELECTION RESULTS - STATEWIDE". North Carolina State Board of Elections. Retrieved March 28, 2024.
- ^ "Official Results". Oklahoma State Election Board. Retrieved March 28, 2024.
- ^ "March 5, 2024 Democratic Presidential Preference Primary" (PDF). Tennessee Secretary of State. Retrieved March 28, 2024.
- ^ "Tennessee Democratic Primary Election Results". The New York Times. Retrieved March 5, 2024.
- ^ "Tennessee Democratic Delegation 2024". www.thegreenpapers.com. Retrieved May 5, 2023.
- ^ "Texas Democratic Primary Election Results". Texas Secretary of State. Retrieved March 28, 2024.
- ^ "Utah Democratic Primary Election Results". The New York Times. Retrieved March 5, 2024.
- ^ "OFFICIAL REPORT OF THE CANVASSING COMMITTEE UNITED STATES AND VERMONT STATEWIDE OFFICES" (PDF). Vermont Secretary of State. Retrieved March 12, 2024.
- ^ "Vermont Election Night Results". Vermont Secretary of State. Retrieved March 15, 2024.
- ^ "Virginia Democratic Primary Election Results". The New York Times. Retrieved March 5, 2024.
- ^ "Hawaii Democratic Caucus Results". The New York Times. March 7, 2024. Retrieved March 7, 2024.
- ^ "Democratic Presidential Primaries: Democrats Abroad". CNN. Retrieved March 19, 2024.
- ^ Fobbs, Angela (March 25, 2024). "Democrats Abroad Announces 2024 Global Presidential Primary Results". Democrats Abroad. Archived from the original on March 29, 2024. Retrieved March 29, 2024.
- ^ "2024 PRES PREF PRIMARY ELECTIO". Varun's Live Election Maps. Retrieved March 12, 2024.
- ^ "Mississippi Presidential Primary Election Results 2024". NBC News. Retrieved March 12, 2024.
- ^ "Northern Marianas Democrat". Green Papers. Retrieved March 11, 2024.
- ^ "March 12, 2024 Presidential Primary Results". Washington Secretary of State. March 23, 2024. Retrieved April 5, 2024.
- ^ "Arizona Presidential Primary". The AP. April 8, 2024. Retrieved April 18, 2024.
- ^ "IIllinois Presidential Election Results 2024". NBC News. Retrieved March 31, 2024.
- ^ "Kansas Presidential Primary". The AP. Retrieved March 18, 2024.
- ^ "Ohio Presidential Primary". The AP. Retrieved April 27, 2024.
- ^ "Louisiana Presidential Primary". The AP. Retrieved March 22, 2024.
- ^ "Missouri Presidential Primary". The AP. Retrieved March 22, 2024.
- ^ "North Dakota Presidential Primary". The AP. Retrieved March 29, 2024.
- ^ "Connecticut Presidential Primary". The AP. April 12, 2024. Retrieved April 18, 2024.
- ^ "New York Presidential Primary". The AP. April 15, 2024. Retrieved April 18, 2024.
- ^ "Rhode Island Presidential Primary". The AP. April 16, 2024. Retrieved April 18, 2024.
- ^ "Wisconsin Presidential Primary". The AP. Retrieved April 1, 2024.
- ^ "Wyoming Presidential Caucus". The AP. Retrieved April 18, 2024.
- ^ "Pennsylvania Presidential Primary Election Results 2024". NBC News. Retrieved April 23, 2024.