Koceljeva
Коцељева (
Serbian) | |
|---|---|
Village and
municipality | |
     | |
 Coat of arms | |
 Location of the municipality of Koceljeva within Serbia | |
| Coordinates: 44°28′N 19°49′E / 44.467°N 19.817°E | |
| Country | |
| Region | Šumadija and Western Serbia |
| District | Mačva |
| Settlements | 17 |
| Government | |
| • Mayor | Dušan Ilinčić ( SNS) |
| Area | |
| • Municipality | 257 km2 (99 sq mi) |
| • Village | 25.73 km2 (9.93 sq mi) |
| Elevation | 126 m (413 ft) |
| Population (2011 census) | |
| • Municipality | 13,129 |
| • Density | 51/km2 (130/sq mi) |
| • Village | 4,182 |
| • Village density | 160/km2 (420/sq mi) |
| Time zone | UTC+1 ( CET) |
| • Summer ( DST) | UTC+2 ( CEST) |
| Postal code | 15220 |
| Area code | +381(0)15 |
| Vehicle registration | KC |
| Website |
www |
Koceljeva ( Serbian Cyrillic: Коцељева) is a village and municipality located in the Mačva District of western Serbia. According to the 2011 census results, the population of the village is 4,182, while population of the municipality is 13,129. [2]
Settlements
Aside from the village of Koceljeva, the municipality includes the following settlements:
Demographics
| Year | Pop. | ±% p.a. |
|---|---|---|
| 1948 | 19,711 | — |
| 1953 | 20,458 | +0.75% |
| 1961 | 19,982 | −0.29% |
| 1971 | 19,143 | −0.43% |
| 1981 | 18,367 | −0.41% |
| 1991 | 17,064 | −0.73% |
| 2002 | 15,636 | −0.79% |
| 2011 | 13,129 | −1.92% |
| Source: [3] | ||
According to the 2011 census results, the municipality of Koceljeva has 13,129 inhabitants.
Ethnic groups
The ethnic composition of the municipality: [4]
| Ethnic group | Population | % |
|---|---|---|
| Serbs | 12,107 | 92.22% |
| Roma | 850 | 6.47% |
| Russians | 7 | 0.05% |
| Bosniaks | 6 | 0.05% |
| Gorani | 5 | 0.04% |
| Yugoslavs | 5 | 0.04% |
| Croats | 5 | 0.04% |
| Others | 144 | 1.10% |
| Total | 13,129 |
Economy
The following table gives a preview of total number of employed people per their core activity (as of 2017): [5]
| Activity | Total |
|---|---|
| Agriculture, forestry and fishing | 4 |
| Mining | 40 |
| Processing industry | 832 |
| Distribution of power, gas and water | 17 |
| Distribution of water and water waste management | 30 |
| Construction | 95 |
| Wholesale and retail, repair | 307 |
| Traffic, storage and communication | 98 |
| Hotels and restaurants | 51 |
| Media and telecommunications | 10 |
| Finance and insurance | 12 |
| Property stock and charter | 3 |
| Professional, scientific, innovative and technical activities | 56 |
| Administrative and other services | 12 |
| Administration and social assurance | 157 |
| Education | 199 |
| Healthcare and social work | 112 |
| Art, leisure and recreation | 8 |
| Other services | 30 |
| Total | 2,076 |
Gallery
-
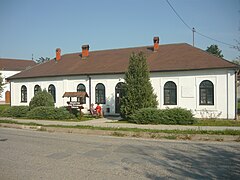
 Castle Hotel in Koceljeva
 -
 Koceljeva Library


Notable people
See also
References
- ^ "Municipalities of Serbia, 2006". Statistical Office of Serbia. Retrieved 2010-11-28.
- ^ "2011 Census of Population, Households and Dwellings in the Republic of Serbia" (PDF). stat.gov.rs. Statistical Office of the Republic of Serbia. Retrieved 15 March 2021.
- ^ "2011 Census of Population, Households and Dwellings in the Republic of Serbia" (PDF). stat.gov.rs. Statistical Office of the Republic of Serbia. Retrieved 18 August 2017.
- ^ "Population by ethnicity and sex, by municipalities and cities" (PDF). stat.gov.rs. Statistical Office of Serbia. Retrieved 18 August 2017.
- ^ "ОПШТИНЕ И РЕГИОНИ У РЕПУБЛИЦИ СРБИЈИ, 2018" (PDF). stat.gov.rs (in Serbian). Statistical Office of the Republic of Serbia. Retrieved 16 March 2019.
External links


|
| This Mačva District, Serbia location article is a stub. You can help Wikipedia by expanding it. |
Koceljeva
Коцељева (
Serbian) | |
|---|---|
Village and
municipality | |
| |
|
Coat of arms | |
|
Location of the municipality of Koceljeva within Serbia | |
| Coordinates: 44°28′N 19°49′E / 44.467°N 19.817°E | |
| Country | |
| Region | Šumadija and Western Serbia |
| District | Mačva |
| Settlements | 17 |
| Government | |
| • Mayor | Dušan Ilinčić ( SNS) |
| Area | |
| • Municipality | 257 km2 (99 sq mi) |
| • Village | 25.73 km2 (9.93 sq mi) |
| Elevation | 126 m (413 ft) |
| Population (2011 census) | |
| • Municipality | 13,129 |
| • Density | 51/km2 (130/sq mi) |
| • Village | 4,182 |
| • Village density | 160/km2 (420/sq mi) |
| Time zone | UTC+1 ( CET) |
| • Summer ( DST) | UTC+2 ( CEST) |
| Postal code | 15220 |
| Area code | +381(0)15 |
| Vehicle registration | KC |
| Website |
www |
Koceljeva ( Serbian Cyrillic: Коцељева) is a village and municipality located in the Mačva District of western Serbia. According to the 2011 census results, the population of the village is 4,182, while population of the municipality is 13,129. [2]
Settlements
Aside from the village of Koceljeva, the municipality includes the following settlements:
Demographics
| Year | Pop. | ±% p.a. |
|---|---|---|
| 1948 | 19,711 | — |
| 1953 | 20,458 | +0.75% |
| 1961 | 19,982 | −0.29% |
| 1971 | 19,143 | −0.43% |
| 1981 | 18,367 | −0.41% |
| 1991 | 17,064 | −0.73% |
| 2002 | 15,636 | −0.79% |
| 2011 | 13,129 | −1.92% |
| Source: [3] | ||
According to the 2011 census results, the municipality of Koceljeva has 13,129 inhabitants.
Ethnic groups
The ethnic composition of the municipality: [4]
| Ethnic group | Population | % |
|---|---|---|
| Serbs | 12,107 | 92.22% |
| Roma | 850 | 6.47% |
| Russians | 7 | 0.05% |
| Bosniaks | 6 | 0.05% |
| Gorani | 5 | 0.04% |
| Yugoslavs | 5 | 0.04% |
| Croats | 5 | 0.04% |
| Others | 144 | 1.10% |
| Total | 13,129 |
Economy
The following table gives a preview of total number of employed people per their core activity (as of 2017): [5]
| Activity | Total |
|---|---|
| Agriculture, forestry and fishing | 4 |
| Mining | 40 |
| Processing industry | 832 |
| Distribution of power, gas and water | 17 |
| Distribution of water and water waste management | 30 |
| Construction | 95 |
| Wholesale and retail, repair | 307 |
| Traffic, storage and communication | 98 |
| Hotels and restaurants | 51 |
| Media and telecommunications | 10 |
| Finance and insurance | 12 |
| Property stock and charter | 3 |
| Professional, scientific, innovative and technical activities | 56 |
| Administrative and other services | 12 |
| Administration and social assurance | 157 |
| Education | 199 |
| Healthcare and social work | 112 |
| Art, leisure and recreation | 8 |
| Other services | 30 |
| Total | 2,076 |
Gallery
-
Castle Hotel in Koceljeva
-
Koceljeva Library
Notable people
See also
References
- ^ "Municipalities of Serbia, 2006". Statistical Office of Serbia. Retrieved 2010-11-28.
- ^ "2011 Census of Population, Households and Dwellings in the Republic of Serbia" (PDF). stat.gov.rs. Statistical Office of the Republic of Serbia. Retrieved 15 March 2021.
- ^ "2011 Census of Population, Households and Dwellings in the Republic of Serbia" (PDF). stat.gov.rs. Statistical Office of the Republic of Serbia. Retrieved 18 August 2017.
- ^ "Population by ethnicity and sex, by municipalities and cities" (PDF). stat.gov.rs. Statistical Office of Serbia. Retrieved 18 August 2017.
- ^ "ОПШТИНЕ И РЕГИОНИ У РЕПУБЛИЦИ СРБИЈИ, 2018" (PDF). stat.gov.rs (in Serbian). Statistical Office of the Republic of Serbia. Retrieved 16 March 2019.
External links
| ||||||||||||
| ||||||||||||
| ||||||||||||
| ||||||||||||
| ||||||||||||
|
| This Mačva District, Serbia location article is a stub. You can help Wikipedia by expanding it. |