
Original file (SVG file, nominally 720 × 700 pixels, file size: 5 KB)
| This is a file from the
Wikimedia Commons. Information from its
description page there is shown below. Commons is a freely licensed media file repository. You can help. |
Summary
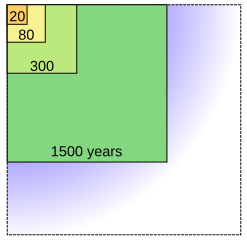
A graphical representation of uranium resources. Areas of the squares are relative to the size of resource. Larger squares include also the contents of the smaller squares inside them. The smallest square represents the available uranium in existing mines according to World Nuclear Association. The second square includes also the NEA/IAEA estimate of available uranium resources at a market price of 130$/kg, as published in their Red Book. The third square is an estimate of the economic, conventional uranium reserves yet to be found by NEA and IAEA. The fourth represents an US DOE estimate of the total reserves of uranium in Earth's crust in the concentrations that are of interest at present mining techniques and uranium prices. The largest square represents the total potential of recoverable uranium with future technologies in the Earth's crust, estimated by NEA and IAEA to be at least 4 billion tonnes.
The numbers in the lower edges of the squares represent how long the given resource would last at current consumption of uranium, with no fuel recycling or breeding technology.
| Description | Estimates of uranium resources of the Earth |
| Date | Original, 9 october 2007. Converted 30 October 2007. |
| Source |
Image self-made from data available at:
|
| Author | Original image by Tungsten. Vectorised in Inkscape by Scott Nash. |
| Other versions | Italian version |
Licensing
| I, the copyright holder of this work, release this work into the
public domain. This applies worldwide. In some countries this may not be legally possible; if so: I grant anyone the right to use this work for any purpose, without any conditions, unless such conditions are required by law. |
File history
Click on a date/time to view the file as it appeared at that time.
| Date/Time | Thumbnail | Dimensions | User | Comment | |
|---|---|---|---|---|---|
| current | 09:09, 15 September 2010 |
| 720 × 700 (5 KB) | Gringer | removed phantom flowed text |
| 11:26, 30 October 2007 |
 | 720 × 700 (4 KB) | Scott Nash | == Summary == A graphical representation of uranium resources. Areas of the squares are relative to the size of resource. Larger squares include also the contents of the smaller squares inside them. The smallest square represents the available uranium in |
File usage
Global file usage
The following other wikis use this file:
- Usage on fa.wikipedia.org
- Usage on it.wikipedia.org
Original file (SVG file, nominally 720 × 700 pixels, file size: 5 KB)
| This is a file from the
Wikimedia Commons. Information from its
description page there is shown below. Commons is a freely licensed media file repository. You can help. |
Summary
A graphical representation of uranium resources. Areas of the squares are relative to the size of resource. Larger squares include also the contents of the smaller squares inside them. The smallest square represents the available uranium in existing mines according to World Nuclear Association. The second square includes also the NEA/IAEA estimate of available uranium resources at a market price of 130$/kg, as published in their Red Book. The third square is an estimate of the economic, conventional uranium reserves yet to be found by NEA and IAEA. The fourth represents an US DOE estimate of the total reserves of uranium in Earth's crust in the concentrations that are of interest at present mining techniques and uranium prices. The largest square represents the total potential of recoverable uranium with future technologies in the Earth's crust, estimated by NEA and IAEA to be at least 4 billion tonnes.
The numbers in the lower edges of the squares represent how long the given resource would last at current consumption of uranium, with no fuel recycling or breeding technology.
| Description | Estimates of uranium resources of the Earth |
| Date | Original, 9 october 2007. Converted 30 October 2007. |
| Source |
Image self-made from data available at:
|
| Author | Original image by Tungsten. Vectorised in Inkscape by Scott Nash. |
| Other versions | Italian version |
Licensing
| I, the copyright holder of this work, release this work into the
public domain. This applies worldwide. In some countries this may not be legally possible; if so: I grant anyone the right to use this work for any purpose, without any conditions, unless such conditions are required by law. |
File history
Click on a date/time to view the file as it appeared at that time.
| Date/Time | Thumbnail | Dimensions | User | Comment | |
|---|---|---|---|---|---|
| current | 09:09, 15 September 2010 |
| 720 × 700 (5 KB) | Gringer | removed phantom flowed text |
| 11:26, 30 October 2007 |
| 720 × 700 (4 KB) | Scott Nash | == Summary == A graphical representation of uranium resources. Areas of the squares are relative to the size of resource. Larger squares include also the contents of the smaller squares inside them. The smallest square represents the available uranium in |
File usage
Global file usage
The following other wikis use this file:
- Usage on fa.wikipedia.org
- Usage on it.wikipedia.org