| |||||||||||||||||||
All 298 seats in the National Assembly | |||||||||||||||||||
|---|---|---|---|---|---|---|---|---|---|---|---|---|---|---|---|---|---|---|---|
| Turnout | 97.98% | ||||||||||||||||||
| |||||||||||||||||||
 |
|---|
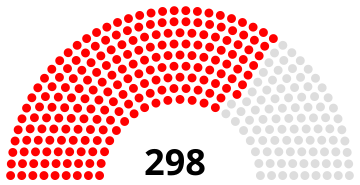
Parliamentary elections were held in Hungary on 17 May 1953. [1] As would be the case with all elections for the remainder of Communist rule, voters were presented with a single list from the Communist Hungarian Working People's Party, comprising Communists and pro-Communist independents. The Working People's Party won 206 of the 298 seats, with the remaining 92 going to independents. [2]
Results
 | |||||||
|---|---|---|---|---|---|---|---|
| Party or alliance | Votes | % | Seats | +/– | |||
|
Hungarian Independence People's Front | Hungarian Working People's Party | 6,256,653 | 99.03 | 206 | –79 | ||
| Independents | 92 | –25 | |||||
| Against | 61,257 | 0.97 | – | – | |||
| Total | 6,317,910 | 100.00 | 298 | –104 | |||
| Valid votes | 6,317,910 | 99.17 | |||||
| Invalid/blank votes | 52,609 | 0.83 | |||||
| Total votes | 6,370,519 | 100.00 | |||||
| Registered voters/turnout | 6,501,869 | 97.98 | |||||
| Source: Nohlen & Stöver | |||||||
References
- ^ Dieter Nohlen & Philip Stöver (2010) Elections in Europe: A data handbook, p899 ISBN 978-3-8329-5609-7
- ^ Nohlen & Stöver, p931
| |||||||||||||||||||
All 298 seats in the National Assembly | |||||||||||||||||||
|---|---|---|---|---|---|---|---|---|---|---|---|---|---|---|---|---|---|---|---|
| Turnout | 97.98% | ||||||||||||||||||
| |||||||||||||||||||
 |
|---|
Parliamentary elections were held in Hungary on 17 May 1953. [1] As would be the case with all elections for the remainder of Communist rule, voters were presented with a single list from the Communist Hungarian Working People's Party, comprising Communists and pro-Communist independents. The Working People's Party won 206 of the 298 seats, with the remaining 92 going to independents. [2]
Results
 | |||||||
|---|---|---|---|---|---|---|---|
| Party or alliance | Votes | % | Seats | +/– | |||
|
Hungarian Independence People's Front | Hungarian Working People's Party | 6,256,653 | 99.03 | 206 | –79 | ||
| Independents | 92 | –25 | |||||
| Against | 61,257 | 0.97 | – | – | |||
| Total | 6,317,910 | 100.00 | 298 | –104 | |||
| Valid votes | 6,317,910 | 99.17 | |||||
| Invalid/blank votes | 52,609 | 0.83 | |||||
| Total votes | 6,370,519 | 100.00 | |||||
| Registered voters/turnout | 6,501,869 | 97.98 | |||||
| Source: Nohlen & Stöver | |||||||
References
- ^ Dieter Nohlen & Philip Stöver (2010) Elections in Europe: A data handbook, p899 ISBN 978-3-8329-5609-7
- ^ Nohlen & Stöver, p931

