| Mathematics desk | ||
|---|---|---|
| < November 6 | << Oct | November | Dec >> | November 8 > |
| Welcome to the Wikipedia Mathematics Reference Desk Archives |
|---|
| The page you are currently viewing is a transcluded archive page. While you can leave answers for any questions shown below, please ask new questions on one of the current reference desk pages. |
November 7 Information
The Maximum number of pentagons which can be selected from a dodecahedron with no elements (points, lines) shared is 3. 4 identical copies of such a set will make the dodecahedron. What is the maximum number of dodecahedra sharing no elements can be selected from the 120 cell and can X copies of that maximum set make the entire 120 cell? Naraht ( talk) 02:09, 7 November 2021 (UTC)
- A maximal such set of dodecahedra in a 120-cell would immediately give a maximal vertex set of the dual 600-cell. However, it is
already known that the maximal such set consists of 24 vertices. So one obvious candidate comes from the compound of five 24-cells in a
120-cell600-cell (sorry!) Double sharp ( talk) 22:16, 9 November 2021 (UTC). From the illustrations here, it seems that if you take a single dodecahedron of a 120-cell, then it is entirely closed off by the 12 dodecahedra surrounding it (connected at each face). So I'd expect that the 24-cell arrangement works and leads to completely nonadjacent dodecahedra. Sorry that my 4D visualisation is a bit rusty right now. :( Double sharp ( talk) 11:38, 7 November 2021 (UTC)
-
Saul Schleimer's answer. —
Tamfang (
talk) 19:09, 7 November 2021 (UTC)
- So I was right! :D
Double sharp (
talk) 21:02, 7 November 2021 (UTC)
-
TamfangI'm sorry, I can't read twitter on this computer. Can it be copied here?
Naraht (
talk) 16:49, 9 November 2021 (UTC)
- @
Naraht: It says:
Talking with @SaulSchleimer: I was wrong, there is a configuration with 24 non-touching dodecahedra, and five copies of it do make up the whole 120-cell. On layers going out, we have 1, 8, 6, 8, 1 dodecahedra.
Double sharp ( talk) 20:06, 9 November 2021 (UTC) —That's Henry Segerman saying that, not me, lest anyone be misled. I offered the question to Henry because I thought he might know. — Tamfang ( talk) 23:15, 9 November 2021 (UTC)-
Tamfang, The 120 cell itself is by layers 1, 12, 20,12,30,12,20, 12,1. I'm guessing that the non-touching are the pole end, 8 of the 20, 6 of the 30, 8 of the 20 and the other pole. the 20 dodecahedra on that layer line up with the vertices in the pole dodec, so the 8 in the non-touching are presumably at the points corresponding to one of the nested cubes of the pole dodec. This and then the 6 in the middle would nicely correspond to an embedded 24-cell. Should their be an article for the compound of five 24-cells in a 120-cell, the way we do for the compound of five cubes?
Naraht (
talk) 20:19, 9 November 2021 (UTC)
- I'm not Tamfang, but yes, I think that's correct. The compound of five 24-cells is for now on WP just one of the entries at Polytope compound#4-polytope compounds and List of regular polytopes and compounds#Four dimensional cmopounds. I'm not sure how much there would be to hang an article on, though. The regular polychoron compounds were actually until recently not even fully enumerated: Coxeter in his Regular Polytopes got almost all of them by systematically faceting a 120-cell, but in 2018 McMullen found that Coxeter had missed a few while doing so. He did prove that the list is now complete: his proof heavily uses quaternions. Double sharp ( talk) 22:10, 9 November 2021 (UTC)
- P.S. BTW, I misspoke: it's not a compound of five 24-cells in a 120-cell, but a compound of five 24-cells in a 600-cell. (Of course it is, since five 24-cells have in total 5×24=120 vertices, same as a 600-cell.) What I meant to refer to is that it is a (chiral) stellation of the 120-cell, instead, which is why you can naturally partition the original cells into five equal sets by considering which 24-cell they stellate into. So, kind of like how you can do this trick for an icosahedron by considering the compound of five tetrahedra, which is a stellation of the icosahedron, but whose vertices are those of the dual dodecahedron. Sorry about that. Double sharp ( talk) 22:12, 9 November 2021 (UTC)
-
Tamfang, The 120 cell itself is by layers 1, 12, 20,12,30,12,20, 12,1. I'm guessing that the non-touching are the pole end, 8 of the 20, 6 of the 30, 8 of the 20 and the other pole. the 20 dodecahedra on that layer line up with the vertices in the pole dodec, so the 8 in the non-touching are presumably at the points corresponding to one of the nested cubes of the pole dodec. This and then the 6 in the middle would nicely correspond to an embedded 24-cell. Should their be an article for the compound of five 24-cells in a 120-cell, the way we do for the compound of five cubes?
Naraht (
talk) 20:19, 9 November 2021 (UTC)
- @
Naraht: It says:
-
TamfangI'm sorry, I can't read twitter on this computer. Can it be copied here?
Naraht (
talk) 16:49, 9 November 2021 (UTC)
- So I was right! :D
Double sharp (
talk) 21:02, 7 November 2021 (UTC)
If x, y, and z are positive integers and z is a function of x and y, z(x,y) = (y^2-3y)/2+x+1, given z, what are x and y? (Actually, if you have y, x is trivial to get.) Bubba73 You talkin' to me? 02:32, 7 November 2021 (UTC)
- In general, given z, there are many pairs (x, y) satisfying the equation
- z = (y2 − 3y)/2 + x + 1.
- The number of such pairs grows roughly like 1⁄2√z.
- There are three variables. If you treat two of the variables as knowns, you can solve for the third.
- The equation has the particularity that whenever it is satisfied by some triple (x, y, z), then each triple (x + c, y, z + c) also satisfies the equation. The study of the equation can be simplified by the substitution x = z + u − 1, introducing a new variable u, which need not be positive. Applying this and simplifying the result gives us this:
- y2 − 3y + 2u = 0.
- For any pair (y, u) satisfying the transformed equation, each triple of the form (u + c, y, c + 1) satisfies the original equation, provided that c ≥ max(0, 1 − u). And conversely, each triple (x, y, z) satisfying the original equation gives rise to the pair (y, x − z + 1) satisfying the transformed equation. -- Lambiam 04:52, 7 November 2021 (UTC)
- Thanks, I forgot one condition that will make the solution unique: x<y.
Bubba73
You talkin' to me? 05:24, 7 November 2021 (UTC)
- The following involves some
hand-waving. Given z and x, we can solve for y using the
quadratic formula, discarding the negative solution. From the formula we see that for fixed z, as x increases, y (not necessarily an integer) decreases. Since x ≥ 1, a boundary case is obtained when x = 1, which means that y2 − 3y − 2z + 4 = 0. Solving for y shows now that y ≤ 1⁄2(3 + √(8z − 7)), with equality for x = 1. Since y is an integer, we can put
- y = ⌊1⁄2(3 + √(8z − 7))⌋, x = z − (y2 − 3y)/2 − 1.
- --
Lambiam 11:24, 7 November 2021 (UTC)
- Thanks, I thought that y would involve the integer part of a square root, but I wasn't able to get it. This is likely to be in a new sequence in OEIS soon. Bubba73 You talkin' to me? 01:18, 8 November 2021 (UTC)
- The following involves some
hand-waving. Given z and x, we can solve for y using the
quadratic formula, discarding the negative solution. From the formula we see that for fixed z, as x increases, y (not necessarily an integer) decreases. Since x ≥ 1, a boundary case is obtained when x = 1, which means that y2 − 3y − 2z + 4 = 0. Solving for y shows now that y ≤ 1⁄2(3 + √(8z − 7)), with equality for x = 1. Since y is an integer, we can put
- Thanks, I forgot one condition that will make the solution unique: x<y.
Bubba73
You talkin' to me? 05:24, 7 November 2021 (UTC)
- This would have been easier if I'd thought about it in the right way - y is the index of the largest triangular number that is < z. Bubba73 You talkin' to me? 06:51, 8 November 2021 (UTC)
-
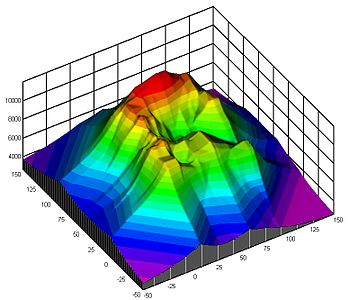 A three-dimensional surface
 -
 A two-dimensional contour graph of the previous three-dimensional surface
 -
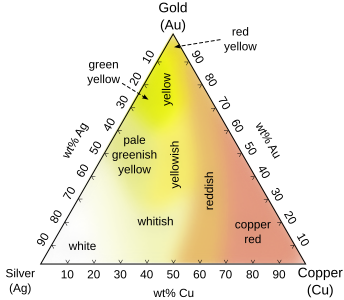 Ternary diagram showing approximate colours of Ag–Au–Cu alloys in jewellery making
 -
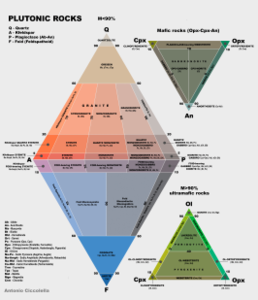 Two ternary diagrams with matching axes can be joined at that axis to make a piper diagram
 -
 ...or four ternary diagrams...
 -
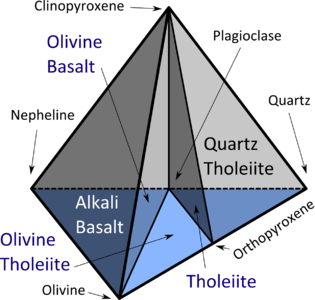 ...which works a lot better than going 3-D, in terms of clear communication


If you have three variables that sum to some constant, , then you only have two degrees of freedom. So while you could plot them in a cube, you can also plot all three on a ternary diagram. Since the value of each variable can be read off a ternary diagram as proportional to the distance from each corner, and humans are pretty good at judging relative and absolute linear distances, and the internet is still mostly 2-D, this works well.

I need to present some data with three variables and two degrees of freedom in the form , with variables that multiply to a constant. Does anyone have any good suggestions for how to do this? I mean, something more like a ternary diagram than a contour plot. Ideally, I'd like to be able to join such diagrams along the axes, as ternary diagrams are joined in a piper plot (yes, a contour plot would do that, for two axes, but it's harder to read).

As a simple example for illustrative purposes, suppose I had the masses and maximum accellerations of a Saturn V rocket, the QEII, an ice yacht, the latest Tesla, the latest Hummer, and Usain Bolt. I probably do, this is Wikipedia. And knowing that F = ma, I wanted to plot all three variables for all of these on a ternary-like plot.
I actually want to plot some data over some equations, comparing the datasets and the fit of the data. I have several equations of form , sharing some variables. HLHJ ( talk) 15:56, 7 November 2021 (UTC)
- This is tough since the triangular shape of ternary diagrams only works because each variable is bounded (from 0 to 1). I suppose if you can bound your data you could try a logarithmic ternary diagram since the logs would then add to 0.
eviolite
(talk) 16:01, 7 November 2021 (UTC)
- In the typical applications of a plot with using a triangle-based
barycentric coordinate system, the three variables are each bounded by the unit interval, so that the plot fits neatly in a triangle. This is, however, not essential. Using complex coordinates, defining
- we obtain a bijective mapping with
- where
- For example, The formulas for the inverse mapping are a bit messier. -- Lambiam 16:51, 7 November 2021 (UTC)
- In the typical applications of a plot with using a triangle-based
barycentric coordinate system, the three variables are each bounded by the unit interval, so that the plot fits neatly in a triangle. This is, however, not essential. Using complex coordinates, defining


| Mathematics desk | ||
|---|---|---|
| < November 6 | << Oct | November | Dec >> | November 8 > |
| Welcome to the Wikipedia Mathematics Reference Desk Archives |
|---|
| The page you are currently viewing is a transcluded archive page. While you can leave answers for any questions shown below, please ask new questions on one of the current reference desk pages. |
November 7 Information
The Maximum number of pentagons which can be selected from a dodecahedron with no elements (points, lines) shared is 3. 4 identical copies of such a set will make the dodecahedron. What is the maximum number of dodecahedra sharing no elements can be selected from the 120 cell and can X copies of that maximum set make the entire 120 cell? Naraht ( talk) 02:09, 7 November 2021 (UTC)
- A maximal such set of dodecahedra in a 120-cell would immediately give a maximal vertex set of the dual 600-cell. However, it is
already known that the maximal such set consists of 24 vertices. So one obvious candidate comes from the compound of five 24-cells in a
120-cell600-cell (sorry!) Double sharp ( talk) 22:16, 9 November 2021 (UTC). From the illustrations here, it seems that if you take a single dodecahedron of a 120-cell, then it is entirely closed off by the 12 dodecahedra surrounding it (connected at each face). So I'd expect that the 24-cell arrangement works and leads to completely nonadjacent dodecahedra. Sorry that my 4D visualisation is a bit rusty right now. :( Double sharp ( talk) 11:38, 7 November 2021 (UTC)
-
Saul Schleimer's answer. —
Tamfang (
talk) 19:09, 7 November 2021 (UTC)
- So I was right! :D
Double sharp (
talk) 21:02, 7 November 2021 (UTC)
-
TamfangI'm sorry, I can't read twitter on this computer. Can it be copied here?
Naraht (
talk) 16:49, 9 November 2021 (UTC)
- @
Naraht: It says:
Talking with @SaulSchleimer: I was wrong, there is a configuration with 24 non-touching dodecahedra, and five copies of it do make up the whole 120-cell. On layers going out, we have 1, 8, 6, 8, 1 dodecahedra.
Double sharp ( talk) 20:06, 9 November 2021 (UTC) —That's Henry Segerman saying that, not me, lest anyone be misled. I offered the question to Henry because I thought he might know. — Tamfang ( talk) 23:15, 9 November 2021 (UTC)-
Tamfang, The 120 cell itself is by layers 1, 12, 20,12,30,12,20, 12,1. I'm guessing that the non-touching are the pole end, 8 of the 20, 6 of the 30, 8 of the 20 and the other pole. the 20 dodecahedra on that layer line up with the vertices in the pole dodec, so the 8 in the non-touching are presumably at the points corresponding to one of the nested cubes of the pole dodec. This and then the 6 in the middle would nicely correspond to an embedded 24-cell. Should their be an article for the compound of five 24-cells in a 120-cell, the way we do for the compound of five cubes?
Naraht (
talk) 20:19, 9 November 2021 (UTC)
- I'm not Tamfang, but yes, I think that's correct. The compound of five 24-cells is for now on WP just one of the entries at Polytope compound#4-polytope compounds and List of regular polytopes and compounds#Four dimensional cmopounds. I'm not sure how much there would be to hang an article on, though. The regular polychoron compounds were actually until recently not even fully enumerated: Coxeter in his Regular Polytopes got almost all of them by systematically faceting a 120-cell, but in 2018 McMullen found that Coxeter had missed a few while doing so. He did prove that the list is now complete: his proof heavily uses quaternions. Double sharp ( talk) 22:10, 9 November 2021 (UTC)
- P.S. BTW, I misspoke: it's not a compound of five 24-cells in a 120-cell, but a compound of five 24-cells in a 600-cell. (Of course it is, since five 24-cells have in total 5×24=120 vertices, same as a 600-cell.) What I meant to refer to is that it is a (chiral) stellation of the 120-cell, instead, which is why you can naturally partition the original cells into five equal sets by considering which 24-cell they stellate into. So, kind of like how you can do this trick for an icosahedron by considering the compound of five tetrahedra, which is a stellation of the icosahedron, but whose vertices are those of the dual dodecahedron. Sorry about that. Double sharp ( talk) 22:12, 9 November 2021 (UTC)
-
Tamfang, The 120 cell itself is by layers 1, 12, 20,12,30,12,20, 12,1. I'm guessing that the non-touching are the pole end, 8 of the 20, 6 of the 30, 8 of the 20 and the other pole. the 20 dodecahedra on that layer line up with the vertices in the pole dodec, so the 8 in the non-touching are presumably at the points corresponding to one of the nested cubes of the pole dodec. This and then the 6 in the middle would nicely correspond to an embedded 24-cell. Should their be an article for the compound of five 24-cells in a 120-cell, the way we do for the compound of five cubes?
Naraht (
talk) 20:19, 9 November 2021 (UTC)
- @
Naraht: It says:
-
TamfangI'm sorry, I can't read twitter on this computer. Can it be copied here?
Naraht (
talk) 16:49, 9 November 2021 (UTC)
- So I was right! :D
Double sharp (
talk) 21:02, 7 November 2021 (UTC)
If x, y, and z are positive integers and z is a function of x and y, z(x,y) = (y^2-3y)/2+x+1, given z, what are x and y? (Actually, if you have y, x is trivial to get.) Bubba73 You talkin' to me? 02:32, 7 November 2021 (UTC)
- In general, given z, there are many pairs (x, y) satisfying the equation
- z = (y2 − 3y)/2 + x + 1.
- The number of such pairs grows roughly like 1⁄2√z.
- There are three variables. If you treat two of the variables as knowns, you can solve for the third.
- The equation has the particularity that whenever it is satisfied by some triple (x, y, z), then each triple (x + c, y, z + c) also satisfies the equation. The study of the equation can be simplified by the substitution x = z + u − 1, introducing a new variable u, which need not be positive. Applying this and simplifying the result gives us this:
- y2 − 3y + 2u = 0.
- For any pair (y, u) satisfying the transformed equation, each triple of the form (u + c, y, c + 1) satisfies the original equation, provided that c ≥ max(0, 1 − u). And conversely, each triple (x, y, z) satisfying the original equation gives rise to the pair (y, x − z + 1) satisfying the transformed equation. -- Lambiam 04:52, 7 November 2021 (UTC)
- Thanks, I forgot one condition that will make the solution unique: x<y.
Bubba73
You talkin' to me? 05:24, 7 November 2021 (UTC)
- The following involves some
hand-waving. Given z and x, we can solve for y using the
quadratic formula, discarding the negative solution. From the formula we see that for fixed z, as x increases, y (not necessarily an integer) decreases. Since x ≥ 1, a boundary case is obtained when x = 1, which means that y2 − 3y − 2z + 4 = 0. Solving for y shows now that y ≤ 1⁄2(3 + √(8z − 7)), with equality for x = 1. Since y is an integer, we can put
- y = ⌊1⁄2(3 + √(8z − 7))⌋, x = z − (y2 − 3y)/2 − 1.
- --
Lambiam 11:24, 7 November 2021 (UTC)
- Thanks, I thought that y would involve the integer part of a square root, but I wasn't able to get it. This is likely to be in a new sequence in OEIS soon. Bubba73 You talkin' to me? 01:18, 8 November 2021 (UTC)
- The following involves some
hand-waving. Given z and x, we can solve for y using the
quadratic formula, discarding the negative solution. From the formula we see that for fixed z, as x increases, y (not necessarily an integer) decreases. Since x ≥ 1, a boundary case is obtained when x = 1, which means that y2 − 3y − 2z + 4 = 0. Solving for y shows now that y ≤ 1⁄2(3 + √(8z − 7)), with equality for x = 1. Since y is an integer, we can put
- Thanks, I forgot one condition that will make the solution unique: x<y.
Bubba73
You talkin' to me? 05:24, 7 November 2021 (UTC)
- This would have been easier if I'd thought about it in the right way - y is the index of the largest triangular number that is < z. Bubba73 You talkin' to me? 06:51, 8 November 2021 (UTC)
-
A three-dimensional surface
-
A two-dimensional contour graph of the previous three-dimensional surface
-
Ternary diagram showing approximate colours of Ag–Au–Cu alloys in jewellery making
-
Two ternary diagrams with matching axes can be joined at that axis to make a piper diagram
-
...or four ternary diagrams...
-
...which works a lot better than going 3-D, in terms of clear communication
If you have three variables that sum to some constant, , then you only have two degrees of freedom. So while you could plot them in a cube, you can also plot all three on a ternary diagram. Since the value of each variable can be read off a ternary diagram as proportional to the distance from each corner, and humans are pretty good at judging relative and absolute linear distances, and the internet is still mostly 2-D, this works well.
I need to present some data with three variables and two degrees of freedom in the form , with variables that multiply to a constant. Does anyone have any good suggestions for how to do this? I mean, something more like a ternary diagram than a contour plot. Ideally, I'd like to be able to join such diagrams along the axes, as ternary diagrams are joined in a piper plot (yes, a contour plot would do that, for two axes, but it's harder to read).
As a simple example for illustrative purposes, suppose I had the masses and maximum accellerations of a Saturn V rocket, the QEII, an ice yacht, the latest Tesla, the latest Hummer, and Usain Bolt. I probably do, this is Wikipedia. And knowing that F = ma, I wanted to plot all three variables for all of these on a ternary-like plot.
I actually want to plot some data over some equations, comparing the datasets and the fit of the data. I have several equations of form , sharing some variables. HLHJ ( talk) 15:56, 7 November 2021 (UTC)
- This is tough since the triangular shape of ternary diagrams only works because each variable is bounded (from 0 to 1). I suppose if you can bound your data you could try a logarithmic ternary diagram since the logs would then add to 0.
eviolite
(talk) 16:01, 7 November 2021 (UTC)
- In the typical applications of a plot with using a triangle-based
barycentric coordinate system, the three variables are each bounded by the unit interval, so that the plot fits neatly in a triangle. This is, however, not essential. Using complex coordinates, defining
- we obtain a bijective mapping with
- where
- For example, The formulas for the inverse mapping are a bit messier. -- Lambiam 16:51, 7 November 2021 (UTC)
- In the typical applications of a plot with using a triangle-based
barycentric coordinate system, the three variables are each bounded by the unit interval, so that the plot fits neatly in a triangle. This is, however, not essential. Using complex coordinates, defining