| This page is an archive. Do not edit the contents of this page. Please direct any additional comments to the current main page. |
 | Archives of 2023: January, February, March, April, May, June, July, August, September, October, November, December |
Zambesia
{{ Resolved}}

- Article(s)
- Zambesia
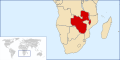
- Request
- I’ve been researching the movement for Zambesia and thought it’d be nice to have a “standard” Wikipedia map to go along with a future article I plan to make. See the Cape Republic page for the kind of format I’m going for. Thanks for any and all assistance!
-- Pruehito ( talk) 16:17, 10 August 2023 (UTC)
- Discussion
- @ Pruehito hi, do you have a reliable source for the map? The one of the right doesn't have any sources. – Isochrone ( T) 12:30, 11 August 2023 (UTC)
- @
Isochrone
https://unpo.org/article/22010
Pruehito (
talk) 19:56, 11 August 2023 (UTC)
- @ Pruehito please see File:Zambesia location map.svg. I'm happy to implement changes as appropriate. – Isochrone ( T) 14:37, 15 August 2023 (UTC)
Historical conflict map in southern Ukraine
- Article(s)
- Battle of Dibrivka
- Request
- Hello! As part of a GA review, it's been requested that I get a historical conflict map for the Battle of Dibrivka and its aftermath, which took place in southern Ukraine in late 1918. The battle itself was centred on the village of Velykomykhailivka and surrounding Dibrivka forest. The aftermath involved movement through a number of towns in the former Oleksandrivsky uezd of the former Katerynoslav province, including Velykomykhailivka, as well as Harylivka, Ivanivka, Tsarekostyantynivka, Temyrivka and Huliaipole. In the modern day, these towns are found in the Polohy Raion in Zaporizhzhia Oblast and the Synelnykove Raion in Dnipropetrovsk Oblast. If anybody could help put together such maps, I would appreciate it immensely. -- Grnrchst ( talk) 14:42, 2 August 2023 (UTC)
- Discussion
Creation of world map
-
 Base image
 -
 Use
Use


Not the first time I show up with this project here, once again I need some assistance. We all know our SVG blank world map which is used, with some alterations, for choropleth maps. What I am now working are historical world maps, i. e. I track changes in the world map from today back to the past. Current state is 1992, and now I would like to have a first historical SVG blank world map. The data exists as a shapefile within a QGIS project, but I am to much a beginner to be able to export the data on my own in sound way. Is there anyone here who could assist me by that, creating something like a template that enables me to continue on my own?-- Antemister ( talk) 08:30, 4 August 2023 (UTC)
- @
Antemister: Where is the data?
M.Bitton (
talk) 10:35, 4 August 2023 (UTC)
- Have uploaded it now at
[1], the project file consists of two relevant layers, Layer ISO is an ISO 3166 world map as of 2023, based on geoboundaries with some minor alterations, ISO_borderchanges contains all international boundary changes between 1992 and 2022, organized via the temporal controller function. data — MITC_disputed_regions_v2 and Testplatte are working layers, Layer B and C include disputed boundaries and countries, they are not relevant at the moment.--
Antemister (
talk) 11:04, 4 August 2023 (UTC)
- Addition: You might know Historicalmapchart, which already has a similar function but with a lower accuracy of research. Its base map is at
[2], ideally the SVG gets the same structure, so it could be included into that already existing web application.--
Antemister (
talk) 11:17, 4 August 2023 (UTC)
- I'm not exactly sure I understand what you're after. Is it a 1992 world map (i.e., the 2023 map with the "ISO_borderchanges" included)? What web application are you referring to? How is the structure used on Historicalmapchart different from the one used on our SVG blank world map and why does it have to follow that particular structure instead of the one that we are familiar with? Also, it's not clear how the borders of some of the countries that are included in "ISO_borderchanges" have changed (eg. Australia, Namibia, South Africa, etc.). M.Bitton ( talk) 15:34, 4 August 2023 (UTC)
- Addition: You might know Historicalmapchart, which already has a similar function but with a lower accuracy of research. Its base map is at
[2], ideally the SVG gets the same structure, so it could be included into that already existing web application.--
Antemister (
talk) 11:17, 4 August 2023 (UTC)
- Have uploaded it now at
[1], the project file consists of two relevant layers, Layer ISO is an ISO 3166 world map as of 2023, based on geoboundaries with some minor alterations, ISO_borderchanges contains all international boundary changes between 1992 and 2022, organized via the temporal controller function. data — MITC_disputed_regions_v2 and Testplatte are working layers, Layer B and C include disputed boundaries and countries, they are not relevant at the moment.--
Antemister (
talk) 11:04, 4 August 2023 (UTC)
As usual, my explanations arised more questions than it answered, so more in detail step by step:
1) The shapefiles I sent you actually include a political world map for any time between 2023 and 1992. You have to activate Layer ISO and then place ISO_borderchanges on top. The latter includes a polygon for every country whose borders differed between 1992 and 2023 from the today's borders. So, e. g. for Yemen the shape between the 1992 border agreement with Oman and the 2000 border treaty with Saudi Arabia (indicated by the date in the attribute table), the post-2000 border is then current border and thus not part of the ISO_borderchanges layer. By applying the temporal controller you can use the slider to display a world map for any time between (yes, it it works only limited now because I have not added a dummy date if the shape existed before 1992, but it should be sufficient to understand the principle)
2) Look at
[3], i have been in contact with the site maintainer there, and he could add my map as long I provide him an SVG that works with his application.
3) Have a look at source code of linked SVG file, instead of having 70 different maps for each year, there is only one SVG which has a similar structure as my QGIS project. It includes all the different country shapes plus a time range, e. g. "GDR 1949 1989". If you place the slider at, say, 1955, the software takes all shapes whose time range include that year and drop the others. So you have a world map of 1955 (the idea of structuring the QGIS file was of course I derived from this)
4) My research goes far more into detail as it would be necessary if the only aim were such choropleth maps, tracing also minor border changes. Australia incorporate Norfolk Island in 2015, and for South Africa/Namibia it is the transfer of Walvis Bay in 1994, that why these countries are included.
So, ideal solution would be the extraction of an SVG map that has a Wikipedia-style look and a Historicalmapchart-style source code, than I would provide it to Mapchart, he implements it into his application, we take out a map for each year to upload it at Commons for documentary purposes, and for general use Historicalmapchart is applied.
Has my plan become more clear?--
Antemister (
talk) 21:59, 4 August 2023 (UTC)
- Basically, you want to create a map for Historicalmapchart. Is that correct?
M.Bitton (
talk) 09:44, 5 August 2023 (UTC)
- Oh, no, did it make the that impression? The story behind it is long, I started with the research a decade ago, together with a graphist that later lost interest in the topic. About a dozen of maps were made, see
commons:Category:SVG historic world maps (location map scheme), but then the project fell asleep. It had been two quarantines that reactivated it, so I continued research and decided to extend the scope, from an SVG-only world map to GIS model of geopolitical changes in the 20th century. But still the "base maps for choropleth maps in wikipedia" is the central purpose, in combination with a tool to colorize the countries without text editing or Inkscape.
- Actually such a tool exists, a poorly programmed desktop application that was part of a training project some years ago (I am not a programmer). But since then the situation has changed, I don't believe that such a desktop tool is state of the art anymore when Mapchart exists as a sophisticated web application with a compatible licence. Yes, there might be different views on that is my suggestion to get that up und running.
- Does that explanation make my approach more logical?--
Antemister (
talk) 11:29, 5 August 2023 (UTC)
- Yes and the above explanation doesn't change the impression as it simply tells me that you want to create a map that runs on their platform.
M.Bitton (
talk) 11:36, 5 August 2023 (UTC)
- Indeed, the aim is a map that (also) works with that platform, but is that a problem or drawback-- Antemister ( talk) 13:14, 5 August 2023 (UTC)
- Yes and the above explanation doesn't change the impression as it simply tells me that you want to create a map that runs on their platform.
M.Bitton (
talk) 11:36, 5 August 2023 (UTC)
- Oh, no, did it make the that impression? The story behind it is long, I started with the research a decade ago, together with a graphist that later lost interest in the topic. About a dozen of maps were made, see
commons:Category:SVG historic world maps (location map scheme), but then the project fell asleep. It had been two quarantines that reactivated it, so I continued research and decided to extend the scope, from an SVG-only world map to GIS model of geopolitical changes in the 20th century. But still the "base maps for choropleth maps in wikipedia" is the central purpose, in combination with a tool to colorize the countries without text editing or Inkscape.
Port Phillip Bay and Preservation Island
I would like a map that provides context for a historical kidnapping from Port Phillip Bay, Victoria, Australia to Preservation Island, Tasmania and the places the parties lived. All the maps seem very cluttered, so I would like them simplified. Basically, something like this as an example, but only with Australia (no New Zealand) and with the inset bigger than the map of Australia. The inset would show only the Melbourne area to the Furneaux Islands. I know it sounds kind of complicated but basically, I’d like all the clutter removed from this and the inset to show the area between the bottom legend's 144° to 150° and the side legend from 38° to 41°. 1) I'd like the Australian states named, with Victoria bolded. 2) I'd like Melbourne, Point Nepean, the bay, Port Phillip, Arthur's Seat, and Western Port shown. The locations of the last 3 are on this. 3) For the western islands in the Bass Strait, I'd like these shown with Robbins Island highlighted. 4) For the eastern stretch, I'd like this image to show the Furneaux group, with Mount Chappel Island, Little Dog Island, Gun Carriage Island (shown on the map as Vansittart Island), Preservation Island, and Clarke Island highlighted. Is this possible? 17:31, 26 August 2023 (UTC) SusunW ( talk) 17:31, 26 August 2023 (UTC)
- Pinging
Goran tek-en, who made the original inset map to see if he thinks this is possible.
SusunW (
talk) 13:51, 30 August 2023 (UTC)
-
SusunW, I haven't checked everything in detail here but it all seems possible but I will need you to be available thru the process.
 Request taken by --always ping me--
Goran tek-en (
talk) 17:11, 30 August 2023 (UTC).
Request taken by --always ping me--
Goran tek-en (
talk) 17:11, 30 August 2023 (UTC).
-
Goran tek-en I am so excited! Thank you so much. I'm good until September 19, when I will be traveling abroad for my mom's birthday.
SusunW (
talk) 17:13, 30 August 2023 (UTC)
- @
SusunW I will be away for 9-16 of september and I don't put in extremely many hours at commons right now so we will just take the time we need. When will you be back? --always ping me--
Goran tek-en (
talk) 17:34, 30 August 2023 (UTC)
-
Goran tek-en I will be gone from the 19-26 but then back in Mexico (CST). There is no particular hurry, but I think the map it will give excellent context for the very confusing records on
Louisa Briggs. I cannot say how much I appreciate your help. Truly, I am grateful.
SusunW (
talk) 17:39, 30 August 2023 (UTC)
- @
SusunW I'm just glad if some of my knowledge can do something for you and your excellent work. --always ping me--
Goran tek-en (
talk) 17:46, 30 August 2023 (UTC)
- Thank you so much
Goran tek-en. I just don't have the skills for graphics but they are so helpful to give a context for narrative text. It truly takes a village to create articles.
SusunW (
talk) 17:50, 30 August 2023 (UTC)
- @
SusunW
- So we have to start with establishing of the area of the inset is this red rectangle correct?
- You can have many different types of maps wikipedia:WikiProject_Maps/Conventions so do you want one similar to this one Map of Australia and New Zealand with an inset or something else?
- --always ping me--
Goran tek-en (
talk) 18:11, 30 August 2023 (UTC)
-
Goran tek-en 1) I like the "unclutteredness" (is that a word?) of the Map of Australia and New Zealand with an inset. 2) As for the inset, can you move the north boundary, just a bit to include Melbourne, but yes, having all the islands on coastal Tasmania is the key bit AND getting rid of all of the numbers, names, topographical markings that make it so cluttered.
SusunW (
talk) 18:47, 30 August 2023 (UTC)
- @ SusunW
- Those drafts are PNG versions of the original SVG file I'm working in and will upload to commons.
- Those drafts are shown for proofreading only.
- ----
- A first draft-1. This might not be exactly as you imagined it would look like regarding inset and so and I didn't find all the places so you have to tell me where.
- To me this is more like a base map on which one would add more information regarding travels or what ever you want. If you want more added I would need to know that.
- Remember we can change/edit/remove/add everything we want so check this draft and give me feedback, anything goes.
- I will go away for a week or so now and then you will to, but we continue when we are back. --always ping me--
Goran tek-en (
talk) 15:49, 7 September 2023 (UTC)
-
Goran tek-en sorry, we had a huge storm and lost power for 24 hours. Just got it back and saw this. I think it looks great! Mount Chappel Island is missing a label in the Furneaux group on the western side and about 4 islands north of Preservation Island. I think it is exactly what is needed to give perspective to how far the kidnapped women were moved from their home, but also where the various places they lived were. Much like the Caribbean, of which I am far more familiar, the populations were very fluid between islands. In this case, after 1845, they seemed to live on a different island each year. I appreciate your help so much.
SusunW (
talk) 15:49, 8 September 2023 (UTC)
- @
SusunW Hope you are doing well after the storm,
Draft-2. --always ping me--
Goran tek-en (
talk) 16:54, 17 September 2023 (UTC)
-
Goran tek-en I think it is good to go. I genuinely appreciate your skills and help in creating this visual aid for the article.
SusunW (
talk) 17:07, 17 September 2023 (UTC)
- @
SusunW Then I will need the following;
- Name of the file
- Description (/language)
- Captions/s (/language)
- Category/ies at commons
- Structured data/Items portrayed in this file, the Q#, to be able to upload it at commons, thanks.
- --always ping me--
Goran tek-en (
talk) 13:48, 18 September 2023 (UTC)
-
Goran tek-en For me, those are tough questions, but I'll try. Please feel free to change these any way you think is best.
- 1 Bass Strait / Port Phillip Bay detail
- 2 Bass Strait places associated with the residences of the family of Margery Munro?
- 3 Bass Strait Islands detail
- 4 Louisa Briggs, Maps of islands of Australia, Islands of Tasmania, Bass Strait, Media supported by WikiProject Women in Red - 2023
- 5 Not remotely sure I understand this, but possibly Bass Strait (Q171846), and P Islands of Tasmania, but after 1/2 an hour of searching, I have zero clue how to find a number for a property. WP technology is not my strong suit and WP's search functions are horrible.
- I leave at 4 AM tomorrow and am frantically packing and readying to go. Will try to check back, but it may well be after I return, i.e. on the 27th. SusunW ( talk) 14:49, 18 September 2023 (UTC)
-
Goran tek-en For me, those are tough questions, but I'll try. Please feel free to change these any way you think is best.
- @
SusunW Then I will need the following;
-
Goran tek-en I think it is good to go. I genuinely appreciate your skills and help in creating this visual aid for the article.
SusunW (
talk) 17:07, 17 September 2023 (UTC)
- @
SusunW Hope you are doing well after the storm,
Draft-2. --always ping me--
Goran tek-en (
talk) 16:54, 17 September 2023 (UTC)
-
Goran tek-en sorry, we had a huge storm and lost power for 24 hours. Just got it back and saw this. I think it looks great! Mount Chappel Island is missing a label in the Furneaux group on the western side and about 4 islands north of Preservation Island. I think it is exactly what is needed to give perspective to how far the kidnapped women were moved from their home, but also where the various places they lived were. Much like the Caribbean, of which I am far more familiar, the populations were very fluid between islands. In this case, after 1845, they seemed to live on a different island each year. I appreciate your help so much.
SusunW (
talk) 15:49, 8 September 2023 (UTC)
-
Goran tek-en 1) I like the "unclutteredness" (is that a word?) of the Map of Australia and New Zealand with an inset. 2) As for the inset, can you move the north boundary, just a bit to include Melbourne, but yes, having all the islands on coastal Tasmania is the key bit AND getting rid of all of the numbers, names, topographical markings that make it so cluttered.
SusunW (
talk) 18:47, 30 August 2023 (UTC)
- @
SusunW
- Thank you so much
Goran tek-en. I just don't have the skills for graphics but they are so helpful to give a context for narrative text. It truly takes a village to create articles.
SusunW (
talk) 17:50, 30 August 2023 (UTC)
- @
SusunW I'm just glad if some of my knowledge can do something for you and your excellent work. --always ping me--
Goran tek-en (
talk) 17:46, 30 August 2023 (UTC)
-
Goran tek-en I will be gone from the 19-26 but then back in Mexico (CST). There is no particular hurry, but I think the map it will give excellent context for the very confusing records on
Louisa Briggs. I cannot say how much I appreciate your help. Truly, I am grateful.
SusunW (
talk) 17:39, 30 August 2023 (UTC)
- @
SusunW I will be away for 9-16 of september and I don't put in extremely many hours at commons right now so we will just take the time we need. When will you be back? --always ping me--
Goran tek-en (
talk) 17:34, 30 August 2023 (UTC)
-
Goran tek-en I am so excited! Thank you so much. I'm good until September 19, when I will be traveling abroad for my mom's birthday.
SusunW (
talk) 17:13, 30 August 2023 (UTC)
-
SusunW, I haven't checked everything in detail here but it all seems possible but I will need you to be available thru the process.
SusunW Hope you had a good trip.
I made some changes and if the circa year is not correct we will just change it.
Now you can find it here
Commons:file:Bass Strait Port Phillip Bay detail ca 1890.svg.
- Please check all the information, also links for wikipedia, wikidata and structured data.
- If you are happy with this please put the code
{{re.solved|~~~~}}(without the ".") on this request so it can be archived, thanks. Done
Done
If you need any more graphic work with this or anything else just contact me. --always ping me-- Goran tek-en ( talk) 14:43, 25 September 2023 (UTC)
-
Goran tek-en Thank you so much! Literally just got in last night after 19 hours of traveling. I am so excited to see this. The only difference I note is ca. 1890, but I do not know if that is necessarily an issue, because the map wouldn't have changed. They were kidnapped in 1836 and the last mention of Margery that I found is 1863. All the events took place in the 19th century and those are the names we used. I truly, truly appreciate your work to create a visual for people to see the scope of where they were. (I am working on another project and may contact you about it later, but it's a long-term thing. Been writing it for 3 years and am no where near publishing yet.) {{
resolved}}
- @
SusunW I was unsure about that year but it was what I found on the big map.
- So would it be better to replace it with "19th century"? because then I will change!
- To me the thing about what time the map depicts is that the coastline today is different. --always ping me-- Goran tek-en ( talk) 16:33, 27 September 2023 (UTC)
- @
SusunW I was unsure about that year but it was what I found on the big map.
-
 Flag
Flag -
 Map
Map
.svg)
.svg)
Please create " File:Flag map of Rhodesia and Nyasaland (1953–1963).svg", thank you. ColorfulSmoke ( talk) 10:51, 18 August 2023 (UTC)
Request - Map for the Sherritt-Gordon Mine article
- Article(s)
- Sherritt-Gordon Mine
- Request
- Could anyone make a version of this map for the article? https://www.researchgate.net/figure/Site-map-of-the-former-Sherritt-Gordon-mine-showing-locations-of-the-tailings_fig5_308191101 -- CT55555( talk) 23:51, 20 August 2023 (UTC)
- Discussion
- Hi @ CT55555 copyright-wise, I'm tentative about whether this would be allowed: it's a derivative work of a copyrighted source. Any chance you have the author's permission, etc or another source? – Isochrone ( T) 20:26, 22 August 2023 (UTC)
- I see. Sorry, I am new to this and wasn't thinking about it from that lens. No, I have zero connection to the author. Is it possible to make something sufficiently different, or is this perhaps a non-starter of an idea? CT55555( talk) 20:44, 22 August 2023 (UTC)
Please make easily translatable svg map(s) of Turkish railways
https://static.tcdd.gov.tr/webfiles/userfiles/files/genel/tcddharita.pdf Official Turkish railways map but we don't need so much detail
https://www.tcdd.gov.tr/en/map Another official Turkish railways map but I cannot make it work


- Article(s)
- Rail transport in Turkey
- Request
- Please make an easily translatable svg of the whole network and another of the high speed network (including planned and under construction) based on one or more of the above. Any questions please ask.
Chidgk1 ( talk) 18:05, 22 August 2023 (UTC)
- Discussion
- Hi @ Chidgk1, so are you looking for an SVG version of the first image (in German) you've linked, with translatable text? – Isochrone ( T) 19:51, 22 August 2023 (UTC)
- Thanks for quick reply. So long as it matches the official map in railway lines it does not really matter which one you start from. Please could you add a small type light grey inconspicuous “Source: (url of official map)”. So do you think it is better to have just one svg map with all the lines but with high speed prominent. Or would it be clearer to also have a second map with only high speed? I suspect 2 would be best as there is a separate article
high speed rail in Turkey
Chidgk1 (
talk) 07:16, 23 August 2023 (UTC)
- On second thoughts maybe just one if it will not look too cluttered. So long as the slow lines are far less prominent it should also be OK for the high speed article I guess and might be easier to keep up to date. Your thoughts?
Chidgk1 (
talk) 07:32, 23 August 2023 (UTC)
- Do you think the style should be consistent with File:High Speed Railroad Map of Europe.svg? Chidgk1 ( talk) 07:48, 23 August 2023 (UTC)
- On second thoughts maybe just one if it will not look too cluttered. So long as the slow lines are far less prominent it should also be OK for the high speed article I guess and might be easier to keep up to date. Your thoughts?
Chidgk1 (
talk) 07:32, 23 August 2023 (UTC)
Can someone create a proper map for Sparks Street?
│ │
====│ │
====
==│ │
===== │ │
===   │ │
==
== │ │
=====╰╮  ╰╮
==╭╯ ╭╯
│ │
====│ │
====   │ │
===== │ │
===   │ │      │ │      │   │  │  │
┘ └────┘ └───────┘ └──────┘ └──────┘ └──────┘ └──────┘   ╰--╯ ╭╯
                   Sparks Street                             │
┐ ┌────┐ ┌───────┐ ┌──────┐ ┌──────┐ ┌──────┐ ┌──────────┐  ╭╯
│B│    │L│
==     │
K│
======│
B│
=== │O│      │M│
====      │
E │
│a│    │y│
==     │
e│
======│
a│
=== │C│      │e│
====      │
l │
│y│    │o│       │
n│      │
n│      │o│      │t│          │
g │
│ │    │n│       │
t│      │
k│      │n│      │c│          │
i │
│ │    │ │       │ │      │ │      │n│      │a│          │
n │
│ │    │ │       │ │      │ │      │o│      │l│          │  │
│ │    │ │       │ │      │ │      │r│      │f│          │  │
│ │    │ │       │ │      │ │      │ │      │e│          │  │
- Article(s)
- Sparks Street
- Request
- The box-art map listed is the same one on Sparks Street
- Discussion
Human vulnerability to climate change impacts
- Article(s)
- multiple, such as Climate change vulnerability
- Request
- Can someone please replicate the map here: slide 50 (the slide titled "Human vulnerability to climate change impacts"). The same map can also be found here: page 1052 Thanks! Bogazicili ( talk) 07:26, 26 August 2023 (UTC)
- Discussion
Sar-Dhok location
I am requesting a map that shows the location of Sar-Dhok locality (Lat. 32° 49′ 39″ N: Long. 73° 43′ 51″ E; altitude 805.45 ft) in Pakistan. It is for the article Sivapardus. The color used to mark the location may be any reasonable color so long as it meets the accessibility guidelines, and I have no real opinions on the inclusion of additional borders and labels for districts, etc. Happy editing, SilverTiger12 ( talk) 18:01, 10 October 2023 (UTC)
- {{
Resolved}} –
Isochrone (
T) 18:22, 10 October 2023 (UTC)
- And thank you so much too! Happy editing, SilverTiger12 ( talk) 18:24, 10 October 2023 (UTC)
Request - Orthographic projection map of the United States in 1783
- Article(s)
- 1780s
- Request
- Make an map image, similar to this one, which shows the United States in 1783, and gave it marked in green ( based on the borders in this map ). WikiJunkie ( talk) 22:12, 26 August 2023 (UTC)
- Discussion
- Just highlighting some issues: 1)
This map is unsourced. 2) An orthographic map (such as
this one) will show other countries whose borders need to be properly sourced too.
M.Bitton (
talk) 00:43, 27 August 2023 (UTC)
SVG locator map of Tibet in the gray and green globe scheme
-
 Image currently used on the Tibet article.

![[2]](https://historicalmapchart.net/svg/world-cold-war.svg)
.svg&action=edit&redlink=1)
.svg)
.svg)
- Article(s)
- Tibet
- Request
- Create an SVG locator map of Tibet in the gray and green globe scheme. The
{{
Cleanup images}}
template has been on the Tibet article for over a year, it is about time a better image is created so the template can be removed. -- Treetoes023 ( talk) 11:55, 30 August 2023 (UTC) - Discussion
-
File:Tibet (orthographic projection).svg already exists fwiw. –
Isochrone (
T) 21:16, 30 August 2023 (UTC)
- @ Isochrone: Well yes, but it is inaccurate and treats Tibet as a political entity rather than a cultural area. The map should be like the Kurdistan map you made, in which the area is shown to overlap with political borders. Instead, the map treats Tibet like this map treats Kurdistan, it treats it as if it is a country and gives it an exaggerated area. – Treetoes023 ( talk) 02:00, 31 August 2023 (UTC)
.svg)
.svg)
.png)
SVG locator maps of the Tibetan Plateau in the gray and green globe scheme
- Article(s)
- Tibetan Plateau
- Request
- Create 2 SVG locator maps of the Tibetan Plateau in the gray and green globe scheme, one map with political borders and one map without political borders. -- Treetoes023 ( talk) 12:31, 30 August 2023 (UTC)
- Discussion
- This is a geographic area with no defined borders, and regardless, this is not what orthographic maps are designed for. –
Isochrone (
T) 21:15, 30 August 2023 (UTC)
- @ Isochrone: I disagree, orthographic maps are commonly used to depict geographic landforms, examples being this Arabian Peninsula map and this Sahara and Sahel map. None of those 3 locations depicted in the orthographic maps have defined borders, but they can be approximated with relative accuracy. I see no reason not to have a map, the visualization would be useful, just like it was for the previous examples I have given. – Treetoes023 ( talk) 02:16, 31 August 2023 (UTC)
.svg)
Turkey’s original forest cover

-
Figure 1.2 on page 5
- Article(s)
- Forest in Turkey
- Request
- I think it would be useful for the reader to have a simple map of the original forest cover to empasize the statement in the lead that "4000 years ago most of the country was forested". Figure 1.2 on page 5 of https://www.fao.org/3/CA3505EN/ca3505en.pdf shows original vegetation but I don't mind whether the other vegetation is shown or not. Of course it should be easily translatable for tr:Türkiye'deki ormanlar. I hope this might in a small way encourage reforestation efforts. Apparently the original map is on page 204 of a 1993 coursebook by Altan, T. titled "Türkiye’nin Doğal Bitki Örtüsü" (Turkey's natural vegetation cover) from the Agricultural Faculty of Çukurova Üniversity. I checked https://commons.wikimedia.org/wiki/Category:Agricultural_maps_of_Turkey and https://commons.wikimedia.org/wiki/Category:Vegetation_maps_by_country but I could not find anything suitable. -- Chidgk1 ( talk) 12:56, 30 August 2023 (UTC)
- Discussion
| This page is an archive. Do not edit the contents of this page. Please direct any additional comments to the current main page. |
|
| Archives of 2023: January, February, March, April, May, June, July, August, September, October, November, December |
Zambesia
{{ Resolved}}
- Article(s)
- Zambesia
- Request
- I’ve been researching the movement for Zambesia and thought it’d be nice to have a “standard” Wikipedia map to go along with a future article I plan to make. See the Cape Republic page for the kind of format I’m going for. Thanks for any and all assistance!
-- Pruehito ( talk) 16:17, 10 August 2023 (UTC)
- Discussion
- @ Pruehito hi, do you have a reliable source for the map? The one of the right doesn't have any sources. – Isochrone ( T) 12:30, 11 August 2023 (UTC)
- @
Isochrone
https://unpo.org/article/22010
Pruehito (
talk) 19:56, 11 August 2023 (UTC)
- @ Pruehito please see File:Zambesia location map.svg. I'm happy to implement changes as appropriate. – Isochrone ( T) 14:37, 15 August 2023 (UTC)
Historical conflict map in southern Ukraine
- Article(s)
- Battle of Dibrivka
- Request
- Hello! As part of a GA review, it's been requested that I get a historical conflict map for the Battle of Dibrivka and its aftermath, which took place in southern Ukraine in late 1918. The battle itself was centred on the village of Velykomykhailivka and surrounding Dibrivka forest. The aftermath involved movement through a number of towns in the former Oleksandrivsky uezd of the former Katerynoslav province, including Velykomykhailivka, as well as Harylivka, Ivanivka, Tsarekostyantynivka, Temyrivka and Huliaipole. In the modern day, these towns are found in the Polohy Raion in Zaporizhzhia Oblast and the Synelnykove Raion in Dnipropetrovsk Oblast. If anybody could help put together such maps, I would appreciate it immensely. -- Grnrchst ( talk) 14:42, 2 August 2023 (UTC)
- Discussion
Creation of world map
-
Base image
-
Use
Not the first time I show up with this project here, once again I need some assistance. We all know our SVG blank world map which is used, with some alterations, for choropleth maps. What I am now working are historical world maps, i. e. I track changes in the world map from today back to the past. Current state is 1992, and now I would like to have a first historical SVG blank world map. The data exists as a shapefile within a QGIS project, but I am to much a beginner to be able to export the data on my own in sound way. Is there anyone here who could assist me by that, creating something like a template that enables me to continue on my own?-- Antemister ( talk) 08:30, 4 August 2023 (UTC)
- @
Antemister: Where is the data?
M.Bitton (
talk) 10:35, 4 August 2023 (UTC)
- Have uploaded it now at
[1], the project file consists of two relevant layers, Layer ISO is an ISO 3166 world map as of 2023, based on geoboundaries with some minor alterations, ISO_borderchanges contains all international boundary changes between 1992 and 2022, organized via the temporal controller function. data — MITC_disputed_regions_v2 and Testplatte are working layers, Layer B and C include disputed boundaries and countries, they are not relevant at the moment.--
Antemister (
talk) 11:04, 4 August 2023 (UTC)
- Addition: You might know Historicalmapchart, which already has a similar function but with a lower accuracy of research. Its base map is at
[2], ideally the SVG gets the same structure, so it could be included into that already existing web application.--
Antemister (
talk) 11:17, 4 August 2023 (UTC)
- I'm not exactly sure I understand what you're after. Is it a 1992 world map (i.e., the 2023 map with the "ISO_borderchanges" included)? What web application are you referring to? How is the structure used on Historicalmapchart different from the one used on our SVG blank world map and why does it have to follow that particular structure instead of the one that we are familiar with? Also, it's not clear how the borders of some of the countries that are included in "ISO_borderchanges" have changed (eg. Australia, Namibia, South Africa, etc.). M.Bitton ( talk) 15:34, 4 August 2023 (UTC)
- Addition: You might know Historicalmapchart, which already has a similar function but with a lower accuracy of research. Its base map is at
[2], ideally the SVG gets the same structure, so it could be included into that already existing web application.--
Antemister (
talk) 11:17, 4 August 2023 (UTC)
- Have uploaded it now at
[1], the project file consists of two relevant layers, Layer ISO is an ISO 3166 world map as of 2023, based on geoboundaries with some minor alterations, ISO_borderchanges contains all international boundary changes between 1992 and 2022, organized via the temporal controller function. data — MITC_disputed_regions_v2 and Testplatte are working layers, Layer B and C include disputed boundaries and countries, they are not relevant at the moment.--
Antemister (
talk) 11:04, 4 August 2023 (UTC)
As usual, my explanations arised more questions than it answered, so more in detail step by step:
1) The shapefiles I sent you actually include a political world map for any time between 2023 and 1992. You have to activate Layer ISO and then place ISO_borderchanges on top. The latter includes a polygon for every country whose borders differed between 1992 and 2023 from the today's borders. So, e. g. for Yemen the shape between the 1992 border agreement with Oman and the 2000 border treaty with Saudi Arabia (indicated by the date in the attribute table), the post-2000 border is then current border and thus not part of the ISO_borderchanges layer. By applying the temporal controller you can use the slider to display a world map for any time between (yes, it it works only limited now because I have not added a dummy date if the shape existed before 1992, but it should be sufficient to understand the principle)
2) Look at
[3], i have been in contact with the site maintainer there, and he could add my map as long I provide him an SVG that works with his application.
3) Have a look at source code of linked SVG file, instead of having 70 different maps for each year, there is only one SVG which has a similar structure as my QGIS project. It includes all the different country shapes plus a time range, e. g. "GDR 1949 1989". If you place the slider at, say, 1955, the software takes all shapes whose time range include that year and drop the others. So you have a world map of 1955 (the idea of structuring the QGIS file was of course I derived from this)
4) My research goes far more into detail as it would be necessary if the only aim were such choropleth maps, tracing also minor border changes. Australia incorporate Norfolk Island in 2015, and for South Africa/Namibia it is the transfer of Walvis Bay in 1994, that why these countries are included.
So, ideal solution would be the extraction of an SVG map that has a Wikipedia-style look and a Historicalmapchart-style source code, than I would provide it to Mapchart, he implements it into his application, we take out a map for each year to upload it at Commons for documentary purposes, and for general use Historicalmapchart is applied.
Has my plan become more clear?--
Antemister (
talk) 21:59, 4 August 2023 (UTC)
- Basically, you want to create a map for Historicalmapchart. Is that correct?
M.Bitton (
talk) 09:44, 5 August 2023 (UTC)
- Oh, no, did it make the that impression? The story behind it is long, I started with the research a decade ago, together with a graphist that later lost interest in the topic. About a dozen of maps were made, see
commons:Category:SVG historic world maps (location map scheme), but then the project fell asleep. It had been two quarantines that reactivated it, so I continued research and decided to extend the scope, from an SVG-only world map to GIS model of geopolitical changes in the 20th century. But still the "base maps for choropleth maps in wikipedia" is the central purpose, in combination with a tool to colorize the countries without text editing or Inkscape.
- Actually such a tool exists, a poorly programmed desktop application that was part of a training project some years ago (I am not a programmer). But since then the situation has changed, I don't believe that such a desktop tool is state of the art anymore when Mapchart exists as a sophisticated web application with a compatible licence. Yes, there might be different views on that is my suggestion to get that up und running.
- Does that explanation make my approach more logical?--
Antemister (
talk) 11:29, 5 August 2023 (UTC)
- Yes and the above explanation doesn't change the impression as it simply tells me that you want to create a map that runs on their platform.
M.Bitton (
talk) 11:36, 5 August 2023 (UTC)
- Indeed, the aim is a map that (also) works with that platform, but is that a problem or drawback-- Antemister ( talk) 13:14, 5 August 2023 (UTC)
- Yes and the above explanation doesn't change the impression as it simply tells me that you want to create a map that runs on their platform.
M.Bitton (
talk) 11:36, 5 August 2023 (UTC)
- Oh, no, did it make the that impression? The story behind it is long, I started with the research a decade ago, together with a graphist that later lost interest in the topic. About a dozen of maps were made, see
commons:Category:SVG historic world maps (location map scheme), but then the project fell asleep. It had been two quarantines that reactivated it, so I continued research and decided to extend the scope, from an SVG-only world map to GIS model of geopolitical changes in the 20th century. But still the "base maps for choropleth maps in wikipedia" is the central purpose, in combination with a tool to colorize the countries without text editing or Inkscape.
Port Phillip Bay and Preservation Island
I would like a map that provides context for a historical kidnapping from Port Phillip Bay, Victoria, Australia to Preservation Island, Tasmania and the places the parties lived. All the maps seem very cluttered, so I would like them simplified. Basically, something like this as an example, but only with Australia (no New Zealand) and with the inset bigger than the map of Australia. The inset would show only the Melbourne area to the Furneaux Islands. I know it sounds kind of complicated but basically, I’d like all the clutter removed from this and the inset to show the area between the bottom legend's 144° to 150° and the side legend from 38° to 41°. 1) I'd like the Australian states named, with Victoria bolded. 2) I'd like Melbourne, Point Nepean, the bay, Port Phillip, Arthur's Seat, and Western Port shown. The locations of the last 3 are on this. 3) For the western islands in the Bass Strait, I'd like these shown with Robbins Island highlighted. 4) For the eastern stretch, I'd like this image to show the Furneaux group, with Mount Chappel Island, Little Dog Island, Gun Carriage Island (shown on the map as Vansittart Island), Preservation Island, and Clarke Island highlighted. Is this possible? 17:31, 26 August 2023 (UTC) SusunW ( talk) 17:31, 26 August 2023 (UTC)
- Pinging
Goran tek-en, who made the original inset map to see if he thinks this is possible.
SusunW (
talk) 13:51, 30 August 2023 (UTC)
-
SusunW, I haven't checked everything in detail here but it all seems possible but I will need you to be available thru the process.
Request taken by --always ping me--
Goran tek-en (
talk) 17:11, 30 August 2023 (UTC).
-
Goran tek-en I am so excited! Thank you so much. I'm good until September 19, when I will be traveling abroad for my mom's birthday.
SusunW (
talk) 17:13, 30 August 2023 (UTC)
- @
SusunW I will be away for 9-16 of september and I don't put in extremely many hours at commons right now so we will just take the time we need. When will you be back? --always ping me--
Goran tek-en (
talk) 17:34, 30 August 2023 (UTC)
-
Goran tek-en I will be gone from the 19-26 but then back in Mexico (CST). There is no particular hurry, but I think the map it will give excellent context for the very confusing records on
Louisa Briggs. I cannot say how much I appreciate your help. Truly, I am grateful.
SusunW (
talk) 17:39, 30 August 2023 (UTC)
- @
SusunW I'm just glad if some of my knowledge can do something for you and your excellent work. --always ping me--
Goran tek-en (
talk) 17:46, 30 August 2023 (UTC)
- Thank you so much
Goran tek-en. I just don't have the skills for graphics but they are so helpful to give a context for narrative text. It truly takes a village to create articles.
SusunW (
talk) 17:50, 30 August 2023 (UTC)
- @
SusunW
- So we have to start with establishing of the area of the inset is this red rectangle correct?
- You can have many different types of maps wikipedia:WikiProject_Maps/Conventions so do you want one similar to this one Map of Australia and New Zealand with an inset or something else?
- --always ping me--
Goran tek-en (
talk) 18:11, 30 August 2023 (UTC)
-
Goran tek-en 1) I like the "unclutteredness" (is that a word?) of the Map of Australia and New Zealand with an inset. 2) As for the inset, can you move the north boundary, just a bit to include Melbourne, but yes, having all the islands on coastal Tasmania is the key bit AND getting rid of all of the numbers, names, topographical markings that make it so cluttered.
SusunW (
talk) 18:47, 30 August 2023 (UTC)
- @ SusunW
- Those drafts are PNG versions of the original SVG file I'm working in and will upload to commons.
- Those drafts are shown for proofreading only.
- ----
- A first draft-1. This might not be exactly as you imagined it would look like regarding inset and so and I didn't find all the places so you have to tell me where.
- To me this is more like a base map on which one would add more information regarding travels or what ever you want. If you want more added I would need to know that.
- Remember we can change/edit/remove/add everything we want so check this draft and give me feedback, anything goes.
- I will go away for a week or so now and then you will to, but we continue when we are back. --always ping me--
Goran tek-en (
talk) 15:49, 7 September 2023 (UTC)
-
Goran tek-en sorry, we had a huge storm and lost power for 24 hours. Just got it back and saw this. I think it looks great! Mount Chappel Island is missing a label in the Furneaux group on the western side and about 4 islands north of Preservation Island. I think it is exactly what is needed to give perspective to how far the kidnapped women were moved from their home, but also where the various places they lived were. Much like the Caribbean, of which I am far more familiar, the populations were very fluid between islands. In this case, after 1845, they seemed to live on a different island each year. I appreciate your help so much.
SusunW (
talk) 15:49, 8 September 2023 (UTC)
- @
SusunW Hope you are doing well after the storm,
Draft-2. --always ping me--
Goran tek-en (
talk) 16:54, 17 September 2023 (UTC)
-
Goran tek-en I think it is good to go. I genuinely appreciate your skills and help in creating this visual aid for the article.
SusunW (
talk) 17:07, 17 September 2023 (UTC)
- @
SusunW Then I will need the following;
- Name of the file
- Description (/language)
- Captions/s (/language)
- Category/ies at commons
- Structured data/Items portrayed in this file, the Q#, to be able to upload it at commons, thanks.
- --always ping me--
Goran tek-en (
talk) 13:48, 18 September 2023 (UTC)
-
Goran tek-en For me, those are tough questions, but I'll try. Please feel free to change these any way you think is best.
- 1 Bass Strait / Port Phillip Bay detail
- 2 Bass Strait places associated with the residences of the family of Margery Munro?
- 3 Bass Strait Islands detail
- 4 Louisa Briggs, Maps of islands of Australia, Islands of Tasmania, Bass Strait, Media supported by WikiProject Women in Red - 2023
- 5 Not remotely sure I understand this, but possibly Bass Strait (Q171846), and P Islands of Tasmania, but after 1/2 an hour of searching, I have zero clue how to find a number for a property. WP technology is not my strong suit and WP's search functions are horrible.
- I leave at 4 AM tomorrow and am frantically packing and readying to go. Will try to check back, but it may well be after I return, i.e. on the 27th. SusunW ( talk) 14:49, 18 September 2023 (UTC)
-
Goran tek-en For me, those are tough questions, but I'll try. Please feel free to change these any way you think is best.
- @
SusunW Then I will need the following;
-
Goran tek-en I think it is good to go. I genuinely appreciate your skills and help in creating this visual aid for the article.
SusunW (
talk) 17:07, 17 September 2023 (UTC)
- @
SusunW Hope you are doing well after the storm,
Draft-2. --always ping me--
Goran tek-en (
talk) 16:54, 17 September 2023 (UTC)
-
Goran tek-en sorry, we had a huge storm and lost power for 24 hours. Just got it back and saw this. I think it looks great! Mount Chappel Island is missing a label in the Furneaux group on the western side and about 4 islands north of Preservation Island. I think it is exactly what is needed to give perspective to how far the kidnapped women were moved from their home, but also where the various places they lived were. Much like the Caribbean, of which I am far more familiar, the populations were very fluid between islands. In this case, after 1845, they seemed to live on a different island each year. I appreciate your help so much.
SusunW (
talk) 15:49, 8 September 2023 (UTC)
-
Goran tek-en 1) I like the "unclutteredness" (is that a word?) of the Map of Australia and New Zealand with an inset. 2) As for the inset, can you move the north boundary, just a bit to include Melbourne, but yes, having all the islands on coastal Tasmania is the key bit AND getting rid of all of the numbers, names, topographical markings that make it so cluttered.
SusunW (
talk) 18:47, 30 August 2023 (UTC)
- @
SusunW
- Thank you so much
Goran tek-en. I just don't have the skills for graphics but they are so helpful to give a context for narrative text. It truly takes a village to create articles.
SusunW (
talk) 17:50, 30 August 2023 (UTC)
- @
SusunW I'm just glad if some of my knowledge can do something for you and your excellent work. --always ping me--
Goran tek-en (
talk) 17:46, 30 August 2023 (UTC)
-
Goran tek-en I will be gone from the 19-26 but then back in Mexico (CST). There is no particular hurry, but I think the map it will give excellent context for the very confusing records on
Louisa Briggs. I cannot say how much I appreciate your help. Truly, I am grateful.
SusunW (
talk) 17:39, 30 August 2023 (UTC)
- @
SusunW I will be away for 9-16 of september and I don't put in extremely many hours at commons right now so we will just take the time we need. When will you be back? --always ping me--
Goran tek-en (
talk) 17:34, 30 August 2023 (UTC)
-
Goran tek-en I am so excited! Thank you so much. I'm good until September 19, when I will be traveling abroad for my mom's birthday.
SusunW (
talk) 17:13, 30 August 2023 (UTC)
-
SusunW, I haven't checked everything in detail here but it all seems possible but I will need you to be available thru the process.
SusunW Hope you had a good trip.
I made some changes and if the circa year is not correct we will just change it.
Now you can find it here
Commons:file:Bass Strait Port Phillip Bay detail ca 1890.svg.
- Please check all the information, also links for wikipedia, wikidata and structured data.
- If you are happy with this please put the code
{{re.solved|~~~~}}(without the ".") on this request so it can be archived, thanks. Done
If you need any more graphic work with this or anything else just contact me. --always ping me-- Goran tek-en ( talk) 14:43, 25 September 2023 (UTC)
-
Goran tek-en Thank you so much! Literally just got in last night after 19 hours of traveling. I am so excited to see this. The only difference I note is ca. 1890, but I do not know if that is necessarily an issue, because the map wouldn't have changed. They were kidnapped in 1836 and the last mention of Margery that I found is 1863. All the events took place in the 19th century and those are the names we used. I truly, truly appreciate your work to create a visual for people to see the scope of where they were. (I am working on another project and may contact you about it later, but it's a long-term thing. Been writing it for 3 years and am no where near publishing yet.) {{
resolved}}
- @
SusunW I was unsure about that year but it was what I found on the big map.
- So would it be better to replace it with "19th century"? because then I will change!
- To me the thing about what time the map depicts is that the coastline today is different. --always ping me-- Goran tek-en ( talk) 16:33, 27 September 2023 (UTC)
- @
SusunW I was unsure about that year but it was what I found on the big map.
-
Flag
-
Map
Please create " File:Flag map of Rhodesia and Nyasaland (1953–1963).svg", thank you. ColorfulSmoke ( talk) 10:51, 18 August 2023 (UTC)
Request - Map for the Sherritt-Gordon Mine article
- Article(s)
- Sherritt-Gordon Mine
- Request
- Could anyone make a version of this map for the article? https://www.researchgate.net/figure/Site-map-of-the-former-Sherritt-Gordon-mine-showing-locations-of-the-tailings_fig5_308191101 -- CT55555( talk) 23:51, 20 August 2023 (UTC)
- Discussion
- Hi @ CT55555 copyright-wise, I'm tentative about whether this would be allowed: it's a derivative work of a copyrighted source. Any chance you have the author's permission, etc or another source? – Isochrone ( T) 20:26, 22 August 2023 (UTC)
- I see. Sorry, I am new to this and wasn't thinking about it from that lens. No, I have zero connection to the author. Is it possible to make something sufficiently different, or is this perhaps a non-starter of an idea? CT55555( talk) 20:44, 22 August 2023 (UTC)
Please make easily translatable svg map(s) of Turkish railways
https://static.tcdd.gov.tr/webfiles/userfiles/files/genel/tcddharita.pdf Official Turkish railways map but we don't need so much detail
https://www.tcdd.gov.tr/en/map Another official Turkish railways map but I cannot make it work
- Article(s)
- Rail transport in Turkey
- Request
- Please make an easily translatable svg of the whole network and another of the high speed network (including planned and under construction) based on one or more of the above. Any questions please ask.
Chidgk1 ( talk) 18:05, 22 August 2023 (UTC)
- Discussion
- Hi @ Chidgk1, so are you looking for an SVG version of the first image (in German) you've linked, with translatable text? – Isochrone ( T) 19:51, 22 August 2023 (UTC)
- Thanks for quick reply. So long as it matches the official map in railway lines it does not really matter which one you start from. Please could you add a small type light grey inconspicuous “Source: (url of official map)”. So do you think it is better to have just one svg map with all the lines but with high speed prominent. Or would it be clearer to also have a second map with only high speed? I suspect 2 would be best as there is a separate article
high speed rail in Turkey
Chidgk1 (
talk) 07:16, 23 August 2023 (UTC)
- On second thoughts maybe just one if it will not look too cluttered. So long as the slow lines are far less prominent it should also be OK for the high speed article I guess and might be easier to keep up to date. Your thoughts?
Chidgk1 (
talk) 07:32, 23 August 2023 (UTC)
- Do you think the style should be consistent with File:High Speed Railroad Map of Europe.svg? Chidgk1 ( talk) 07:48, 23 August 2023 (UTC)
- On second thoughts maybe just one if it will not look too cluttered. So long as the slow lines are far less prominent it should also be OK for the high speed article I guess and might be easier to keep up to date. Your thoughts?
Chidgk1 (
talk) 07:32, 23 August 2023 (UTC)
Can someone create a proper map for Sparks Street?
│ │
====│ │
====
==│ │
===== │ │
===   │ │
==
== │ │
=====╰╮  ╰╮
==╭╯ ╭╯
│ │
====│ │
====   │ │
===== │ │
===   │ │      │ │      │   │  │  │
┘ └────┘ └───────┘ └──────┘ └──────┘ └──────┘ └──────┘   ╰--╯ ╭╯
                   Sparks Street                             │
┐ ┌────┐ ┌───────┐ ┌──────┐ ┌──────┐ ┌──────┐ ┌──────────┐  ╭╯
│B│    │L│
==     │
K│
======│
B│
=== │O│      │M│
====      │
E │
│a│    │y│
==     │
e│
======│
a│
=== │C│      │e│
====      │
l │
│y│    │o│       │
n│      │
n│      │o│      │t│          │
g │
│ │    │n│       │
t│      │
k│      │n│      │c│          │
i │
│ │    │ │       │ │      │ │      │n│      │a│          │
n │
│ │    │ │       │ │      │ │      │o│      │l│          │  │
│ │    │ │       │ │      │ │      │r│      │f│          │  │
│ │    │ │       │ │      │ │      │ │      │e│          │  │
- Article(s)
- Sparks Street
- Request
- The box-art map listed is the same one on Sparks Street
- Discussion
Human vulnerability to climate change impacts
- Article(s)
- multiple, such as Climate change vulnerability
- Request
- Can someone please replicate the map here: slide 50 (the slide titled "Human vulnerability to climate change impacts"). The same map can also be found here: page 1052 Thanks! Bogazicili ( talk) 07:26, 26 August 2023 (UTC)
- Discussion
Sar-Dhok location
I am requesting a map that shows the location of Sar-Dhok locality (Lat. 32° 49′ 39″ N: Long. 73° 43′ 51″ E; altitude 805.45 ft) in Pakistan. It is for the article Sivapardus. The color used to mark the location may be any reasonable color so long as it meets the accessibility guidelines, and I have no real opinions on the inclusion of additional borders and labels for districts, etc. Happy editing, SilverTiger12 ( talk) 18:01, 10 October 2023 (UTC)
- {{
Resolved}} –
Isochrone (
T) 18:22, 10 October 2023 (UTC)
- And thank you so much too! Happy editing, SilverTiger12 ( talk) 18:24, 10 October 2023 (UTC)
Request - Orthographic projection map of the United States in 1783
- Article(s)
- 1780s
- Request
- Make an map image, similar to this one, which shows the United States in 1783, and gave it marked in green ( based on the borders in this map ). WikiJunkie ( talk) 22:12, 26 August 2023 (UTC)
- Discussion
- Just highlighting some issues: 1)
This map is unsourced. 2) An orthographic map (such as
this one) will show other countries whose borders need to be properly sourced too.
M.Bitton (
talk) 00:43, 27 August 2023 (UTC)
SVG locator map of Tibet in the gray and green globe scheme
-
Image currently used on the Tibet article.
- Article(s)
- Tibet
- Request
- Create an SVG locator map of Tibet in the gray and green globe scheme. The
{{
Cleanup images}}
template has been on the Tibet article for over a year, it is about time a better image is created so the template can be removed. -- Treetoes023 ( talk) 11:55, 30 August 2023 (UTC) - Discussion
-
File:Tibet (orthographic projection).svg already exists fwiw. –
Isochrone (
T) 21:16, 30 August 2023 (UTC)
- @ Isochrone: Well yes, but it is inaccurate and treats Tibet as a political entity rather than a cultural area. The map should be like the Kurdistan map you made, in which the area is shown to overlap with political borders. Instead, the map treats Tibet like this map treats Kurdistan, it treats it as if it is a country and gives it an exaggerated area. – Treetoes023 ( talk) 02:00, 31 August 2023 (UTC)
SVG locator maps of the Tibetan Plateau in the gray and green globe scheme
- Article(s)
- Tibetan Plateau
- Request
- Create 2 SVG locator maps of the Tibetan Plateau in the gray and green globe scheme, one map with political borders and one map without political borders. -- Treetoes023 ( talk) 12:31, 30 August 2023 (UTC)
- Discussion
- This is a geographic area with no defined borders, and regardless, this is not what orthographic maps are designed for. –
Isochrone (
T) 21:15, 30 August 2023 (UTC)
- @ Isochrone: I disagree, orthographic maps are commonly used to depict geographic landforms, examples being this Arabian Peninsula map and this Sahara and Sahel map. None of those 3 locations depicted in the orthographic maps have defined borders, but they can be approximated with relative accuracy. I see no reason not to have a map, the visualization would be useful, just like it was for the previous examples I have given. – Treetoes023 ( talk) 02:16, 31 August 2023 (UTC)
Turkey’s original forest cover
-
Figure 1.2 on page 5
- Article(s)
- Forest in Turkey
- Request
- I think it would be useful for the reader to have a simple map of the original forest cover to empasize the statement in the lead that "4000 years ago most of the country was forested". Figure 1.2 on page 5 of https://www.fao.org/3/CA3505EN/ca3505en.pdf shows original vegetation but I don't mind whether the other vegetation is shown or not. Of course it should be easily translatable for tr:Türkiye'deki ormanlar. I hope this might in a small way encourage reforestation efforts. Apparently the original map is on page 204 of a 1993 coursebook by Altan, T. titled "Türkiye’nin Doğal Bitki Örtüsü" (Turkey's natural vegetation cover) from the Agricultural Faculty of Çukurova Üniversity. I checked https://commons.wikimedia.org/wiki/Category:Agricultural_maps_of_Turkey and https://commons.wikimedia.org/wiki/Category:Vegetation_maps_by_country but I could not find anything suitable. -- Chidgk1 ( talk) 12:56, 30 August 2023 (UTC)
- Discussion