Western Cape
| |
|---|---|
| Motto: Spes Bona (
Latin: Good Hope) | |
 Map showing the location of the Western Cape in the south-western part of South Africa in red | |
| Coordinates: 34°S 20°E / 34°S 20°E | |
| Country | |
| Established | 27 April 1994 |
| Capital | Cape Town |
| Municipalities | |
| Government | |
| • Type | Parliamentary system |
| • Premier | Alan Winde ( DA) |
| • Legislature | Western Cape Provincial Parliament |
| Area
[1]: 9 | |
| • Total | 129,462 km2 (49,986 sq mi) |
| • Rank | 4th in South Africa |
| Highest elevation | 2,325 m (7,628 ft) |
| Lowest elevation | 0 m (0 ft) |
| Population (2022) | |
| • Total | 7,433,020 |
| • Rank | 3rd in South Africa |
| • Density | 57/km2 (150/sq mi) |
| • Rank | 4th in South Africa |
| Population groups 2022 Census | |
| • Coloured | 42.1% |
| • Black | 38.8% |
| • White | 16.4% |
| • Indian or Asian | 1.1% |
| Languages
[1]: 25 | |
| • Afrikaans | 41.2% |
| • Xhosa | 31.4% |
| • English | 22.0% |
| Time zone | UTC+2 ( SAST) |
| ISO 3166 code | ZA-WC |
| GDP | |
| HDI (2021) | 0.751
[4] high · 1st of 9 |
| Gini (2010) | high |
| Website |
www |

| Xhosa | iNtshona-Koloni |
|---|---|
| Afrikaans | Wes-Kaap |
| Sepedi | Kapa Bodikela |
| Sesotho | Kapa Bophirimela |
| Setswana | Kapa Bophirima |
| Xitsonga | Kapa Vupela-dyambu |
| Venda | Kapa Vhukovhela |
The Western Cape ( Afrikaans: Wes-Kaap [ˈvɛskɑːp]; Xhosa: iNtshona-Koloni) is a province of South Africa, situated on the south-western coast of the country. It is the fourth largest of the nine provinces with an area of 129,449 square kilometres (49,981 sq mi), and the third most populous, with an estimated 7 million inhabitants in 2020. [6] About two-thirds of these inhabitants live in the metropolitan area of Cape Town, which is also the provincial capital. The Western Cape was created in 1994 from part of the former Cape Province. The two largest cities are Cape Town and George.
.svg)
The Western Cape is roughly L-shaped, extending north and east from the Cape of Good Hope, in the southwestern corner of South Africa. It stretches about 400 kilometres (250 mi) northwards along the Atlantic coast and about 500 kilometres (300 mi) eastwards along the South African south coast ( Southern Indian Ocean). It is bordered on the north by the Northern Cape and on the east by the Eastern Cape. The total land area of the province is 129,462 square kilometres (49,986 sq mi), [1]: 9 about 10.6% of the country's total. It is roughly the size of England or the State of Louisiana. Its capital city and largest city is Cape Town, and some other major cities include Stellenbosch, Worcester, Paarl, and George. The Garden Route and the Overberg are popular coastal tourism areas.
The Western Cape is the southernmost region of the African continent with Cape Agulhas as its southernmost point, only 3,800 kilometres (2,400 mi) from the Antarctic coastline. The coastline varies from sandy between capes, to rocky to steep and mountainous in places. The only natural harbour is Saldanha Bay on the west coast, about 140 kilometres (90 mi) north of Cape Town. However a lack of fresh water in the region meant that it has only recently been used as a harbour.[ citation needed] The province's main harbour was built in Table Bay, which in its natural state was fully exposed to the northwesterly storms that bring rain to the province in winter, as well as the almost uninterrupted dry southeasterly winds in summer. But fresh water coming off Table Mountain and Devil's Peak allowed the early European settlers to build Cape Town on the shores of this less than satisfactory anchorage.
The province is topographically exceptionally diverse. Most of the province falls within the Cape Fold Belt, a set of nearly parallel ranges of sandstone folded mountains of Cambrian- Ordovician age (the age of the rocks is from 510 to about 330 million years ago; their folding into mountains occurred about 350 to about 270 million years ago). [7] [8] [9] The height of the mountain peaks in the different ranges varies from 1,000 metres (3,300 ft) to 2,300 metres (7,500 ft). The valleys between ranges are generally very fertile, as they contain the weathered loamy soils of the Bokkeveld mudstones (see the diagrams below). [8]
The far interior forms part of the Karoo. This region of the province is generally arid and hilly, with a prominent escarpment that runs close to the Province's most inland boundary.
-
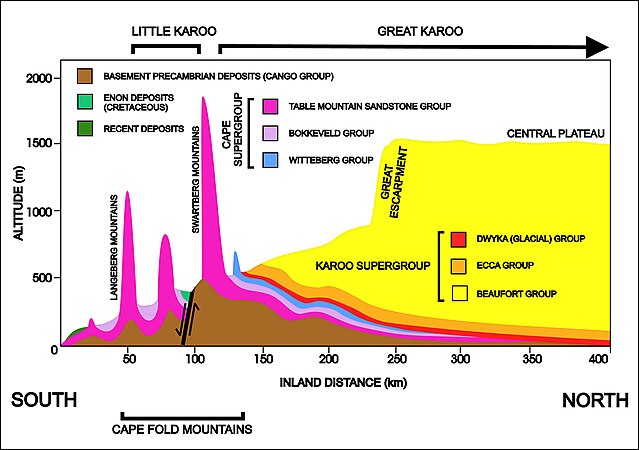 A diagrammatic 400 km south–north crosssection through the Cape at approximately 21° 30' E (i.e. near Calitzdorp in the Little Karoo), showing the relationship between the Cape Fold Mountains (and their geological structure) and the geology of the Little and Great Karoo, as well as the position of the Great Escarpment. The colour code for the geological layers is the same as those used in the diagram above. The heavy black line flanked by opposing arrows is the fault that runs for nearly 300 km along the southern edge of the Swartberg Mountains. The Swartberg Mountain range owes some of its great height to upliftment along this fault line. The subsurface structures are not to scale.

The escarpment marks the southwestern edge of South Africa's central plateau (see the middle and bottom diagrams on the left). [8] [10] It runs parallel to the entire South African coastline, except in the very far northeast, where it is interrupted by the Limpopo River valley, and in the far northwest, where it is interrupted by the Orange River valley. The 1,000-kilometre-long (620 mi) northeastern stretch of the escarpment is called the Drakensberg, which is geographically and geologically quite distinct from the Cape Fold Mountains, which originated much earlier and totally independently of the origin of the escarpment. [8] [9] [11] [12]
The principal rivers of the province are the Berg and Olifants which drain into the Atlantic Ocean, and the Breede and Gourits which drain into the Indian Ocean.


The vegetation of the region is also extremely diverse, with one of the world's seven floral kingdoms almost exclusively endemic to the province, namely the Cape Floral Kingdom, most of which is covered by Fynbos (from the Afrikaans meaning "Fine Bush" (Dutch: Fijnbosch), though precisely how it came to be referred to as such, is uncertain.). [13] [14] These evergreen heathlands are extremely rich in species diversity, [13] [14] with at least as many plant species occurring on Table Mountain as in the entire United Kingdom. [14] It is characterised by various types of shrubs, thousands of herbaceous flowering plant species and some grasses. [13] With the exception of the Silver tree, Leucadendron argenteum, which only grows on the granite and clay soils of the Cape Peninsula, [15] open fynbos is generally treeless except in the wetter mountain ravines where patches of Afromontane forest persist. [13] [14]
The arid interior is dominated by Karoo drought-resistant shrubbery.[ citation needed] The West Coast and Little Karoo are semi-arid regions and are typified by many species of succulents and drought-resistant shrubs and acacia trees. The Garden Route on the south coast (between the Outeniqua Mountains and the Southern Indian Ocean) is extremely lush, with temperate rainforest (or Afromontane Forest) covering many areas adjacent to the coast, in the deep river valleys and along the southern slopes of the Outeniqua mountain range.[ citation needed] Typical species are hardwoods of exceptional height, such as Yellowwood, Stinkwood and Ironwood trees.
The Western Cape is climatologically diverse, with many distinct micro- and macroclimates created by the varied topography and the influence of the surrounding ocean currents. These are the warm Agulhas Current which flows southwards along South Africa's east coast, and the cold Benguela Current which is an upwelling current from the depths of the South Atlantic Ocean along South Africa's west coast. [16] [17] Thus climatic statistics can vary greatly over short distances. Most of the province is considered to have a Mediterranean climate with cool, wet winters and warm, dry summers. Both the Great Karoo and Little Karoo, in the interior, have an arid to semi-arid climate with cold, frosty winters and hot summers with occasional thunderstorms. The Garden Route and the Overberg on the south coast have a maritime climate with cool, moist winters and mild, moist summers. Mossel Bay in the Garden Route is considered[ by whom?] to have the second mildest climate worldwide after Hawaii.[ citation needed] The La Niña phase of the El Niño-Southern Oscillation cycle tends to increase rainfall in this region in the dry season (November to April). [18]
The effects of El Niño on rainfall in southern Africa differ between the summer and winter rainfall areas. Winter rainfall areas tend to get higher rainfall than normal and summer rainfall areas tend to get less rain. The effect on the summer rainfall areas is stronger and has led to severe drought in strong El Niño events. [19] [20]
Sea surface temperatures off the west and south coasts of South Africa are affected by ENSO via changes in surface wind strength. [21] During El Niño the south-easterly winds driving upwelling are weaker which results in warmer coastal waters than normal, while during La Niña the same winds are stronger and cause colder coastal waters. These effects on the winds are part of large scale influences on the tropical Atlantic and the South Atlantic High-pressure system, and changes to the pattern of westerly winds further south. There are other influences not known to be related to ENSO of similar importance. Some ENSO events do not lead to the expected changes. [21]
Thunderstorms are generally rare in the province (except in the Karoo) with most precipitation being of a frontal or orographic nature. Extremes of heat and cold are common inland, but rare near the coast. Snow is a common winter occurrence on the Western Cape Mountains occasionally reaching down into the more inland valleys. Otherwise, frost is relatively rare in coastal areas and many of the heavily cultivated valleys.
| Climate data for Cape Town International Airport, elevation: 42m, normals for 1991-2020 | |||||||||||||
|---|---|---|---|---|---|---|---|---|---|---|---|---|---|
| Month | Jan | Feb | Mar | Apr | May | Jun | Jul | Aug | Sep | Oct | Nov | Dec | Year |
| Mean daily maximum °C (°F) | 27.0 (80.6) |
27.3 (81.1) |
26.0 (78.8) |
23.6 (74.5) |
20.6 (69.1) |
18.2 (64.8) |
17.9 (64.2) |
18.0 (64.4) |
19.6 (67.3) |
22.2 (72.0) |
23.7 (74.7) |
25.8 (78.4) |
22.5 (72.5) |
| Daily mean °C (°F) | 21.8 (71.2) |
21.9 (71.4) |
20.5 (68.9) |
17.9 (64.2) |
15.4 (59.7) |
13.2 (55.8) |
12.7 (54.9) |
13.0 (55.4) |
14.5 (58.1) |
15.9 (60.6) |
18.6 (65.5) |
20.7 (69.3) |
17.2 (62.9) |
| Mean daily minimum °C (°F) | 16.6 (61.9) |
16.5 (61.7) |
15.0 (59.0) |
12.2 (54.0) |
10.2 (50.4) |
8.1 (46.6) |
7.4 (45.3) |
7.9 (46.2) |
9.4 (48.9) |
11.5 (52.7) |
13.4 (56.1) |
15.6 (60.1) |
12.0 (53.6) |
| Average precipitation mm (inches) | 9.4 (0.37) |
9.6 (0.38) |
12.5 (0.49) |
40.1 (1.58) |
61.1 (2.41) |
92.3 (3.63) |
84.8 (3.34) |
72.4 (2.85) |
44.3 (1.74) |
28.4 (1.12) |
24.3 (0.96) |
12.8 (0.50) |
492 (19.37) |
| Average precipitation days (≥ 1.0 mm) | 1.8 | 1.8 | 2.5 | 5.0 | 7.4 | 10.1 | 9.1 | 9.3 | 6.8 | 4.2 | 4 | 2.6 | 64.6 |
| Mean monthly sunshine hours | 352.3 | 304 | 289.7 | 240.1 | 196.7 | 175.9 | 197 | 206.2 | 228.4 | 283.5 | 302.8 | 338.4 | 3,115 |
| Source: NOAA [22] | |||||||||||||
| George, Garden Route | ||||||||||||||||||||||||||||||||||||||||||||||||||||||||||||
|---|---|---|---|---|---|---|---|---|---|---|---|---|---|---|---|---|---|---|---|---|---|---|---|---|---|---|---|---|---|---|---|---|---|---|---|---|---|---|---|---|---|---|---|---|---|---|---|---|---|---|---|---|---|---|---|---|---|---|---|---|
| Climate chart ( explanation) | ||||||||||||||||||||||||||||||||||||||||||||||||||||||||||||
| ||||||||||||||||||||||||||||||||||||||||||||||||||||||||||||
| ||||||||||||||||||||||||||||||||||||||||||||||||||||||||||||
| Saldanha, West Coast | ||||||||||||||||||||||||||||||||||||||||||||||||||||||||||||
|---|---|---|---|---|---|---|---|---|---|---|---|---|---|---|---|---|---|---|---|---|---|---|---|---|---|---|---|---|---|---|---|---|---|---|---|---|---|---|---|---|---|---|---|---|---|---|---|---|---|---|---|---|---|---|---|---|---|---|---|---|
| Climate chart ( explanation) | ||||||||||||||||||||||||||||||||||||||||||||||||||||||||||||
| ||||||||||||||||||||||||||||||||||||||||||||||||||||||||||||
| ||||||||||||||||||||||||||||||||||||||||||||||||||||||||||||
| This article is part of a series on the |
|
Politics of the Western Cape |
|---|
The Cape has had a long tradition of holding liberal values. [25] For example, the Cape Qualified Franchise before the Union of South Africa.
The Cape Qualified Franchise was the system of non-racial franchise that was adhered to in the Cape Colony, and in the Cape Province in the early years of the Union of South Africa. Qualifications for the right to vote at parliamentary elections were applied equally to all men, regardless of race.
This local system of multi-racial suffrage was later gradually restricted, and eventually abolished, under various National Party and United Party governments. In 1930 white women were enfranchised, and in 1931 property qualifications for white voters were removed. In 1936 black voters were then removed from the common voters' rolls and allowed only to elect separate members in 1936, and subsequently denied all representation in the House of Assembly in 1960. Coloured voters similarly followed in 1958 and 1970, respectively.
The Black Consciousness Movement (BCM) was a grassroots anti-Apartheid activist movement that emerged in South Africa in the mid-1960s out of the political vacuum created by the jailing and banning of the African National Congress and Pan Africanist Congress leadership after the Sharpeville Massacre in 1960. The BCM represented a social movement for political consciousness. [26]
In December 1968, the South African Student Organization (SASO) was formed at a conference held in Marianhill, Natal. The conference was exclusively attended by Black students. After its launch, SASO became the medium through which black consciousness ideology spread to schools and other university campuses across the country. [27]
In 1974, South African Minister of Bantu Education and Development MC Botha, constituted the imposition of using Afrikaans as a medium of instruction in black schools, effective with students in Grade 7 (Standard 5) upwards. [28] As early as March 1976, students began passive resistance against Afrikaans, fueling the outbreak of the Soweto Uprising on 16 June 1976. Consequently, the student protests spread to other parts of the country, and Cape Town became a pivotal site for Western Cape student revolt. [29]
Student leaders at the University of the Western Cape (UWC) and the University of Cape Town (UCT) organised marches. Poster parades by UWC and Black Power Salute marches by UCT was broken by the police, resulting in 73 students getting arrested and detained at Victor Verster Prison, near Paarl.[ citation needed]
On 1 September 1976, the unrest spread to the city of Cape Town itself. Approximately 2000 black students from Western Cape townships, namely Langa, Nyanga and Gugulethu, matched the Cape Town central business district (CBD). Coloured students also contributed to the protests by peacefully marching to the city, but were blockaded by the police in the CBD. The protests turned violent when coloured students started burning schools, libraries and a magistrate's court in support of the student revolt. Thereafter, 200,000 coloured workers partook in a two-day strike staying away from work in the Cape Town area.[ citation needed]
According to a report by the Truth and Reconciliation Commission (TRC), the Western Cape experienced the second highest number of deaths and casualties associated with the 1976 uprising protests. [30]
In 1994, at the introduction of the Interim Constitution and the first non-racial election, South Africa's original provinces and bantustans were abolished and nine new provinces were established. The former Cape Province was divided into the Western Cape, Northern Cape, Eastern Cape and part of North West.
In the 1994 election, the Western Cape was one of two provinces that did not elect an African National Congress (ANC) provincial government (the other being KwaZulu-Natal). The National Party (NP) won 53% of the votes and 23 seats in the 42-seat provincial legislature, and Hernus Kriel, a former Minister of Law and Order, was elected Premier. He resigned in 1998 and was replaced by Gerald Morkel.
The 1999 election marked the beginning of a period of great turbulence in Western Cape politics. No party achieved an absolute majority in the provincial parliament, as the ANC won 18 seats while the New National Party (NNP), successor to the NP, won 17. The NNP went into coalition with the Democratic Party (DP), which won 5 seats, to form a government, and Morkel remained Premier. In 2000 the DP and the NNP formalised their coalition by forming the Democratic Alliance (DA).
In 2001, however, the NNP broke with the DA over the removal of Peter Marais from office as Mayor of Cape Town by DA leader Tony Leon. The NNP instead went into coalition with the ANC; Gerald Morkel, who was opposed to the split, resigned as Premier and was replaced by Peter Marais. In 2002 Marais resigned as Premier due to a sexual harassment scandal, and was replaced by NNP leader Marthinus van Schalkwyk. During the 2003 floor-crossing period four members of the provincial parliament crossed to the ANC, giving it an absolute majority of 22 seats in the 42-seat house. However, the ANC remained in coalition with the NNP and van Schalkwyk remained as Premier.
In the 2004 election, there was again no absolute winner in the provincial parliament; this time the ANC won 19 seats, the DA won 12, and the NNP won 5. The ANC-NNP coalition continued in power, but van Schalkwyk took up a ministerial post in the national cabinet and was replaced as Premier by the ANC's Ebrahim Rasool. The NNP was finally dissolved after the 2005 floor-crossing period and its members joined the ANC, again giving that party an absolute majority of 24 seats. In the 2007 floor-crossing period the ANC gained a further three members of the provincial parliament. In 2008 Rasool resigned as Premier due to internal party politics, and was replaced by Lynne Brown.
The 2009 election marked a significant change in Western Cape politics, as the Democratic Alliance won 51% of the votes and an absolute majority of 22 seats in the provincial parliament, while the ANC won 14 seats with 31% of the vote. The DA leader Helen Zille was elected Premier. In 2010 the Independent Democrats, which had won 3 seats with 5% of the vote, merged with the DA. In the 2014 election the DA won 59% of the votes and an absolute majority of 26 seats in the provincial parliament, while the ANC won 14 seats with 32% of the vote. In 2018 King Khoebaha Cornelius III Declared the independence of the "Sovereign State of Good Hope". [31] [32]
In the 2019 election, the DA retained their majority in the province, but with a reduction in support. It had won 24 seats with 55%. Helen Zille was term-limited and the DA premier candidate Alan Winde succeeded her. The ANC also lost support. It had received 12 seats with 28% support, its lowest showing since 1994. Veteran politician Peter Marais returned to the provincial parliament as the sole representative of the Freedom Front Plus. Patricia de Lille formed another party, Good, and it achieved a seat. [33]
The DA continued to win a majority of the votes in the 2021 municipal elections, receiving 54% of the vote province-wide, with support in Cape Town at 58%. [34]
Since the late 2000s there has been growing support for Western Cape, or Greater Cape, independence from South Africa.[ citation needed] Political parties such as the Referendum Party, Freedom Front Plus and organisations such as the Cape Independence Advocacy Group [35] and CapeXit, [36] wish to bring forth the constitutional and peaceful secession of the Western Cape. [37] [38] [39]
Proponents claim substantial support for the idea, with CapeXit having over 800,000 signed mandates in May 2021. Additionally, a poll conducted in 2023 by Victory Research on behalf of the Cape Independence Advocacy Group claimed that 58% of the Western Cape's registered voters would support independence, while 68% would support a referendum on the issue. [40]

The provincial government is established under the Constitution of the Western Cape, which was adopted in 1998. The people of the province elect the 42-member Western Cape Provincial Parliament every five years by a system of party-list proportional representation. The fifth provincial parliament was elected in the election of 8 May 2019; 24 seats are held by the Democratic Alliance, 12 by the African National Congress, 2 by the Economic Freedom Fighters, and 1 each by Good, the African Christian Democratic Party, Al Jama-ah, and the Freedom Front Plus. The provincial parliament is responsible for legislating within its responsibilities as set out by the national constitution; these responsibilities include agriculture, education, environment, health services, housing, language policies, tourism, trade, and welfare.
The provincial parliament also elects the Premier of the Western Cape to lead the provincial executive. Since 2019 the Premiership has been held by Alan Winde, former Provincial Minister of Community Safety. The Premier appoints ten members of the provincial legislature to serve as a cabinet of ministers, overseeing the departments of the provincial government. These departments are Agriculture, Community Safety, Cultural Affairs and Sport, Economic Development and Tourism, Education, Environmental Affairs and Development Planning, Health, Human Settlements, Local Government, Social Development, Transport and Public Works, and the Provincial Treasury.
The Western Cape Province is divided into one metropolitan municipality and five district municipalities. The district municipalities are in turn divided into 24 local municipalities.
In the following interactive map, the district and metropolitan municipalities are labelled in capital letters and shaded in various different colours. Clicking on the district on the map loads the appropriate article:
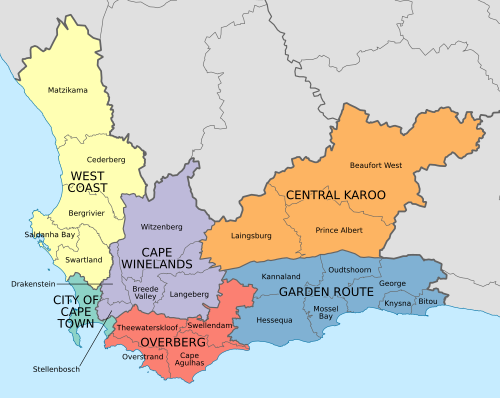
| Name | Code | Seat | Area (km2) [41] |
Population (2016) [42] |
Pop. density (per km2) | |
|---|---|---|---|---|---|---|
| Cape Winelands District Municipality | DC2 | Worcester | 21,473 | 866,001 | 40.3 | |
| Central Karoo District Municipality | DC5 | Beaufort West | 38,854 | 74,247 | 1.9 | |
| City of Cape Town Metropolitan Municipality | CPT | Cape Town | 2,446 | 4,005,016 | 1,637.6 | |
| Garden Route District Municipality | DC4 | George | 23,331 | 611,278 | 26.2 | |
| Overberg District Municipality | DC3 | Bredasdorp | 12,239 | 286,786 | 23.4 | |
| West Coast District Municipality | DC1 | Moorreesburg | 31,119 | 436,403 | 14.0 |
| Name | Code | District | Seat | Area (km2) [41] |
Population (2016) [42] |
Pop. density (per km2) | |
|---|---|---|---|---|---|---|---|
| Beaufort West Local Municipality | WC053 | Central Karoo | Beaufort West | 21,917 | 51,080 | 2.3 | |
| Bergrivier Local Municipality | WC013 | West Coast | Piketberg | 4,407 | 67,474 | 15.3 | |
| Bitou Local Municipality | WC047 | Garden Route | Plettenberg Bay | 992 | 59,157 | 59.6 | |
| Breede Valley Local Municipality | WC025 | Cape Winelands | Worcester | 3,834 | 176,578 | 46.1 | |
| Cape Agulhas Local Municipality | WC033 | Overberg | Bredasdorp | 3,471 | 36,000 | 10.4 | |
| Cederberg Local Municipality | WC012 | West Coast | Clanwilliam | 8,007 | 52,949 | 6.6 | |
| City of Cape Town Metropolitan Municipality | CPT | Cape Town | 2,446 | 4,005,016 | 1,637.6 | ||
| Drakenstein Local Municipality | WC023 | Cape Winelands | Paarl | 1,538 | 280,195 | 182.2 | |
| George Local Municipality | WC044 | Garden Route | George | 5,191 | 208,237 | 40.1 | |
| Hessequa Local Municipality | WC042 | Garden Route | Riversdale | 5,733 | 54,237 | 9.5 | |
| Kannaland Local Municipality | WC041 | Garden Route | Ladismith | 4,765 | 24,168 | 5.1 | |
| Knysna Local Municipality | WC048 | Garden Route | Knysna | 1,109 | 73,835 | 66.6 | |
| Laingsburg Local Municipality | WC051 | Central Karoo | Laingsburg | 8,784 | 8,895 | 1.0 | |
| Langeberg Local Municipality | WC026 | Cape Winelands | Ashton | 4,518 | 105,483 | 23.3 | |
| Matzikama Local Municipality | WC011 | West Coast | Vredendal | 12,981 | 71,045 | 5.5 | |
| Mossel Bay Local Municipality | WC043 | Garden Route | Mossel Bay | 2,001 | 94,135 | 47.0 | |
| Oudtshoorn Local Municipality | WC045 | Garden Route | Oudtshoorn | 3,540 | 97,509 | 27.5 | |
| Overstrand Local Municipality | WC032 | Overberg | Hermanus | 1,675 | 93,407 | 55.8 | |
| Prince Albert Local Municipality | WC052 | Central Karoo | Prince Albert | 8,153 | 14,272 | 1.8 | |
| Saldanha Bay Local Municipality | WC014 | West Coast | Vredenburg | 2,015 | 111,173 | 55.2 | |
| Stellenbosch Local Municipality | WC024 | Cape Winelands | Stellenbosch | 831 | 173,197 | 208.4 | |
| Swartland Local Municipality | WC015 | West Coast | Malmesbury | 3,707 | 133,762 | 36.1 | |
| Swellendam Local Municipality | WC034 | Overberg | Swellendam | 3,835 | 40,211 | 10.5 | |
| Theewaterskloof Local Municipality | WC031 | Overberg | Caledon | 3,259 | 117,167 | 36.0 | |
| Witzenberg Local Municipality | WC022 | Cape Winelands | Ceres | 10,753 | 130,548 | 12.1 |

The Western Cape's total GDP for 2008 was R268bn, 14% of the country's total GDP, and R97,664 per capita. [43] Provincially, it is the third highest contributor to the country's GDP behind Gauteng and KwaZulu-Natal. It also has one of the fastest growing economies in the country, growing at 4% in 2008. [44] At 19.3% the province has a lower unemployment rate than the national average standing at 20% in 2018. [45] The Western Cape's Human Development Index is the highest in South Africa at 0.741 compared to the South African average of 0.705 in 2018. [46]
The biggest sector in the Western Cape's economy is the financial, business services and real estate sectors contributing approximately R77 billion in 2008. Manufacturing was the second largest contributor valued at R43.7 billion in 2008 with the agricultural sector being the fastest growing at 10.6% in the same year. [44] High-tech industries, international call centres, fashion design, advertising and TV production are niche industries rapidly gaining in importance. [47]
The city of Cape Town accounts for roughly 80% of the Western Cape's GDP. [48]
95% of wine produced in South Africa is produced in the Western Cape. South Africa is the 7th largest wine producing region in the world. [49]


The Western Cape has an excellent network of highways comparable with any first-world country. The primary highways are the N1 (from Cape Town to Three Sisters, continuing outside the province towards Bloemfontein and Johannesburg), N2 (from Cape Town to Bloukrans River, towards Port Elizabeth), N7 (from Cape Town to Bitterfontein, continuing towards Springbok and Namibia), N9 (from George to Uniondale, continuing towards Graaff-Reinet and Colesberg) and N12 (from George to Three Sisters, continuing towards Kimberley and Johannesburg). Other routes are the "R" roads which connect the smaller towns. All major roads are tarred with major rural gravel roads well maintained. Limited access motorways are limited to the Cape Metropolitan Area, Winelands and Garden Route, however due to the low population density of the remainder of the province, the highways remain efficient and high-speed, except during peak holiday travel seasons, when travel can be slow-going in places due to heavy traffic. [ citation needed]


The 2022 South African census recorded the population of the Western Cape as 7,433,020 people living in 2,264,032 households. [50] As the province covers an area of 129,462 square kilometres (49,986 sq mi), [1]: 9 the population density was 45.0 inhabitants per square kilometre (117/sq mi) and the household density 12.6 per square kilometre (33/sq mi).
The age distribution of the province was as follows: 25.1% were under the age of 15, 18.3% from 15 to 24, 32.7% from 25 to 44, 18.0% from 45 to 64, and 5.9% who are 65 years of age or older. [1]: 28 The median age is 28 years. [51]: 20 For every 100 women there are 96 men. [51]: 18
In the 2022 Census, 42% of the people of the Western Cape described themselves as " Coloured", while 39% described themselves as " Black African", 16% as " White", and 1% as " Indian or Asian [52]". [1]: 21 Afrikaans is the first language of 41% of the province's population, IsiXhosa of 31%, and English of 22%. [1]: 25
There were 260,952 people in the province who had been born outside of South Africa, comprising 4% of the population. In 2011, 894,289 residents of the Western Cape had been born in the Eastern Cape (16% of the population), 167,524 in Gauteng (3%) and 61,945 (1%) in KwaZulu-Natal. [53] Between 2001 and 2007 the Western Cape received the second-most internal migration within South Africa after Gauteng, with a large majority of these new Western Cape residents coming from the former Transkei region of the Eastern Cape, which served as the historic native reserve of the Cape Colony and the political banishment site for native "troublemakers". [54]
90% of households in the province have a flush toilet [1]: 84 and 90% have refuse removed by the local council at least once a week. [1]: 96 75% of households have piped tap water inside the dwelling, while a further 13% have piped water on their property; 11% receive piped water at a community tap, while 1% have no access to piped water. [1]: 77 One in seven people live in an informal dwelling. [53] 86.9% of households use electricity for cooking, [1]: 84 and 93% use it for lighting. [1]: 93 89% of households have a cellphone and 31% have a landline telephone, while 86% own a television, 81% own a refrigerator, and 34% own a computer. [1]: 99 44% of households have access to the Internet. [1]: 101

The average annual household income was R143,460, the second-highest in the country after Gauteng. [51]: 37 As of September 2012 [update], 69% of the population aged 15–64 are economically active, and of these 25% are unemployed. Overall, 52% of the working-age population are employed. [55] Around 2 million people in the Western Cape labour market (those aged 16 to 64) are employed, 1.3 million are not economically active, 552,733 are unemployed with an additional 122,753 who are discouraged work seekers who want to work but have given up looking for it. [53]
2.7% of residents aged 20 and over have received no schooling, 10.7% have had only some primary, 5.6% have completed primary school but gone no further, 38% have had some secondary education without finishing Grade 12, 28% have finished Grade 12 but gone no further, and 14% have higher education beyond the secondary level. Overall, 43% of residents have completed high school. [1]: 49


The Western Cape province has the most highly educated residents with a very skilled workforce in comparison to any other African region. [56] The high school graduation rate is consistently around 80%, higher than any other province. The proportion of adults with a degree or higher was 4.8% (2005), [47] the highest in the country.
The province also boasts four universities:
- Cape Peninsula University of Technology
- Stellenbosch University
- University of Cape Town
- University of the Western Cape
The province is also home to the South African Military Academy.
Types of cuisine originating from the Western Cape include Dutch and Malay cuisines. Other types of South African cuisine are also found and commonly enjoyed in the province. Over 50% of all cheese in South Africa is produced in the Western Cape. [57] Four of the top ten entries in Trip Advisor's Best Fine Dining Restaurants – Africa list for 2021 are in the Western Cape. [58]
The Western Cape is known for its wine production and vineyards. [59] The winelands are divided into six main regions: Boberg, Breede River Valley, Cape South Coast, Coastal Region, Klein Karoo and Olifants River. Each has unique climate, topography and fertile soil. Distilled wine or brandy is produced in the Cape Winelands, Overberg, and Garden Route districts of the province. [60] Brandy from these regions is regarded as amongst the best in the world due to the high, legally-enforced distilling standards in the region, technically making it equivalent to Cognac. [61] [62]
- ^ a b c d e f g h i j k l m n o p Census 2011: Census in brief (PDF). Pretoria: Statistics South Africa. 2012. ISBN 9780621413885.
- ^ Census 2022:Statistical Release. Pretoria: Statistics South Africa. 2022.
- ^ "Provincial gross domestic product:experimental estimates, 2013–2022" (PDF), www.statssa.gov.za
- ^ "Sub-national HDI – Area Database – Global Data Lab". hdi.globaldatalab.org. Retrieved 15 May 2024.
- ^ "Regional Development Profile City of Cape Town" (PDF). Western Cape Government. 2011. Retrieved 18 September 2015.
- ^ Statistics South Africa, 2020. Mid- year population estimates. Available: http://www.statssa.gov.za/publications/P0302/P03022020.pdf
- ^ Compton, J. S. (2004). The Rocks and Mountains of Cape Town. pp. 24-26, 44–70. Double Storey Books, Cape Town.
- ^ a b c d McCarthy, T., Rubridge, B. (2005). The Story of Earth and Life. pp. 188–195, 262–266. Struik Publishers, Cape Town.
- ^ a b Truswell, J.F. (1977). The Geological Evolution of South Africa. pp. 93–96, 114–159. Purnell, Cape Town.
- ^ Atlas of Southern Africa. (1984). p. 13. Reader's Digest Association, Cape Town
- ^ McCarthy, T.S. (2013) The Okavango delta and its place in the geomorphological evolution of Southern Africa. South African Journal of Geology 116: 1–54.
- ^ Norman, n. & Whitfield, G. (2006). Geological Journeys. p.290-300. Struik Publishers, Cape Town.
- ^ a b c d Manning, John (2007). "The World of Fynbos". Field Guide to Fynbos. Cape Town: Struik Publishers. pp. 8–23. ISBN 9781770072657.
- ^ a b c d Trinder-Smith, Terry (2006). "Introduction". Wild Flowers of the Table Mountain National Park. Cape Town: Botanical Society of South Africa. pp. 19–35. ISBN 1874999600.
- ^ Manning, John (2007). "Cone Bush, Tolbos". Field Guide to Fynbos. Cape Town: Struik Publishers. p. 258. ISBN 9781770072657.
- ^ Branch, M & Branch G. (1981). The Living Shores of Southern Africa. pp. 14–18. Struik Publishers, Cape Town.
- ^ Tyson, P.D., Preston-Whyte, R.A. (2000) The Weather and Climate of Southern Africa. pp. 221–223. Oxford University Press, Cape Town
- ^ Carlowicz, Michael (1 December 2021). "La Niña Returns for a Second Winter". earthobservatory.nasa.gov. Retrieved 16 December 2021.
- ^ "Southern Africa: El Niño, Positive Indian Ocean Dipole Forecast and Humanitarian Impact (October 2023)". reliefweb.int. OCHA. 16 October 2023. Retrieved 20 January 2024.
- ^ Brugnara, Yuri; Brönnimann, Stefan; Grab, Stefan; Steinkopf, Jessica; Burgdorf, Angela-Maria; Wilkinson, Clive; Allan, Rob (October 2023). "South African extreme weather during the 1877–1878 El Niño". Weather. 78 (10): 286–293. Bibcode: 2023Wthr...78..286B. doi: 10.1002/wea.4468.
- ^ a b Nhesvure, B. (2020). Impacts of ENSO on coastal South African sea surface temperatures. Faculty of Science, Department of Oceanography. Retrieved from http://hdl.handle.net/11427/32954/
-
^
"World Meteorological Organization Climate Normals for 1991-2020: Cape Town International Airport-68816" (XLS). ncei.noaa.gov (Excel).
National Oceanic and Atmosoheric Administration. Retrieved 29 February 2024.
{{
cite web}}
: CS1 maint: postscript ( link) - ^ "Climate George". Climate-Data.org. Retrieved 4 November 2021.
- ^ "Climate Saldanha". Climate-Data.org. Retrieved 4 November 2021.
- ^ J. Lewis: The Rise and Fall of the South African Peasantry: A Critique and Reassessment. Journal of Southern African Studies, XI, 1. 1984.
- ^ "The Ideology of the Black Consciousness Movement". South African History Online. Retrieved 6 September 2019.
- ^ "Black Consciousness and Student Revolt in the Cape". South African History Online. Retrieved 16 June 2014.
- ^ "The Afrikaans Medium Decree". ThoughtCo. Retrieved 6 September 2019.
- ^ "African South Africans' June 16th 1976 Revolt—Sad Times, Bad Times—A Luta Kontinua! AMANDLA! POWER!". Owlcation. Retrieved 6 September 2019.
- ^ "Black consciousness and student revolt in Cape Town". South African History Online. Retrieved 14 June 2014.
- ^ Cilliers, Charles (17 July 2018). "Khoi-San king declares that the Cape has seceded from SA".
- ^ "Khoisan Nation serves Cape Town parliament with eviction notice". 18 July 2018.
- ^ Makinana, Andisiwe (10 May 2019). "It's official: DA has comfortably won the Western CapeIt's official: DA has comfortably won the Western Cape". TimesLIVE. Retrieved 1 April 2020.
- ^ "IEC Results Dashboard". results.elections.org.za.
- ^ Charles, Marvin. "Cape Independence: Lobby group says recent survey 'places intense pressure' on DA to hold referendum". News24. Retrieved 20 October 2021.
- ^ "The CapeXit mission: Can this be Brexit for the Western Cape?". The South African. 31 May 2021. Retrieved 20 October 2021.
- ^ "An independent Western Cape on the cards? Here is what you need to know about the independence bid". TimesLIVE. Retrieved 20 October 2021.
- ^ "Freedom Front Plus pushes for independent Western Cape". capetownetc.com. Retrieved 15 May 2021.
- ^ Shepherd, Ling (4 October 2021). "The Capexit battle royale #LGE2021". The Daily Vox. Retrieved 20 October 2021.
- ^ "Cape Independence Polling Results for 2023". 11 September 2020.
- ^ a b "2016 Boundaries". Municipal Demarcation Board (Shapefile). 2016.
- ^ a b "Community Survey 2016". Statistics South Africa (Data file). 2016. Archived from the original on 20 September 2018. Retrieved 4 February 2017.
- ^ Africa, Statistics South. "Four facts about our provincial economies | Statistics South Africa". Retrieved 9 August 2021.
- ^ a b "Western Cape Economic Overview". Westgro. Archived from the original on 25 December 2010. Retrieved 14 May 2011.
- ^ "Western Cape unemployment rate drops to below 20% – StatsSA". iol.co.za. Cape Argus. Retrieved 16 February 2019.
- ^ Adelzadeh, Asghar; et al. (2003). South Africa Human Development Report 2003 (PDF). Cape Town: Oxford University Press. p. 282. ISBN 978-0-19-578418-3.
- ^ a b "Fast Facts: April–May 2007, Provincial Profile, Western Cape". South African Institute of Race Relations, pg 20.
- ^ The Food and Beverage Market Entry Handbook: South Africa (PDF). European Union: European Union. 2020. p. 178. ISBN 978-92-9478-535-0.
- ^ "The Ultimate Guide to South African Wines". 8 June 2021.
- ^ "Statistics South Africa | Census Dissemination". census.statssa.gov.za.
- ^ a b c Census 2011: Statistical release (PDF). Pretoria: Statistics South Africa. 30 October 2012. Archived from the original (PDF) on 13 November 2015. Retrieved 24 November 2015.
- ^ "Statistics South Africa | Census Dissemination". census.statssa.gov.za. Retrieved 23 October 2023.
- ^ a b c Barnes, Clayton (14 February 2013). "Cape's population by the numbers". Cape Argus. Retrieved 21 February 2013.
- ^ Hamann, Maike; Tuinder, Vanessa (February 2012). "Introducing the Eastern Cape: A quick guide to its history, diversity and future challenges" (PDF). Southern African Program on Ecosystem Change and Society. p. 22. Retrieved 17 June 2022.
- ^ Quarterly Labour Force Survey: Quarter 3, 2012 (PDF). Pretoria: Statistics South Africa. 1 November 2012.
- ^ "Skilled Workforce reference". South African Department of Sport And Recreation.
- ^ Hurt, J.; Ehlers, S. (2008). The Complete Idiot's Guide to Cheeses of the World. DK Publishing. p. 204. ISBN 978-1-4406-3618-9.
- ^ "Best Restaurants in Africa – Tripadvisor Travellers' Choice Awards". tripadvisor.co.za. Retrieved 6 August 2021.
- ^ "Wines of South Africa – Winelands of South Africa". wosa.co.za. Retrieved 9 July 2020.
- ^ "The Western Cape Brandy Rout". The South African Brandy Association. Archived from the original on 11 September 2011. Retrieved 26 February 2011.
- ^ "South Africa wins Best Brandy in the World". International Wine & Spirits Competition 2010. Retrieved 26 February 2011.
- ^ Charles W. Bamforth, Robert E. Ward, ed. (2014). "5.2. Brandy". The Oxford Handbook of Food Fermentations. Oxford University Press. pp. 249–252. ISBN 9780199742707.
- Provincial Government of the Western Cape
- Western Cape Tourism
- Western Cape Investment and Trade Promotion Agency
- Municipal Demarcation Board
- Western Cape on Wazimap.co.za
| |||||||
| Provinces | |||||||
| Municipalities |
| ||||||
| Settlements |
| ||||||
| National | |
|---|---|
| Geographic | |
Western Cape
| |
|---|---|
| Motto: Spes Bona (
Latin: Good Hope) | |
|
Map showing the location of the Western Cape in the south-western part of South Africa in red | |
| Coordinates: 34°S 20°E / 34°S 20°E | |
| Country | |
| Established | 27 April 1994 |
| Capital | Cape Town |
| Municipalities | |
| Government | |
| • Type | Parliamentary system |
| • Premier | Alan Winde ( DA) |
| • Legislature | Western Cape Provincial Parliament |
| Area
[1]: 9 | |
| • Total | 129,462 km2 (49,986 sq mi) |
| • Rank | 4th in South Africa |
| Highest elevation | 2,325 m (7,628 ft) |
| Lowest elevation | 0 m (0 ft) |
| Population (2022) | |
| • Total | 7,433,020 |
| • Rank | 3rd in South Africa |
| • Density | 57/km2 (150/sq mi) |
| • Rank | 4th in South Africa |
| Population groups 2022 Census | |
| • Coloured | 42.1% |
| • Black | 38.8% |
| • White | 16.4% |
| • Indian or Asian | 1.1% |
| Languages
[1]: 25 | |
| • Afrikaans | 41.2% |
| • Xhosa | 31.4% |
| • English | 22.0% |
| Time zone | UTC+2 ( SAST) |
| ISO 3166 code | ZA-WC |
| GDP | |
| HDI (2021) | 0.751
[4] high · 1st of 9 |
| Gini (2010) | high |
| Website |
www |
| Xhosa | iNtshona-Koloni |
|---|---|
| Afrikaans | Wes-Kaap |
| Sepedi | Kapa Bodikela |
| Sesotho | Kapa Bophirimela |
| Setswana | Kapa Bophirima |
| Xitsonga | Kapa Vupela-dyambu |
| Venda | Kapa Vhukovhela |
The Western Cape ( Afrikaans: Wes-Kaap [ˈvɛskɑːp]; Xhosa: iNtshona-Koloni) is a province of South Africa, situated on the south-western coast of the country. It is the fourth largest of the nine provinces with an area of 129,449 square kilometres (49,981 sq mi), and the third most populous, with an estimated 7 million inhabitants in 2020. [6] About two-thirds of these inhabitants live in the metropolitan area of Cape Town, which is also the provincial capital. The Western Cape was created in 1994 from part of the former Cape Province. The two largest cities are Cape Town and George.
The Western Cape is roughly L-shaped, extending north and east from the Cape of Good Hope, in the southwestern corner of South Africa. It stretches about 400 kilometres (250 mi) northwards along the Atlantic coast and about 500 kilometres (300 mi) eastwards along the South African south coast ( Southern Indian Ocean). It is bordered on the north by the Northern Cape and on the east by the Eastern Cape. The total land area of the province is 129,462 square kilometres (49,986 sq mi), [1]: 9 about 10.6% of the country's total. It is roughly the size of England or the State of Louisiana. Its capital city and largest city is Cape Town, and some other major cities include Stellenbosch, Worcester, Paarl, and George. The Garden Route and the Overberg are popular coastal tourism areas.
The Western Cape is the southernmost region of the African continent with Cape Agulhas as its southernmost point, only 3,800 kilometres (2,400 mi) from the Antarctic coastline. The coastline varies from sandy between capes, to rocky to steep and mountainous in places. The only natural harbour is Saldanha Bay on the west coast, about 140 kilometres (90 mi) north of Cape Town. However a lack of fresh water in the region meant that it has only recently been used as a harbour.[ citation needed] The province's main harbour was built in Table Bay, which in its natural state was fully exposed to the northwesterly storms that bring rain to the province in winter, as well as the almost uninterrupted dry southeasterly winds in summer. But fresh water coming off Table Mountain and Devil's Peak allowed the early European settlers to build Cape Town on the shores of this less than satisfactory anchorage.
The province is topographically exceptionally diverse. Most of the province falls within the Cape Fold Belt, a set of nearly parallel ranges of sandstone folded mountains of Cambrian- Ordovician age (the age of the rocks is from 510 to about 330 million years ago; their folding into mountains occurred about 350 to about 270 million years ago). [7] [8] [9] The height of the mountain peaks in the different ranges varies from 1,000 metres (3,300 ft) to 2,300 metres (7,500 ft). The valleys between ranges are generally very fertile, as they contain the weathered loamy soils of the Bokkeveld mudstones (see the diagrams below). [8]
The far interior forms part of the Karoo. This region of the province is generally arid and hilly, with a prominent escarpment that runs close to the Province's most inland boundary.
-
A diagrammatic 400 km south–north crosssection through the Cape at approximately 21° 30' E (i.e. near Calitzdorp in the Little Karoo), showing the relationship between the Cape Fold Mountains (and their geological structure) and the geology of the Little and Great Karoo, as well as the position of the Great Escarpment. The colour code for the geological layers is the same as those used in the diagram above. The heavy black line flanked by opposing arrows is the fault that runs for nearly 300 km along the southern edge of the Swartberg Mountains. The Swartberg Mountain range owes some of its great height to upliftment along this fault line. The subsurface structures are not to scale.
The escarpment marks the southwestern edge of South Africa's central plateau (see the middle and bottom diagrams on the left). [8] [10] It runs parallel to the entire South African coastline, except in the very far northeast, where it is interrupted by the Limpopo River valley, and in the far northwest, where it is interrupted by the Orange River valley. The 1,000-kilometre-long (620 mi) northeastern stretch of the escarpment is called the Drakensberg, which is geographically and geologically quite distinct from the Cape Fold Mountains, which originated much earlier and totally independently of the origin of the escarpment. [8] [9] [11] [12]
The principal rivers of the province are the Berg and Olifants which drain into the Atlantic Ocean, and the Breede and Gourits which drain into the Indian Ocean.
The vegetation of the region is also extremely diverse, with one of the world's seven floral kingdoms almost exclusively endemic to the province, namely the Cape Floral Kingdom, most of which is covered by Fynbos (from the Afrikaans meaning "Fine Bush" (Dutch: Fijnbosch), though precisely how it came to be referred to as such, is uncertain.). [13] [14] These evergreen heathlands are extremely rich in species diversity, [13] [14] with at least as many plant species occurring on Table Mountain as in the entire United Kingdom. [14] It is characterised by various types of shrubs, thousands of herbaceous flowering plant species and some grasses. [13] With the exception of the Silver tree, Leucadendron argenteum, which only grows on the granite and clay soils of the Cape Peninsula, [15] open fynbos is generally treeless except in the wetter mountain ravines where patches of Afromontane forest persist. [13] [14]
The arid interior is dominated by Karoo drought-resistant shrubbery.[ citation needed] The West Coast and Little Karoo are semi-arid regions and are typified by many species of succulents and drought-resistant shrubs and acacia trees. The Garden Route on the south coast (between the Outeniqua Mountains and the Southern Indian Ocean) is extremely lush, with temperate rainforest (or Afromontane Forest) covering many areas adjacent to the coast, in the deep river valleys and along the southern slopes of the Outeniqua mountain range.[ citation needed] Typical species are hardwoods of exceptional height, such as Yellowwood, Stinkwood and Ironwood trees.
The Western Cape is climatologically diverse, with many distinct micro- and macroclimates created by the varied topography and the influence of the surrounding ocean currents. These are the warm Agulhas Current which flows southwards along South Africa's east coast, and the cold Benguela Current which is an upwelling current from the depths of the South Atlantic Ocean along South Africa's west coast. [16] [17] Thus climatic statistics can vary greatly over short distances. Most of the province is considered to have a Mediterranean climate with cool, wet winters and warm, dry summers. Both the Great Karoo and Little Karoo, in the interior, have an arid to semi-arid climate with cold, frosty winters and hot summers with occasional thunderstorms. The Garden Route and the Overberg on the south coast have a maritime climate with cool, moist winters and mild, moist summers. Mossel Bay in the Garden Route is considered[ by whom?] to have the second mildest climate worldwide after Hawaii.[ citation needed] The La Niña phase of the El Niño-Southern Oscillation cycle tends to increase rainfall in this region in the dry season (November to April). [18]
The effects of El Niño on rainfall in southern Africa differ between the summer and winter rainfall areas. Winter rainfall areas tend to get higher rainfall than normal and summer rainfall areas tend to get less rain. The effect on the summer rainfall areas is stronger and has led to severe drought in strong El Niño events. [19] [20]
Sea surface temperatures off the west and south coasts of South Africa are affected by ENSO via changes in surface wind strength. [21] During El Niño the south-easterly winds driving upwelling are weaker which results in warmer coastal waters than normal, while during La Niña the same winds are stronger and cause colder coastal waters. These effects on the winds are part of large scale influences on the tropical Atlantic and the South Atlantic High-pressure system, and changes to the pattern of westerly winds further south. There are other influences not known to be related to ENSO of similar importance. Some ENSO events do not lead to the expected changes. [21]
Thunderstorms are generally rare in the province (except in the Karoo) with most precipitation being of a frontal or orographic nature. Extremes of heat and cold are common inland, but rare near the coast. Snow is a common winter occurrence on the Western Cape Mountains occasionally reaching down into the more inland valleys. Otherwise, frost is relatively rare in coastal areas and many of the heavily cultivated valleys.
| Climate data for Cape Town International Airport, elevation: 42m, normals for 1991-2020 | |||||||||||||
|---|---|---|---|---|---|---|---|---|---|---|---|---|---|
| Month | Jan | Feb | Mar | Apr | May | Jun | Jul | Aug | Sep | Oct | Nov | Dec | Year |
| Mean daily maximum °C (°F) | 27.0 (80.6) |
27.3 (81.1) |
26.0 (78.8) |
23.6 (74.5) |
20.6 (69.1) |
18.2 (64.8) |
17.9 (64.2) |
18.0 (64.4) |
19.6 (67.3) |
22.2 (72.0) |
23.7 (74.7) |
25.8 (78.4) |
22.5 (72.5) |
| Daily mean °C (°F) | 21.8 (71.2) |
21.9 (71.4) |
20.5 (68.9) |
17.9 (64.2) |
15.4 (59.7) |
13.2 (55.8) |
12.7 (54.9) |
13.0 (55.4) |
14.5 (58.1) |
15.9 (60.6) |
18.6 (65.5) |
20.7 (69.3) |
17.2 (62.9) |
| Mean daily minimum °C (°F) | 16.6 (61.9) |
16.5 (61.7) |
15.0 (59.0) |
12.2 (54.0) |
10.2 (50.4) |
8.1 (46.6) |
7.4 (45.3) |
7.9 (46.2) |
9.4 (48.9) |
11.5 (52.7) |
13.4 (56.1) |
15.6 (60.1) |
12.0 (53.6) |
| Average precipitation mm (inches) | 9.4 (0.37) |
9.6 (0.38) |
12.5 (0.49) |
40.1 (1.58) |
61.1 (2.41) |
92.3 (3.63) |
84.8 (3.34) |
72.4 (2.85) |
44.3 (1.74) |
28.4 (1.12) |
24.3 (0.96) |
12.8 (0.50) |
492 (19.37) |
| Average precipitation days (≥ 1.0 mm) | 1.8 | 1.8 | 2.5 | 5.0 | 7.4 | 10.1 | 9.1 | 9.3 | 6.8 | 4.2 | 4 | 2.6 | 64.6 |
| Mean monthly sunshine hours | 352.3 | 304 | 289.7 | 240.1 | 196.7 | 175.9 | 197 | 206.2 | 228.4 | 283.5 | 302.8 | 338.4 | 3,115 |
| Source: NOAA [22] | |||||||||||||
| George, Garden Route | ||||||||||||||||||||||||||||||||||||||||||||||||||||||||||||
|---|---|---|---|---|---|---|---|---|---|---|---|---|---|---|---|---|---|---|---|---|---|---|---|---|---|---|---|---|---|---|---|---|---|---|---|---|---|---|---|---|---|---|---|---|---|---|---|---|---|---|---|---|---|---|---|---|---|---|---|---|
| Climate chart ( explanation) | ||||||||||||||||||||||||||||||||||||||||||||||||||||||||||||
| ||||||||||||||||||||||||||||||||||||||||||||||||||||||||||||
| ||||||||||||||||||||||||||||||||||||||||||||||||||||||||||||
| Saldanha, West Coast | ||||||||||||||||||||||||||||||||||||||||||||||||||||||||||||
|---|---|---|---|---|---|---|---|---|---|---|---|---|---|---|---|---|---|---|---|---|---|---|---|---|---|---|---|---|---|---|---|---|---|---|---|---|---|---|---|---|---|---|---|---|---|---|---|---|---|---|---|---|---|---|---|---|---|---|---|---|
| Climate chart ( explanation) | ||||||||||||||||||||||||||||||||||||||||||||||||||||||||||||
| ||||||||||||||||||||||||||||||||||||||||||||||||||||||||||||
| ||||||||||||||||||||||||||||||||||||||||||||||||||||||||||||
| This article is part of a series on the |
|
Politics of the Western Cape |
|---|
The Cape has had a long tradition of holding liberal values. [25] For example, the Cape Qualified Franchise before the Union of South Africa.
The Cape Qualified Franchise was the system of non-racial franchise that was adhered to in the Cape Colony, and in the Cape Province in the early years of the Union of South Africa. Qualifications for the right to vote at parliamentary elections were applied equally to all men, regardless of race.
This local system of multi-racial suffrage was later gradually restricted, and eventually abolished, under various National Party and United Party governments. In 1930 white women were enfranchised, and in 1931 property qualifications for white voters were removed. In 1936 black voters were then removed from the common voters' rolls and allowed only to elect separate members in 1936, and subsequently denied all representation in the House of Assembly in 1960. Coloured voters similarly followed in 1958 and 1970, respectively.
The Black Consciousness Movement (BCM) was a grassroots anti-Apartheid activist movement that emerged in South Africa in the mid-1960s out of the political vacuum created by the jailing and banning of the African National Congress and Pan Africanist Congress leadership after the Sharpeville Massacre in 1960. The BCM represented a social movement for political consciousness. [26]
In December 1968, the South African Student Organization (SASO) was formed at a conference held in Marianhill, Natal. The conference was exclusively attended by Black students. After its launch, SASO became the medium through which black consciousness ideology spread to schools and other university campuses across the country. [27]
In 1974, South African Minister of Bantu Education and Development MC Botha, constituted the imposition of using Afrikaans as a medium of instruction in black schools, effective with students in Grade 7 (Standard 5) upwards. [28] As early as March 1976, students began passive resistance against Afrikaans, fueling the outbreak of the Soweto Uprising on 16 June 1976. Consequently, the student protests spread to other parts of the country, and Cape Town became a pivotal site for Western Cape student revolt. [29]
Student leaders at the University of the Western Cape (UWC) and the University of Cape Town (UCT) organised marches. Poster parades by UWC and Black Power Salute marches by UCT was broken by the police, resulting in 73 students getting arrested and detained at Victor Verster Prison, near Paarl.[ citation needed]
On 1 September 1976, the unrest spread to the city of Cape Town itself. Approximately 2000 black students from Western Cape townships, namely Langa, Nyanga and Gugulethu, matched the Cape Town central business district (CBD). Coloured students also contributed to the protests by peacefully marching to the city, but were blockaded by the police in the CBD. The protests turned violent when coloured students started burning schools, libraries and a magistrate's court in support of the student revolt. Thereafter, 200,000 coloured workers partook in a two-day strike staying away from work in the Cape Town area.[ citation needed]
According to a report by the Truth and Reconciliation Commission (TRC), the Western Cape experienced the second highest number of deaths and casualties associated with the 1976 uprising protests. [30]
In 1994, at the introduction of the Interim Constitution and the first non-racial election, South Africa's original provinces and bantustans were abolished and nine new provinces were established. The former Cape Province was divided into the Western Cape, Northern Cape, Eastern Cape and part of North West.
In the 1994 election, the Western Cape was one of two provinces that did not elect an African National Congress (ANC) provincial government (the other being KwaZulu-Natal). The National Party (NP) won 53% of the votes and 23 seats in the 42-seat provincial legislature, and Hernus Kriel, a former Minister of Law and Order, was elected Premier. He resigned in 1998 and was replaced by Gerald Morkel.
The 1999 election marked the beginning of a period of great turbulence in Western Cape politics. No party achieved an absolute majority in the provincial parliament, as the ANC won 18 seats while the New National Party (NNP), successor to the NP, won 17. The NNP went into coalition with the Democratic Party (DP), which won 5 seats, to form a government, and Morkel remained Premier. In 2000 the DP and the NNP formalised their coalition by forming the Democratic Alliance (DA).
In 2001, however, the NNP broke with the DA over the removal of Peter Marais from office as Mayor of Cape Town by DA leader Tony Leon. The NNP instead went into coalition with the ANC; Gerald Morkel, who was opposed to the split, resigned as Premier and was replaced by Peter Marais. In 2002 Marais resigned as Premier due to a sexual harassment scandal, and was replaced by NNP leader Marthinus van Schalkwyk. During the 2003 floor-crossing period four members of the provincial parliament crossed to the ANC, giving it an absolute majority of 22 seats in the 42-seat house. However, the ANC remained in coalition with the NNP and van Schalkwyk remained as Premier.
In the 2004 election, there was again no absolute winner in the provincial parliament; this time the ANC won 19 seats, the DA won 12, and the NNP won 5. The ANC-NNP coalition continued in power, but van Schalkwyk took up a ministerial post in the national cabinet and was replaced as Premier by the ANC's Ebrahim Rasool. The NNP was finally dissolved after the 2005 floor-crossing period and its members joined the ANC, again giving that party an absolute majority of 24 seats. In the 2007 floor-crossing period the ANC gained a further three members of the provincial parliament. In 2008 Rasool resigned as Premier due to internal party politics, and was replaced by Lynne Brown.
The 2009 election marked a significant change in Western Cape politics, as the Democratic Alliance won 51% of the votes and an absolute majority of 22 seats in the provincial parliament, while the ANC won 14 seats with 31% of the vote. The DA leader Helen Zille was elected Premier. In 2010 the Independent Democrats, which had won 3 seats with 5% of the vote, merged with the DA. In the 2014 election the DA won 59% of the votes and an absolute majority of 26 seats in the provincial parliament, while the ANC won 14 seats with 32% of the vote. In 2018 King Khoebaha Cornelius III Declared the independence of the "Sovereign State of Good Hope". [31] [32]
In the 2019 election, the DA retained their majority in the province, but with a reduction in support. It had won 24 seats with 55%. Helen Zille was term-limited and the DA premier candidate Alan Winde succeeded her. The ANC also lost support. It had received 12 seats with 28% support, its lowest showing since 1994. Veteran politician Peter Marais returned to the provincial parliament as the sole representative of the Freedom Front Plus. Patricia de Lille formed another party, Good, and it achieved a seat. [33]
The DA continued to win a majority of the votes in the 2021 municipal elections, receiving 54% of the vote province-wide, with support in Cape Town at 58%. [34]
Since the late 2000s there has been growing support for Western Cape, or Greater Cape, independence from South Africa.[ citation needed] Political parties such as the Referendum Party, Freedom Front Plus and organisations such as the Cape Independence Advocacy Group [35] and CapeXit, [36] wish to bring forth the constitutional and peaceful secession of the Western Cape. [37] [38] [39]
Proponents claim substantial support for the idea, with CapeXit having over 800,000 signed mandates in May 2021. Additionally, a poll conducted in 2023 by Victory Research on behalf of the Cape Independence Advocacy Group claimed that 58% of the Western Cape's registered voters would support independence, while 68% would support a referendum on the issue. [40]
The provincial government is established under the Constitution of the Western Cape, which was adopted in 1998. The people of the province elect the 42-member Western Cape Provincial Parliament every five years by a system of party-list proportional representation. The fifth provincial parliament was elected in the election of 8 May 2019; 24 seats are held by the Democratic Alliance, 12 by the African National Congress, 2 by the Economic Freedom Fighters, and 1 each by Good, the African Christian Democratic Party, Al Jama-ah, and the Freedom Front Plus. The provincial parliament is responsible for legislating within its responsibilities as set out by the national constitution; these responsibilities include agriculture, education, environment, health services, housing, language policies, tourism, trade, and welfare.
The provincial parliament also elects the Premier of the Western Cape to lead the provincial executive. Since 2019 the Premiership has been held by Alan Winde, former Provincial Minister of Community Safety. The Premier appoints ten members of the provincial legislature to serve as a cabinet of ministers, overseeing the departments of the provincial government. These departments are Agriculture, Community Safety, Cultural Affairs and Sport, Economic Development and Tourism, Education, Environmental Affairs and Development Planning, Health, Human Settlements, Local Government, Social Development, Transport and Public Works, and the Provincial Treasury.
The Western Cape Province is divided into one metropolitan municipality and five district municipalities. The district municipalities are in turn divided into 24 local municipalities.
In the following interactive map, the district and metropolitan municipalities are labelled in capital letters and shaded in various different colours. Clicking on the district on the map loads the appropriate article:
| Name | Code | Seat | Area (km2) [41] |
Population (2016) [42] |
Pop. density (per km2) | |
|---|---|---|---|---|---|---|
| Cape Winelands District Municipality | DC2 | Worcester | 21,473 | 866,001 | 40.3 | |
| Central Karoo District Municipality | DC5 | Beaufort West | 38,854 | 74,247 | 1.9 | |
| City of Cape Town Metropolitan Municipality | CPT | Cape Town | 2,446 | 4,005,016 | 1,637.6 | |
| Garden Route District Municipality | DC4 | George | 23,331 | 611,278 | 26.2 | |
| Overberg District Municipality | DC3 | Bredasdorp | 12,239 | 286,786 | 23.4 | |
| West Coast District Municipality | DC1 | Moorreesburg | 31,119 | 436,403 | 14.0 |
| Name | Code | District | Seat | Area (km2) [41] |
Population (2016) [42] |
Pop. density (per km2) | |
|---|---|---|---|---|---|---|---|
| Beaufort West Local Municipality | WC053 | Central Karoo | Beaufort West | 21,917 | 51,080 | 2.3 | |
| Bergrivier Local Municipality | WC013 | West Coast | Piketberg | 4,407 | 67,474 | 15.3 | |
| Bitou Local Municipality | WC047 | Garden Route | Plettenberg Bay | 992 | 59,157 | 59.6 | |
| Breede Valley Local Municipality | WC025 | Cape Winelands | Worcester | 3,834 | 176,578 | 46.1 | |
| Cape Agulhas Local Municipality | WC033 | Overberg | Bredasdorp | 3,471 | 36,000 | 10.4 | |
| Cederberg Local Municipality | WC012 | West Coast | Clanwilliam | 8,007 | 52,949 | 6.6 | |
| City of Cape Town Metropolitan Municipality | CPT | Cape Town | 2,446 | 4,005,016 | 1,637.6 | ||
| Drakenstein Local Municipality | WC023 | Cape Winelands | Paarl | 1,538 | 280,195 | 182.2 | |
| George Local Municipality | WC044 | Garden Route | George | 5,191 | 208,237 | 40.1 | |
| Hessequa Local Municipality | WC042 | Garden Route | Riversdale | 5,733 | 54,237 | 9.5 | |
| Kannaland Local Municipality | WC041 | Garden Route | Ladismith | 4,765 | 24,168 | 5.1 | |
| Knysna Local Municipality | WC048 | Garden Route | Knysna | 1,109 | 73,835 | 66.6 | |
| Laingsburg Local Municipality | WC051 | Central Karoo | Laingsburg | 8,784 | 8,895 | 1.0 | |
| Langeberg Local Municipality | WC026 | Cape Winelands | Ashton | 4,518 | 105,483 | 23.3 | |
| Matzikama Local Municipality | WC011 | West Coast | Vredendal | 12,981 | 71,045 | 5.5 | |
| Mossel Bay Local Municipality | WC043 | Garden Route | Mossel Bay | 2,001 | 94,135 | 47.0 | |
| Oudtshoorn Local Municipality | WC045 | Garden Route | Oudtshoorn | 3,540 | 97,509 | 27.5 | |
| Overstrand Local Municipality | WC032 | Overberg | Hermanus | 1,675 | 93,407 | 55.8 | |
| Prince Albert Local Municipality | WC052 | Central Karoo | Prince Albert | 8,153 | 14,272 | 1.8 | |
| Saldanha Bay Local Municipality | WC014 | West Coast | Vredenburg | 2,015 | 111,173 | 55.2 | |
| Stellenbosch Local Municipality | WC024 | Cape Winelands | Stellenbosch | 831 | 173,197 | 208.4 | |
| Swartland Local Municipality | WC015 | West Coast | Malmesbury | 3,707 | 133,762 | 36.1 | |
| Swellendam Local Municipality | WC034 | Overberg | Swellendam | 3,835 | 40,211 | 10.5 | |
| Theewaterskloof Local Municipality | WC031 | Overberg | Caledon | 3,259 | 117,167 | 36.0 | |
| Witzenberg Local Municipality | WC022 | Cape Winelands | Ceres | 10,753 | 130,548 | 12.1 |
The Western Cape's total GDP for 2008 was R268bn, 14% of the country's total GDP, and R97,664 per capita. [43] Provincially, it is the third highest contributor to the country's GDP behind Gauteng and KwaZulu-Natal. It also has one of the fastest growing economies in the country, growing at 4% in 2008. [44] At 19.3% the province has a lower unemployment rate than the national average standing at 20% in 2018. [45] The Western Cape's Human Development Index is the highest in South Africa at 0.741 compared to the South African average of 0.705 in 2018. [46]
The biggest sector in the Western Cape's economy is the financial, business services and real estate sectors contributing approximately R77 billion in 2008. Manufacturing was the second largest contributor valued at R43.7 billion in 2008 with the agricultural sector being the fastest growing at 10.6% in the same year. [44] High-tech industries, international call centres, fashion design, advertising and TV production are niche industries rapidly gaining in importance. [47]
The city of Cape Town accounts for roughly 80% of the Western Cape's GDP. [48]
95% of wine produced in South Africa is produced in the Western Cape. South Africa is the 7th largest wine producing region in the world. [49]
The Western Cape has an excellent network of highways comparable with any first-world country. The primary highways are the N1 (from Cape Town to Three Sisters, continuing outside the province towards Bloemfontein and Johannesburg), N2 (from Cape Town to Bloukrans River, towards Port Elizabeth), N7 (from Cape Town to Bitterfontein, continuing towards Springbok and Namibia), N9 (from George to Uniondale, continuing towards Graaff-Reinet and Colesberg) and N12 (from George to Three Sisters, continuing towards Kimberley and Johannesburg). Other routes are the "R" roads which connect the smaller towns. All major roads are tarred with major rural gravel roads well maintained. Limited access motorways are limited to the Cape Metropolitan Area, Winelands and Garden Route, however due to the low population density of the remainder of the province, the highways remain efficient and high-speed, except during peak holiday travel seasons, when travel can be slow-going in places due to heavy traffic. [ citation needed]
The 2022 South African census recorded the population of the Western Cape as 7,433,020 people living in 2,264,032 households. [50] As the province covers an area of 129,462 square kilometres (49,986 sq mi), [1]: 9 the population density was 45.0 inhabitants per square kilometre (117/sq mi) and the household density 12.6 per square kilometre (33/sq mi).
The age distribution of the province was as follows: 25.1% were under the age of 15, 18.3% from 15 to 24, 32.7% from 25 to 44, 18.0% from 45 to 64, and 5.9% who are 65 years of age or older. [1]: 28 The median age is 28 years. [51]: 20 For every 100 women there are 96 men. [51]: 18
In the 2022 Census, 42% of the people of the Western Cape described themselves as " Coloured", while 39% described themselves as " Black African", 16% as " White", and 1% as " Indian or Asian [52]". [1]: 21 Afrikaans is the first language of 41% of the province's population, IsiXhosa of 31%, and English of 22%. [1]: 25
There were 260,952 people in the province who had been born outside of South Africa, comprising 4% of the population. In 2011, 894,289 residents of the Western Cape had been born in the Eastern Cape (16% of the population), 167,524 in Gauteng (3%) and 61,945 (1%) in KwaZulu-Natal. [53] Between 2001 and 2007 the Western Cape received the second-most internal migration within South Africa after Gauteng, with a large majority of these new Western Cape residents coming from the former Transkei region of the Eastern Cape, which served as the historic native reserve of the Cape Colony and the political banishment site for native "troublemakers". [54]
90% of households in the province have a flush toilet [1]: 84 and 90% have refuse removed by the local council at least once a week. [1]: 96 75% of households have piped tap water inside the dwelling, while a further 13% have piped water on their property; 11% receive piped water at a community tap, while 1% have no access to piped water. [1]: 77 One in seven people live in an informal dwelling. [53] 86.9% of households use electricity for cooking, [1]: 84 and 93% use it for lighting. [1]: 93 89% of households have a cellphone and 31% have a landline telephone, while 86% own a television, 81% own a refrigerator, and 34% own a computer. [1]: 99 44% of households have access to the Internet. [1]: 101
The average annual household income was R143,460, the second-highest in the country after Gauteng. [51]: 37 As of September 2012 [update], 69% of the population aged 15–64 are economically active, and of these 25% are unemployed. Overall, 52% of the working-age population are employed. [55] Around 2 million people in the Western Cape labour market (those aged 16 to 64) are employed, 1.3 million are not economically active, 552,733 are unemployed with an additional 122,753 who are discouraged work seekers who want to work but have given up looking for it. [53]
2.7% of residents aged 20 and over have received no schooling, 10.7% have had only some primary, 5.6% have completed primary school but gone no further, 38% have had some secondary education without finishing Grade 12, 28% have finished Grade 12 but gone no further, and 14% have higher education beyond the secondary level. Overall, 43% of residents have completed high school. [1]: 49
The Western Cape province has the most highly educated residents with a very skilled workforce in comparison to any other African region. [56] The high school graduation rate is consistently around 80%, higher than any other province. The proportion of adults with a degree or higher was 4.8% (2005), [47] the highest in the country.
The province also boasts four universities:
- Cape Peninsula University of Technology
- Stellenbosch University
- University of Cape Town
- University of the Western Cape
The province is also home to the South African Military Academy.
Types of cuisine originating from the Western Cape include Dutch and Malay cuisines. Other types of South African cuisine are also found and commonly enjoyed in the province. Over 50% of all cheese in South Africa is produced in the Western Cape. [57] Four of the top ten entries in Trip Advisor's Best Fine Dining Restaurants – Africa list for 2021 are in the Western Cape. [58]
The Western Cape is known for its wine production and vineyards. [59] The winelands are divided into six main regions: Boberg, Breede River Valley, Cape South Coast, Coastal Region, Klein Karoo and Olifants River. Each has unique climate, topography and fertile soil. Distilled wine or brandy is produced in the Cape Winelands, Overberg, and Garden Route districts of the province. [60] Brandy from these regions is regarded as amongst the best in the world due to the high, legally-enforced distilling standards in the region, technically making it equivalent to Cognac. [61] [62]
- ^ a b c d e f g h i j k l m n o p Census 2011: Census in brief (PDF). Pretoria: Statistics South Africa. 2012. ISBN 9780621413885.
- ^ Census 2022:Statistical Release. Pretoria: Statistics South Africa. 2022.
- ^ "Provincial gross domestic product:experimental estimates, 2013–2022" (PDF), www.statssa.gov.za
- ^ "Sub-national HDI – Area Database – Global Data Lab". hdi.globaldatalab.org. Retrieved 15 May 2024.
- ^ "Regional Development Profile City of Cape Town" (PDF). Western Cape Government. 2011. Retrieved 18 September 2015.
- ^ Statistics South Africa, 2020. Mid- year population estimates. Available: http://www.statssa.gov.za/publications/P0302/P03022020.pdf
- ^ Compton, J. S. (2004). The Rocks and Mountains of Cape Town. pp. 24-26, 44–70. Double Storey Books, Cape Town.
- ^ a b c d McCarthy, T., Rubridge, B. (2005). The Story of Earth and Life. pp. 188–195, 262–266. Struik Publishers, Cape Town.
- ^ a b Truswell, J.F. (1977). The Geological Evolution of South Africa. pp. 93–96, 114–159. Purnell, Cape Town.
- ^ Atlas of Southern Africa. (1984). p. 13. Reader's Digest Association, Cape Town
- ^ McCarthy, T.S. (2013) The Okavango delta and its place in the geomorphological evolution of Southern Africa. South African Journal of Geology 116: 1–54.
- ^ Norman, n. & Whitfield, G. (2006). Geological Journeys. p.290-300. Struik Publishers, Cape Town.
- ^ a b c d Manning, John (2007). "The World of Fynbos". Field Guide to Fynbos. Cape Town: Struik Publishers. pp. 8–23. ISBN 9781770072657.
- ^ a b c d Trinder-Smith, Terry (2006). "Introduction". Wild Flowers of the Table Mountain National Park. Cape Town: Botanical Society of South Africa. pp. 19–35. ISBN 1874999600.
- ^ Manning, John (2007). "Cone Bush, Tolbos". Field Guide to Fynbos. Cape Town: Struik Publishers. p. 258. ISBN 9781770072657.
- ^ Branch, M & Branch G. (1981). The Living Shores of Southern Africa. pp. 14–18. Struik Publishers, Cape Town.
- ^ Tyson, P.D., Preston-Whyte, R.A. (2000) The Weather and Climate of Southern Africa. pp. 221–223. Oxford University Press, Cape Town
- ^ Carlowicz, Michael (1 December 2021). "La Niña Returns for a Second Winter". earthobservatory.nasa.gov. Retrieved 16 December 2021.
- ^ "Southern Africa: El Niño, Positive Indian Ocean Dipole Forecast and Humanitarian Impact (October 2023)". reliefweb.int. OCHA. 16 October 2023. Retrieved 20 January 2024.
- ^ Brugnara, Yuri; Brönnimann, Stefan; Grab, Stefan; Steinkopf, Jessica; Burgdorf, Angela-Maria; Wilkinson, Clive; Allan, Rob (October 2023). "South African extreme weather during the 1877–1878 El Niño". Weather. 78 (10): 286–293. Bibcode: 2023Wthr...78..286B. doi: 10.1002/wea.4468.
- ^ a b Nhesvure, B. (2020). Impacts of ENSO on coastal South African sea surface temperatures. Faculty of Science, Department of Oceanography. Retrieved from http://hdl.handle.net/11427/32954/
-
^
"World Meteorological Organization Climate Normals for 1991-2020: Cape Town International Airport-68816" (XLS). ncei.noaa.gov (Excel).
National Oceanic and Atmosoheric Administration. Retrieved 29 February 2024.
{{
cite web}}
: CS1 maint: postscript ( link) - ^ "Climate George". Climate-Data.org. Retrieved 4 November 2021.
- ^ "Climate Saldanha". Climate-Data.org. Retrieved 4 November 2021.
- ^ J. Lewis: The Rise and Fall of the South African Peasantry: A Critique and Reassessment. Journal of Southern African Studies, XI, 1. 1984.
- ^ "The Ideology of the Black Consciousness Movement". South African History Online. Retrieved 6 September 2019.
- ^ "Black Consciousness and Student Revolt in the Cape". South African History Online. Retrieved 16 June 2014.
- ^ "The Afrikaans Medium Decree". ThoughtCo. Retrieved 6 September 2019.
- ^ "African South Africans' June 16th 1976 Revolt—Sad Times, Bad Times—A Luta Kontinua! AMANDLA! POWER!". Owlcation. Retrieved 6 September 2019.
- ^ "Black consciousness and student revolt in Cape Town". South African History Online. Retrieved 14 June 2014.
- ^ Cilliers, Charles (17 July 2018). "Khoi-San king declares that the Cape has seceded from SA".
- ^ "Khoisan Nation serves Cape Town parliament with eviction notice". 18 July 2018.
- ^ Makinana, Andisiwe (10 May 2019). "It's official: DA has comfortably won the Western CapeIt's official: DA has comfortably won the Western Cape". TimesLIVE. Retrieved 1 April 2020.
- ^ "IEC Results Dashboard". results.elections.org.za.
- ^ Charles, Marvin. "Cape Independence: Lobby group says recent survey 'places intense pressure' on DA to hold referendum". News24. Retrieved 20 October 2021.
- ^ "The CapeXit mission: Can this be Brexit for the Western Cape?". The South African. 31 May 2021. Retrieved 20 October 2021.
- ^ "An independent Western Cape on the cards? Here is what you need to know about the independence bid". TimesLIVE. Retrieved 20 October 2021.
- ^ "Freedom Front Plus pushes for independent Western Cape". capetownetc.com. Retrieved 15 May 2021.
- ^ Shepherd, Ling (4 October 2021). "The Capexit battle royale #LGE2021". The Daily Vox. Retrieved 20 October 2021.
- ^ "Cape Independence Polling Results for 2023". 11 September 2020.
- ^ a b "2016 Boundaries". Municipal Demarcation Board (Shapefile). 2016.
- ^ a b "Community Survey 2016". Statistics South Africa (Data file). 2016. Archived from the original on 20 September 2018. Retrieved 4 February 2017.
- ^ Africa, Statistics South. "Four facts about our provincial economies | Statistics South Africa". Retrieved 9 August 2021.
- ^ a b "Western Cape Economic Overview". Westgro. Archived from the original on 25 December 2010. Retrieved 14 May 2011.
- ^ "Western Cape unemployment rate drops to below 20% – StatsSA". iol.co.za. Cape Argus. Retrieved 16 February 2019.
- ^ Adelzadeh, Asghar; et al. (2003). South Africa Human Development Report 2003 (PDF). Cape Town: Oxford University Press. p. 282. ISBN 978-0-19-578418-3.
- ^ a b "Fast Facts: April–May 2007, Provincial Profile, Western Cape". South African Institute of Race Relations, pg 20.
- ^ The Food and Beverage Market Entry Handbook: South Africa (PDF). European Union: European Union. 2020. p. 178. ISBN 978-92-9478-535-0.
- ^ "The Ultimate Guide to South African Wines". 8 June 2021.
- ^ "Statistics South Africa | Census Dissemination". census.statssa.gov.za.
- ^ a b c Census 2011: Statistical release (PDF). Pretoria: Statistics South Africa. 30 October 2012. Archived from the original (PDF) on 13 November 2015. Retrieved 24 November 2015.
- ^ "Statistics South Africa | Census Dissemination". census.statssa.gov.za. Retrieved 23 October 2023.
- ^ a b c Barnes, Clayton (14 February 2013). "Cape's population by the numbers". Cape Argus. Retrieved 21 February 2013.
- ^ Hamann, Maike; Tuinder, Vanessa (February 2012). "Introducing the Eastern Cape: A quick guide to its history, diversity and future challenges" (PDF). Southern African Program on Ecosystem Change and Society. p. 22. Retrieved 17 June 2022.
- ^ Quarterly Labour Force Survey: Quarter 3, 2012 (PDF). Pretoria: Statistics South Africa. 1 November 2012.
- ^ "Skilled Workforce reference". South African Department of Sport And Recreation.
- ^ Hurt, J.; Ehlers, S. (2008). The Complete Idiot's Guide to Cheeses of the World. DK Publishing. p. 204. ISBN 978-1-4406-3618-9.
- ^ "Best Restaurants in Africa – Tripadvisor Travellers' Choice Awards". tripadvisor.co.za. Retrieved 6 August 2021.
- ^ "Wines of South Africa – Winelands of South Africa". wosa.co.za. Retrieved 9 July 2020.
- ^ "The Western Cape Brandy Rout". The South African Brandy Association. Archived from the original on 11 September 2011. Retrieved 26 February 2011.
- ^ "South Africa wins Best Brandy in the World". International Wine & Spirits Competition 2010. Retrieved 26 February 2011.
- ^ Charles W. Bamforth, Robert E. Ward, ed. (2014). "5.2. Brandy". The Oxford Handbook of Food Fermentations. Oxford University Press. pp. 249–252. ISBN 9780199742707.
- Provincial Government of the Western Cape
- Western Cape Tourism
- Western Cape Investment and Trade Promotion Agency
- Municipal Demarcation Board
- Western Cape on Wazimap.co.za
| |||||||
| Provinces | |||||||
| Municipalities |
| ||||||
| Settlements |
| ||||||
| National | |
|---|---|
| Geographic | |