From Wikipedia, the free encyclopedia
28 April 2024
| Week
|
Mon
|
Tue
|
Wed
|
Thu
|
Fri
|
Sat
|
Sun
|
| W14
|
01
|
02
|
03
|
04
|
05
|
06
|
07
|
| W15
|
08
|
09
|
10
|
11
|
12
|
13
|
14
|
| W16
|
15
|
16
|
17
|
18
|
19
|
20
|
21
|
| W17
|
22
|
23
|
24
|
25
|
26
|
27
|
28
|
| W18
|
29
|
30
|
01
|
02
|
03
|
04
|
05
|
My Languages
My Templates
My proposal flag of Latin America
My proposals flags of Mexican states
Flag maps of Mexican States


Foreign-born residents in Mexico by continent
Foreign-born residents in Mexico from Africa
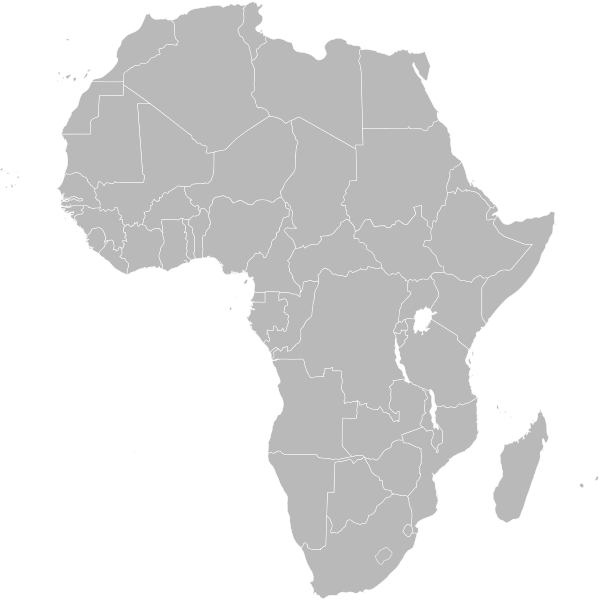
Foreign-born residents in Mexico from Africa| Year |
Pop. |
±% |
|---|
| 2000 | 986 | — |
|---|
| 2010 | 1,549 | +57.1% |
|---|
| Source:
INEGI |
| Place |
Countries of Africa |
2010 |
2000 |
1990
|
| 1 |
 Morocco
 |
233 |
156 |
N/D
|
| 2 |
 Egypt
Egypt |
195 |
109 |
N/D
|
| 3 |
 South Africa
 |
193 |
75 |
N/D
|
|
Other African countries |
921 |
646 |
N/D
|
| TOTAL |
1,549 |
986 |
N/D
|
|
|
Foreign-born residents in Mexico from Asia

Foreign-born residents in Mexico from Asia| Year |
Pop. |
±% |
|---|
| 2000 | 11,489 | — |
|---|
| 2010 | 19,660 | +71.1% |
|---|
| Source:
INEGI |
| Place |
Countries of Asia |
2010 |
2000 |
1990
|
| 1 |
 China
China |
6,655 |
1,754 |
N/D
|
| 2 |
 South Korea
 |
3,960 |
2,079 |
N/D
|
| 3 |
 Japan
Japan |
3,004 |
2,936 |
N/D
|
|
Other Asian countries |
6,041 |
4,720 |
N/D
|
| TOTAL |
19,660 |
11,489 |
N/D
|
|
|
Foreign-born residents in Mexico from the Americas

Foreign-born residents in Mexico from the Americas| Year |
Pop. |
±% |
|---|
| 2000 | 430,954 | — |
|---|
| 2010 | 887,531 | +105.9% |
|---|
| Source:
INEGI |
| Place |
Countries of the Americas |
2010 |
2000 |
1990
|
| 1 |
 United States
 |
738,103 |
343,591 |
N/D
|
| 2 |
 Guatemala
 |
35,322 |
23,957 |
N/D
|
| 3 |
 Colombia
 |
13,922 |
6,215 |
N/D
|
| 4 |
 Argentina
 |
13,696 |
6,465 |
N/D
|
| 5 |
 Cuba
Cuba |
12,108 |
6,647 |
N/D
|
| 6 |
 Honduras
 |
10,991 |
3,722 |
N/D
|
| 7 |
 Venezuela
 |
10,063 |
2,823 |
N/D
|
| 8 |
 El Salvador
 |
8,088 |
5,537 |
N/D
|
| 9 |
 Canada
 |
7,943 |
5,768 |
N/D
|
| 10 |
 Peru
Peru |
5,886 |
3,749 |
N/D
|
| 11 |
 Chile
Chile |
5,267 |
3,848 |
N/D
|
| 12 |
 Brazil
 |
4,532 |
2,320 |
N/D
|
| 13 |
 Nicaragua
 |
3,572 |
2,522 |
N/D
|
|
Other Americas countries |
18,038 |
14,150 |
N/D
|
| TOTAL |
887,531 |
430,954 |
N/D
|
|
|
Foreign-born residents in Mexico from Europe

Foreign-born residents in Mexico from Europe| Year |
Pop. |
±% |
|---|
| 2000 | 48,110 | — |
|---|
| 2010 | 51,411 | +6.9% |
|---|
| Source:
INEGI |
| Place |
Country of Europe |
2010 |
2000 |
1990
|
| 1 |
 Spain
Spain |
18,873 |
21,024 |
N/D
|
| 2 |
 France
 |
7,163 |
5,723 |
N/D
|
| 3 |
 Germany
 |
6,214 |
5,595 |
N/D
|
| 4 |
 Italy
Italy |
4,964 |
3,904 |
N/D
|
|
Other European countries |
14,197 |
11,864 |
N/D
|
| TOTAL |
51,411 |
48,110 |
N/D
|
|
|
Foreign-born residents in Mexico from Oceania

Foreign-born residents in Mexico from Oceania| Year |
Pop. |
±% |
|---|
| 2000 | 821 | — |
|---|
| 2010 | 556 | −32.3% |
|---|
| Source:
INEGI |
| Place |
Country of Oceania |
2010 |
2000 |
1990
|
| 1 |
 Australia
 |
434 |
280 |
N/D
|
| 2 |
 New Zealand
 |
103 |
77 |
N/D
|
|
Other Oceanic countries |
19 |
464 |
N/D
|
| TOTAL |
556 |
556 |
N/D
|
|
|
Number of people by nationality in Mexico
Mexico States And Federal District Population
| Rank
|
Country of origin
|
Population (2000)
|
Population (2010)
|
| 1.
|
 United States
|
343,591
|
738,103
|
| 2.
|
Guatemala
|
23,597
|
35,322
|
| 3.
|
Spain
|
21,024
|
18,873
|
| 4.
|
Colombia
|
6,215
|
13,922
|
| 5.
|
Argentina
|
6,465
|
13,696
|
| 6.
|
Cuba
|
5,537
|
12,108
|
| 7.
|
Honduras
|
3,722
|
10,991
|
| 8.
|
Venezuela
|
2,823
|
10,063
|
| 9.
|
El Salvador
|
6,647
|
8,088
|
| 10.
|
Canada
|
5,768
|
7,943
|
| 11.
|
France
|
5,723
|
7,163
|
| 12.
|
South Korea
|
2,100
|
6,655
|
| 13.
|
Germany
|
5,595
|
6,214
|
| 14.
|
Peru
|
3,749
|
5,886
|
| 15.
|
Chile
|
3,848
|
5,267
|
| 16.
|
Italy
|
3,904
|
4,964
|
| 17.
|
Brazil
|
2,320
|
4,532
|
| 18.
|
China
|
2,001
|
3,960
|
| 19.
|
Nicaragua
|
2,522
|
3,572
|
| 20.
|
Japan
|
2,936
|
3,004
|
| 21.
|
Australia
|
281
|
434
|
| 22.
|
Morocco
|
156
|
233
|
| 23.
|
Egypt
|
109
|
195
|
| 24.
|
South Africa
|
75
|
193
|
| 25.
|
New Zealand
|
77
|
103
|
Pictures of Mexico


.jpg)
