Images uploaded by SEWilco
Up
-
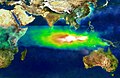 Indonesian smoke.
 -
 Sumatra fires, particularly peat fires.
 -
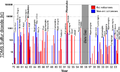
 Wolf number since 1750.
 -
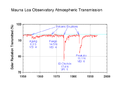
 Atmospheric absorption.
 -
 Brewer-Dobson circulation in the ozone layer.
 -
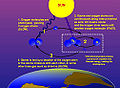 Ozone-oxygen cycle in the ozone layer.
 -
 Ozone energies at several altitudes.
 -
 Levels of ozone at various altitudes and blocking of ultraviolet radiation.
 -
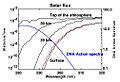
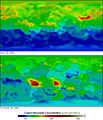
 Solar radiation above the atmosphere and at the surface.
 -
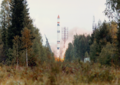 Launch of Meteor-3.
 -
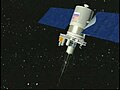 Meteor-3
 -
 Solar irradiance spectrum.
 -
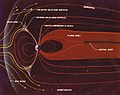
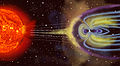 Magnetosphere rendition.
 -

-
-
 Sunspots 11,400 years.
 -
 Sunspot butterfly diagram.
 -
-
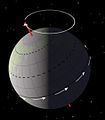 Earth precession.
 -
 Earth obliquity.
 -
 Eccentricity 0.5
 -
 Eccentricity zero
 -
 Orbital variation


Around
-
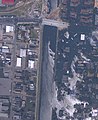
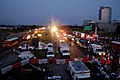 Hurricane Katrina main staging area, NO, LA.
 -
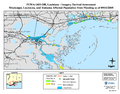 Hurricane Katrina damage map.
 -
 TAPS where crosses Denali fault.
 -
Position of Antarctica. You are not there.
-
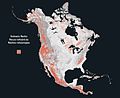
 North American craton.
 -
-
-

-
-

-
-
-
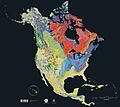
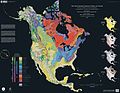 Combined geologic and shaded relief map of North America.
 -
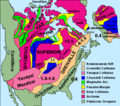 North American cratons and basement rocks. (replaced when User:Berkut found higher resolution image)
 -
 Surface of the Earth
 -
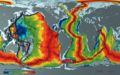 Age of seafloor crust
 -
 Age of seafloor crust
 -
 Magnetic declination.
 -
 Recent paleomagnetism.
 -
 Cenozoic paleomagnetism.
 -
 Antarctica ice shelves.


Around Back
-
 Atmospheric mercury deposition at Fremont glacier over 270 years.
 -
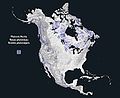
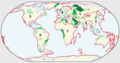
 Last glacial maximum vegetation.
 -
 Magnetic striping on spreading oceanic crust.
 -
 Fossil evidence of continental drift.
 -
 Generalized geographic map of the United States in Middle Pennsylvanian time.
 -
 Generalized geographic map of the United States in Late Cretaceous time.
 -
 The maximum extent of glacial ice in the north polar area during Pleistocene time.
 -
 Carbon 14 with activity labels.
 -
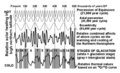
 Carbon 14 with sunspots since 1700.
 -
 Carbon 14 10,000 years with Hallstatt cycles.
 -
 Carbon 14 10,000 years.


Around Water
-
 LCU 1656 leaves USS Bataan to LA.
 -
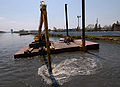 Flexifloat in New Orleans canal.
 -
 Blackhawk dropping sandbag, September 4 2005.
 -
 17th Street Canal, September 4 2005.
 -
 Flooded buses in New Orleans.
 -
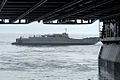
 USS Tortuga at dock in New Orleans.
 -
 New Orleans 17th Street Canal wall breach.
 -
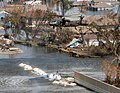
 New Orleans levee break.
 -

GISP2Vostok team -
 GISP2 ice core layers
 -
 Glacier firn sampling
 -
 Arctic sea ice in spring
 -
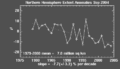 Sea ice extent trend for the Northern Hemisphere.
 -
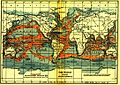
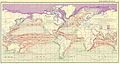 Ocean currents 1943
 -
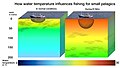 Fishing in warm water for cold-loving fish.
 -
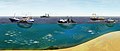 Fishing gear in southeast Pacific Ocean.
 -
-
 Chlorophyll growth due to nutrients mixed by 2001 winter jets
 -
 Sea level and temperatures 140 kyr.
 -
-
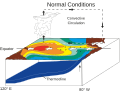 ENSO normal pattern.
 -
 ENSO El Nino pattern.
 -
 ENSO La Nina pattern.
_August_31,_2005.jpg)


Around Air
-
 Mid-1900s global cooling map.
 -
 Chlorine-36 in US ice.
 -
 CFCs in Greenland firn.
 -

-
 North America climate model annual precipitation
 -
 Climate model temperature forecasts
 -
 Climate model temperature anomalies
 -
 420,000 years of ice core data from Vostok, Antarctica research station.
 -
 Madden-Julian oscillation affects North American weather.
 -
 El Niño effects upon North American weather and atmospheric circulation.
 -
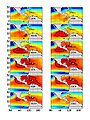
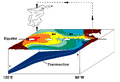
 Average equatorial Pacific Ocean temperatures.
 -
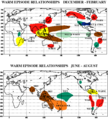 During warm ENSO episodes the normal patterns of tropical precipitation and atmospheric circulation become disrupted.
 -
 During cold La Niña episodes the normal patterns of tropical precipitation and atmospheric circulation become disrupted.
 -
-
-
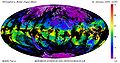
 Water vapor trend.
 -
 Volcanic SO2 events.
 -
 Mount Pinatubo SO2.
 -
 Mount Pinatubo ash and aerosol.
 -
 Dimming due to volcanoes.
 -
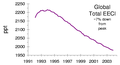
 Ozone depletion gas trends.
 -
 Ozone depletion decline.
 -
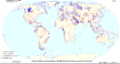
 Major greenhouse gas trends.
 -
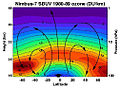
 Ozone levels in Antarctica. (JPEG version)
 -
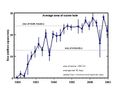 Ozone hole area.
 -
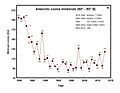 Minimum ozone levels.
 -
 Diurnal ionospheric current.
 -
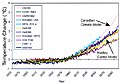
 MBH98 Warming Graph. Northern Hemisphere temperature variations.
 -
 Global temperature.
 -
 Solar forcing GISS model.


Below
-
 World petroleum systems.
 -
 Geothermal energy diagram.
 -
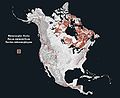
 Geothermal hot springs in the United States.
 -
 Heat Flow Contours of the United States.
 -
 The geothermal resources map of the United States.
 -
 US continuous hydrocarbon reservoirs.
 -
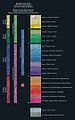
 Legend for US coal map.
 -
 US coal regions and provinces.
 -
 World geologic provinces.
 -
 Pu‘u ‘Ō‘ō eruption cutaway.
 -
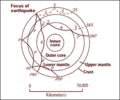 Mapping the interior of the Earth with earthquake waves.
 -
 Hawaii national parks.
 -
 Volcanic injection effects.
 -
 Volcanic crust cutaway.
 -
 Stratovolcano
 -
 Shield volcano
 -
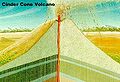 Cinder cone
 -
 Ocean gravity map.
 -
 World oil endowment.


Miscellaneous
-
 Sheet pile material.
 -
 Medical evacuation after Katrina.
 -
 President Bush visits Biloxi after hurricane Katrina.
 -
 Iowa Pleistocene Snail ( Discus macclintocki)
 -
 Iowa Pleistocene Snail, Endangered.
 -
 Feral cat
 -
 White phase, Northern wild monkshood ( Aconitum noveboracense)
 -
 Purple phase, Northern wild monkshood ( Aconitum noveboracense)
 -
 Spectrum of common lasers.
 -
 orthicon tube.
 -
 vidicon tube.
 -

-


_scheme.png)


Images uploaded by SEWilco
Up
-
Indonesian smoke.
-
Sumatra fires, particularly peat fires.
-
Wolf number since 1750.
-
Atmospheric absorption.
-
Brewer-Dobson circulation in the ozone layer.
-
Ozone-oxygen cycle in the ozone layer.
-
Ozone energies at several altitudes.
-
Levels of ozone at various altitudes and blocking of ultraviolet radiation.
-
Solar radiation above the atmosphere and at the surface.
-
Launch of Meteor-3.
-
Meteor-3
-
Solar irradiance spectrum.
-
Magnetosphere rendition.
-
-
-
Sunspots 11,400 years.
-
Sunspot butterfly diagram.
-
-
Earth precession.
-
Earth obliquity.
-
Eccentricity 0.5
-
Eccentricity zero
-
Orbital variation
Around
-
Hurricane Katrina main staging area, NO, LA.
-
Hurricane Katrina damage map.
-
TAPS where crosses Denali fault.
-
Position of Antarctica. You are not there.
-
North American craton.
-
-
-
-
-
-
-
-
Combined geologic and shaded relief map of North America.
-
North American cratons and basement rocks. (replaced when User:Berkut found higher resolution image)
-
Surface of the Earth
-
Age of seafloor crust
-
Age of seafloor crust
-
Magnetic declination.
-
Recent paleomagnetism.
-
Cenozoic paleomagnetism.
-
Antarctica ice shelves.
Around Back
-
Atmospheric mercury deposition at Fremont glacier over 270 years.
-
Last glacial maximum vegetation.
-
Magnetic striping on spreading oceanic crust.
-
Fossil evidence of continental drift.
-
Generalized geographic map of the United States in Middle Pennsylvanian time.
-
Generalized geographic map of the United States in Late Cretaceous time.
-
The maximum extent of glacial ice in the north polar area during Pleistocene time.
-
Carbon 14 with activity labels.
-
Carbon 14 with sunspots since 1700.
-
Carbon 14 10,000 years with Hallstatt cycles.
-
Carbon 14 10,000 years.
Around Water
-
LCU 1656 leaves USS Bataan to LA.
-
Flexifloat in New Orleans canal.
-
Blackhawk dropping sandbag, September 4 2005.
-
17th Street Canal, September 4 2005.
-
Flooded buses in New Orleans.
-
USS Tortuga at dock in New Orleans.
-
New Orleans 17th Street Canal wall breach.
-
New Orleans levee break.
-
GISP2Vostok team -
GISP2 ice core layers
-
Glacier firn sampling
-
Arctic sea ice in spring
-
Sea ice extent trend for the Northern Hemisphere.
-
Ocean currents 1943
-
Fishing in warm water for cold-loving fish.
-
Fishing gear in southeast Pacific Ocean.
-
-
Chlorophyll growth due to nutrients mixed by 2001 winter jets
-
Sea level and temperatures 140 kyr.
-
-
ENSO normal pattern.
-
ENSO El Nino pattern.
-
ENSO La Nina pattern.
Around Air
-
Mid-1900s global cooling map.
-
Chlorine-36 in US ice.
-
CFCs in Greenland firn.
-
-
North America climate model annual precipitation
-
Climate model temperature forecasts
-
Climate model temperature anomalies
-
420,000 years of ice core data from Vostok, Antarctica research station.
-
Madden-Julian oscillation affects North American weather.
-
El Niño effects upon North American weather and atmospheric circulation.
-
Average equatorial Pacific Ocean temperatures.
-
During warm ENSO episodes the normal patterns of tropical precipitation and atmospheric circulation become disrupted.
-
During cold La Niña episodes the normal patterns of tropical precipitation and atmospheric circulation become disrupted.
-
-
-
Water vapor trend.
-
Volcanic SO2 events.
-
Mount Pinatubo SO2.
-
Mount Pinatubo ash and aerosol.
-
Dimming due to volcanoes.
-
Ozone depletion gas trends.
-
Ozone depletion decline.
-
Major greenhouse gas trends.
-
Ozone levels in Antarctica. (JPEG version)
-
Ozone hole area.
-
Minimum ozone levels.
-
Diurnal ionospheric current.
-
MBH98 Warming Graph. Northern Hemisphere temperature variations.
-
Global temperature.
-
Solar forcing GISS model.
Below
-
World petroleum systems.
-
Geothermal energy diagram.
-
Geothermal hot springs in the United States.
-
Heat Flow Contours of the United States.
-
The geothermal resources map of the United States.
-
US continuous hydrocarbon reservoirs.
-
Legend for US coal map.
-
US coal regions and provinces.
-
World geologic provinces.
-
Pu‘u ‘Ō‘ō eruption cutaway.
-
Mapping the interior of the Earth with earthquake waves.
-
Hawaii national parks.
-
Volcanic injection effects.
-
Volcanic crust cutaway.
-
Stratovolcano
-
Shield volcano
-
Cinder cone
-
Ocean gravity map.
-
World oil endowment.
Miscellaneous
-
Sheet pile material.
-
Medical evacuation after Katrina.
-
President Bush visits Biloxi after hurricane Katrina.
-
Iowa Pleistocene Snail ( Discus macclintocki)
-
Iowa Pleistocene Snail, Endangered.
-
Feral cat
-
White phase, Northern wild monkshood ( Aconitum noveboracense)
-
Purple phase, Northern wild monkshood ( Aconitum noveboracense)
-
Spectrum of common lasers.
-
orthicon tube.
-
vidicon tube.
-
-