EuGeraldgop: c83747ff
dem: 4894a7ff
| |||||||||||||
| |||||||||||||
.jpg)
.jpg)
| |||||||||||||||||||||||||||||||||||||||||||||||||||||||||||||
538 members of the Electoral College 270 electoral votes needed to win | |||||||||||||||||||||||||||||||||||||||||||||||||||||||||||||
|---|---|---|---|---|---|---|---|---|---|---|---|---|---|---|---|---|---|---|---|---|---|---|---|---|---|---|---|---|---|---|---|---|---|---|---|---|---|---|---|---|---|---|---|---|---|---|---|---|---|---|---|---|---|---|---|---|---|---|---|---|---|
| |||||||||||||||||||||||||||||||||||||||||||||||||||||||||||||
 Presidential election results map. Blue denotes those won by Clinton/Bayh, light green denotes those won by Perot/Wilson, red denotes states won by Bush/Sovern. Numbers indicate the number of electoral votes allotted to each state. | |||||||||||||||||||||||||||||||||||||||||||||||||||||||||||||
| |||||||||||||||||||||||||||||||||||||||||||||||||||||||||||||
.jpg)

.jpg)
carter 88
| |||||||||||||||||||||||||||||
538 members of the Electoral College 270 electoral votes needed to win | |||||||||||||||||||||||||||||
|---|---|---|---|---|---|---|---|---|---|---|---|---|---|---|---|---|---|---|---|---|---|---|---|---|---|---|---|---|---|
| Turnout | 52.8%
[1] | ||||||||||||||||||||||||||||
| |||||||||||||||||||||||||||||
 Presidential election results map. Red denotes states won by Bush/Quayle and blue denotes those won by Carter/Jackson. Numbers indicate
electoral votes cast by each state and the District of Columbia. | |||||||||||||||||||||||||||||
| |||||||||||||||||||||||||||||
.jpg)

This article needs additional citations for
verification. (June 2016) |
| |||||||||||||||||
| |||||||||||||||||
 County results Harris: 50–60% 60–70% 70–80% 80–90% >90% Bell: 50–60% | |||||||||||||||||
| |||||||||||||||||


The 1982 Georgia gubernatorial election was held on November 2, 1982. Joe Frank Harris was elected as the 78th Governor of Georgia.
tx:
connally/anderson: 10
connally/crane: 4
connally/biden: 2
mcgovern/bush: 3
reagan/bush: 1
connally/dole: 8
perot/bush: 1
connally: 24
mcgovern: 3
reagan: 1
perot: 1
anderson: 10
dole: 8
crane: 4
bush: 5
biden: 2
| |||||||||||||||||
| |||||||||||||||||
 County results Fowler: 50–60% 60–70% 70–80% Mattingly: 50–60% 60–70% | |||||||||||||||||
| |||||||||||||||||

swagballer69
| |||||||||||||||||||||||||
| |||||||||||||||||||||||||


Abominable Snowman | |||||||||||||||||||||||||

_(cropped).jpg)
_(cropped).jpg)
The 2020 Iowa Republican presidential caucuses took place on Monday, February 3, 2020, as the first caucus or primary in the Republican Party presidential primaries for the 2020 presidential election. [3] The Iowa caucuses are a closed caucus, with Iowa awarding 40 pledged delegates to the Republican National Convention, allocated on the basis of the results of the caucuses. Incumbent president Donald Trump received about 97 percent of the vote to clinch 39 delegates, while Bill Weld received enough votes to clinch 1 delegate.
| Beaver | 49.3% | 24.1% | 30.4% |
| Box Elder | 49.6% | 38.4% | 12.3% |
| Cache | 52.0% | 34.6% | 15.0% |
| Carbon | 23.1% | 31.2% | 49.6% |
| Daggett | 38.9% | 35.0% | 26.4% |
| Davis | 48.1% | 38.1% | 17.2% |
| Duchesne | 43.4% | 35.4% | 14.7% |
| Emery | 36.4% | 33.7% | 27.7% |
| Garfield | 62.3% | 26.4% | 13.4% |
| Grand | 32.9% | 38.2% | 32.5% |
| Iron | 59.9% | 26.6% | 14.2% |
| Juab | 42.7% | 27.8% | 26.2% |
| Kane | 57.1% | 33.1% | 11.4% |
| Millard | 52.3% | 30.8% | 13.4% |
| Morgan | 45.5% | 37.5% | 15.5% |
| Piute | 57.0% | 27.9% | 21.2% |
| Rich | 59.9% | 30.0% | 16.4% |
| Salt Lake | 36.8% | 37.4% | 30.2% |
| San Juan | 46.2% | 21.8% | 36.6% |
| Sanpete | 44.8% | 34.6% | 18.3% |
| Sevier | 50.5% | 35.2% | 11.4% |
| Summit | 33.3% | 41.1% | 31.4% |
| Tooele | 35.8% | 37.8% | 30.6% |
| Uintah | 45.1% | 37.1% | 16.5% |
| Utah | 56.8% | 31.2% | 11.8% |
| Wasatch | 42.1% | 37.0% | 23.8% |
| Washington | 52.7% | 30.0% | 14.5% |
| Wayne | 57.6% | 29.0% | 18.1% |
| Weber | 39.3% | 38.6% | 24.9% |
| Totals | 29.1% | 44.3% | 22.3% |
|---|
| Nebraska † | 28.2 | 32.3 | 32.1 |
| Nebraska-1 | 31.4 | 28.9 | 32.7 |
| Nebraska-2 | 31.2 | 33.2 | 28.6 |
| Nebraska-3 | 22.3 | 35.4 | 35.3 |
- ^ "National General Election VEP Turnout Rates, 1789-Present". United States Election Project. CQ Press.
- ^ Matthew Choi (October 31, 2019). "Trump, a symbol of New York, is officially a Floridian now". Politico. Retrieved February 3, 2020.
- ^ Forgey, Quint (February 3, 2020). "Trump wins Iowa GOP caucuses". Politico. Retrieved February 3, 2020.
| ||
538 members of the Electoral College 270 electoral votes needed to win | ||
|---|---|---|
|
| ||
nigh
| |||||||||||||||||||||||||||||
538 members of the Electoral College 270 electoral votes needed to win | |||||||||||||||||||||||||||||
|---|---|---|---|---|---|---|---|---|---|---|---|---|---|---|---|---|---|---|---|---|---|---|---|---|---|---|---|---|---|
| |||||||||||||||||||||||||||||
Presidential election results map. Brown denotes states won by Nigh/Graham and orange denotes those won by Laxalt/Cheney. Numbers indicate
electoral votes cast by each state and the District of Columbia. | |||||||||||||||||||||||||||||
| |||||||||||||||||||||||||||||
jawn
| |||||||||||||||||||||||||||||
538 members of the Electoral College 270 electoral votes needed to win | |||||||||||||||||||||||||||||
|---|---|---|---|---|---|---|---|---|---|---|---|---|---|---|---|---|---|---|---|---|---|---|---|---|---|---|---|---|---|
| |||||||||||||||||||||||||||||
Presidential election results map. Brown denotes states won by Nigh/Graham and orange denotes those won by Perot/du Pont. Numbers indicate
electoral votes cast by each state and the District of Columbia. | |||||||||||||||||||||||||||||
| |||||||||||||||||||||||||||||
| |||||||||||||||||||||||||||||
538 members of the Electoral College 270 electoral votes needed to win | |||||||||||||||||||||||||||||
|---|---|---|---|---|---|---|---|---|---|---|---|---|---|---|---|---|---|---|---|---|---|---|---|---|---|---|---|---|---|
| |||||||||||||||||||||||||||||
Presidential election results map. Red denotes states won by Pataki/Bush and blue denotes those won by Pence/Bumpers. Numbers indicate
electoral votes cast by each state and the District of Columbia. | |||||||||||||||||||||||||||||
| |||||||||||||||||||||||||||||
ford 80
| |||||||||||||||||||||||||||||||||||||
538 members of the Electoral College 270 electoral votes needed to win | |||||||||||||||||||||||||||||||||||||
|---|---|---|---|---|---|---|---|---|---|---|---|---|---|---|---|---|---|---|---|---|---|---|---|---|---|---|---|---|---|---|---|---|---|---|---|---|---|
| Turnout | 54.2%
[1] | ||||||||||||||||||||||||||||||||||||
| |||||||||||||||||||||||||||||||||||||
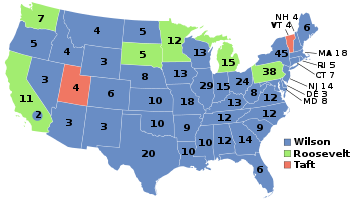
 Presidential election results map. Blue denotes states won by Ford/Connally and green denotes those won by Carter/Mondale. Olive denotes the five electoral votes for Perot/Boren by Texas
faithless electors. Numbers indicate
electoral votes cast by each state. | |||||||||||||||||||||||||||||||||||||
| |||||||||||||||||||||||||||||||||||||
.jpg)
| |||||||||||||||||||||||||||||
538 members of the Electoral College 270 electoral votes needed to win | |||||||||||||||||||||||||||||
|---|---|---|---|---|---|---|---|---|---|---|---|---|---|---|---|---|---|---|---|---|---|---|---|---|---|---|---|---|---|
| Turnout | 54.2%
[2] | ||||||||||||||||||||||||||||
| |||||||||||||||||||||||||||||
Presidential election results map. Blue denotes those won by Carter/Mondale and Red denotes states won by Ford/Dole. Numbers indicate
electoral votes cast by each state. | |||||||||||||||||||||||||||||
| |||||||||||||||||||||||||||||

| |||||||||||||||||||||||||||||
538 members of the Electoral College 270 electoral votes needed to win | |||||||||||||||||||||||||||||
|---|---|---|---|---|---|---|---|---|---|---|---|---|---|---|---|---|---|---|---|---|---|---|---|---|---|---|---|---|---|
| Turnout | 54.2%
[3] | ||||||||||||||||||||||||||||
| |||||||||||||||||||||||||||||
Presidential election results map. Red denotes states won by Ford/Connally and blue denotes those won by Carter/Mondale. Orange denotes the five electoral votes for Connally/Ford by Texas
faithless electors. Numbers indicate
electoral votes cast by each state. | |||||||||||||||||||||||||||||
| |||||||||||||||||||||||||||||

| |||||||||||||||||||||||||||||
538 members of the Electoral College 270 electoral votes needed to win | |||||||||||||||||||||||||||||
|---|---|---|---|---|---|---|---|---|---|---|---|---|---|---|---|---|---|---|---|---|---|---|---|---|---|---|---|---|---|
| Turnout | 55.2%
[5] | ||||||||||||||||||||||||||||
| |||||||||||||||||||||||||||||
 Presidential election results map. Red denotes states won by Connally/Bush and blue denotes those won by McGovern/Biden. Light red and tan are the electoral votes for Reagan/Bush and Bush/None
[b], respectively, by Texas
faithless electors, reflecting the
1984 Texas vice presidential electors controversy. Numbers indicate
electoral votes cast by each state and the District of Columbia. | |||||||||||||||||||||||||||||
| |||||||||||||||||||||||||||||

.jpg)
| |||||||||||||||||||||||||||||||||||||||||||||||||||||||||||||
538 members of the Electoral College 270 votes needed to win | |||||||||||||||||||||||||||||||||||||||||||||||||||||||||||||
|---|---|---|---|---|---|---|---|---|---|---|---|---|---|---|---|---|---|---|---|---|---|---|---|---|---|---|---|---|---|---|---|---|---|---|---|---|---|---|---|---|---|---|---|---|---|---|---|---|---|---|---|---|---|---|---|---|---|---|---|---|---|
| Opinion polls | |||||||||||||||||||||||||||||||||||||||||||||||||||||||||||||
| |||||||||||||||||||||||||||||||||||||||||||||||||||||||||||||
Vice presidential election results map. Red denotes electors who voted for Bush, blue denotes electors who voted for Biden, and light red denotes electors who voted for Anderson. Orange, yellow, and pink are the electoral votes cast for Dole, Crane and Agnew, respectively, by Texas
faithless electors, reflecting the
1984 Texas vice presidential electors controversy. Numbers indicate
electoral votes cast by each state and the District of Columbia. | |||||||||||||||||||||||||||||||||||||||||||||||||||||||||||||

.jpg)
.jpg)


| Agnew v. Texas | |
|---|---|
 | |
| Argued November 29, 1984 Decided December 5, 1984 | |
| Full case name | Spiro Agnew, John B. Anderson, Joseph Biden, Jr., Robert Dole, Phillip Crane, petitioners v. Texas |
| Holding | |
| Electors could not be forced to abstain if one of their pledged candidates is not constitutionally eligible to receive their votes. | |
| Court membership | |
| |
| |||||||||||||||||||||||||||||
538 members of the Electoral College 270 electoral votes needed to win | |||||||||||||||||||||||||||||
|---|---|---|---|---|---|---|---|---|---|---|---|---|---|---|---|---|---|---|---|---|---|---|---|---|---|---|---|---|---|
| Turnout | 54.2%
[6] | ||||||||||||||||||||||||||||
| |||||||||||||||||||||||||||||
Presidential election results map. Red denotes those won by Connally/Bush and blue denotes states won by Dodd/Applegate. Texas electors cast votes for Connally for both President and Vice President. Numbers indicate
electoral votes cast by each state. | |||||||||||||||||||||||||||||
| |||||||||||||||||||||||||||||

.JPEG)
| |||||||||||||||||||||||||||||
538 members of the Electoral College 270 electoral votes needed to win | |||||||||||||||||||||||||||||
|---|---|---|---|---|---|---|---|---|---|---|---|---|---|---|---|---|---|---|---|---|---|---|---|---|---|---|---|---|---|
| Turnout | 58.1%
[7] | ||||||||||||||||||||||||||||
| |||||||||||||||||||||||||||||
 Presidential election results map. Blue denotes states won by Clinton/Gore and red denotes those won by Bush/Quayle. Numbers indicate
electoral votes cast by each state and the District of Columbia. | |||||||||||||||||||||||||||||
| |||||||||||||||||||||||||||||
.jpg)
.jpg)
Presidents
| No. [e] | |||||||
|---|---|---|---|---|---|---|---|
| 37 |
.jpg)
|
Richard Nixon (1913–1994) [8] |
January 20, 1969 – August 9, 1974 [f] |
Republican |
1968
|
Spiro Agnew
[f]
Vacant: | |
| 38 |
.jpg)
|
Gerald Ford (1913–2006) [10] |
August 9, 1974
[h] – January 20, 1977 |
Republican | – | Vacant through December 19, 1974 | |
| 39 |
|
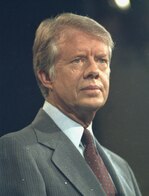
Jimmy Carter ( b. 1924) [11] |
January 20, 1977 – January 20, 1981 |
Democratic | 1976 | Walter Mondale | |
| 40 |
.jpg)
|
Gerald Ford (1913–2006) [12] |
January 20, 1981 – January 20, 1985 |
Republican | 1980 | John Connally | |
| 41 |
|
John Connally (1917–1991) [8] |
January 20, 1985 – July 17, 1989 [f] |
Republican |
1984
|
George H. W. Bush | |
| 42 |
|
George H. W. Bush (1924–2018) [8] |
July 17, 1989 – January 20, 1993 |
Republican | – | Vacant through October 24, 1989 | |
| 43 |
|
Gary Hart (b. 1936) |
January 20, 1993 – January 20, 2001 |
Democratic |
1992
|
David Boren |
| |||||||||||||||||||||||||||||||||
| |||||||||||||||||||||||||||||||||
 County Results
Clinton 30-40% | |||||||||||||||||||||||||||||||||
| |||||||||||||||||||||||||||||||||
| |||||||||||||||||||||||||||||||||||||||||||||||||||||||||||||
3,346 delegates to the Democratic National Convention 1,674 delegates votes needed to win | |||||||||||||||||||||||||||||||||||||||||||||||||||||||||||||
|---|---|---|---|---|---|---|---|---|---|---|---|---|---|---|---|---|---|---|---|---|---|---|---|---|---|---|---|---|---|---|---|---|---|---|---|---|---|---|---|---|---|---|---|---|---|---|---|---|---|---|---|---|---|---|---|---|---|---|---|---|---|
| |||||||||||||||||||||||||||||||||||||||||||||||||||||||||||||
 | |||||||||||||||||||||||||||||||||||||||||||||||||||||||||||||
_(1).jpg)


| |||||||||||||||||||||||||||||||||||||
538 members of the Electoral College 270 electoral votes needed to win | |||||||||||||||||||||||||||||||||||||
|---|---|---|---|---|---|---|---|---|---|---|---|---|---|---|---|---|---|---|---|---|---|---|---|---|---|---|---|---|---|---|---|---|---|---|---|---|---|
| |||||||||||||||||||||||||||||||||||||
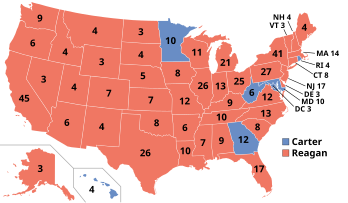
Presidential election results map. Red denotes states won by Reagan/Bush and blue denotes those won by Carter/Mondale. Numbers indicate
electoral votes cast by each state. | |||||||||||||||||||||||||||||||||||||
| |||||||||||||||||||||||||||||||||||||


.jpg)
| |||||||||||||||||||||||||||||
538 members of the Electoral College 270 electoral votes needed to win | |||||||||||||||||||||||||||||
|---|---|---|---|---|---|---|---|---|---|---|---|---|---|---|---|---|---|---|---|---|---|---|---|---|---|---|---|---|---|
| |||||||||||||||||||||||||||||
Presidential election results map. Blue denotes states won by Carter/Kerrey and red denotes those won by Ford/Rumsfeld. Numbers indicate
electoral votes cast by each state. | |||||||||||||||||||||||||||||
| |||||||||||||||||||||||||||||

| |||||||||||||||||||||||||||||
538 members of the Electoral College 270 electoral votes needed to win | |||||||||||||||||||||||||||||
|---|---|---|---|---|---|---|---|---|---|---|---|---|---|---|---|---|---|---|---|---|---|---|---|---|---|---|---|---|---|
| |||||||||||||||||||||||||||||
Presidential election results map. Blue denotes states won by Hart/Clark and red denotes those won by Bush/Cheney. Numbers indicate
electoral votes cast by each state. | |||||||||||||||||||||||||||||
| |||||||||||||||||||||||||||||
.jpg)
- ^ "National General Election VEP Turnout Rates, 1789-Present". United States Election Project. CQ Press.
- ^ "National General Election VEP Turnout Rates, 1789-Present". United States Election Project. CQ Press.
- ^ "National General Election VEP Turnout Rates, 1789-Present". United States Election Project. CQ Press.
-
^ Cite error: The named reference
laws2was invoked but never defined (see the help page). - ^ "National General Election VEP Turnout Rates, 1789-Present". United States Election Project. CQ Press.
- ^ "National General Election VEP Turnout Rates, 1789-Present". United States Election Project. CQ Press.
- ^ "National General Election VEP Turnout Rates, 1789-Present". United States Election Project. CQ Press.
- ^ a b c Hoff (b) (2000).
- ^ Neale (2004), p. 22.
- ^ a b Greene (2013).
- ^ whitehouse.gov (a).
- ^ Schaller (2004).
- ^ "DISENCHANTED". The Boston Globe. Boston, Massachusetts. July 1, 1980. Retrieved April 2, 2024.
- ^ "DISENCHANTED". The Boston Globe. Boston, Massachusetts. July 1, 1980. Retrieved April 2, 2024.
- ^ "DISENCHANTED". The Boston Globe. Boston, Massachusetts. July 1, 1980. Retrieved April 2, 2024.
- ^ "DISENCHANTED". The Boston Globe. Boston, Massachusetts. July 1, 1980. Retrieved April 2, 2024.
- ^ "DISENCHANTED". The Boston Globe. Boston, Massachusetts. July 1, 1980. Retrieved April 2, 2024.
prescott
| |||||||||||||||||||||||||||||||||||||
538 members of the Electoral College 270 electoral votes needed to win | |||||||||||||||||||||||||||||||||||||
|---|---|---|---|---|---|---|---|---|---|---|---|---|---|---|---|---|---|---|---|---|---|---|---|---|---|---|---|---|---|---|---|---|---|---|---|---|---|
| |||||||||||||||||||||||||||||||||||||
Presidential election results map. Red denotes states won by Bush/Romney, blue denotes those won by Muskie/Sanford, and purple denotes those won by Wallace/LeMay, including a North Carolina
faithless elector. Numbers indicate
electoral votes cast by each state. | |||||||||||||||||||||||||||||||||||||
| |||||||||||||||||||||||||||||||||||||

-cropped.jpg)
.jpg)
| |||||||||||||||||||||||||||||||||||||
538 members of the Electoral College 270 electoral votes needed to win | |||||||||||||||||||||||||||||||||||||
|---|---|---|---|---|---|---|---|---|---|---|---|---|---|---|---|---|---|---|---|---|---|---|---|---|---|---|---|---|---|---|---|---|---|---|---|---|---|
| |||||||||||||||||||||||||||||||||||||
Presidential election results map. Blue denotes states won by Harris/Moss, red denotes those won by Romney, yellow denotes those won by Gross/Crane, green denotes those won by Rhodes, brown denotes those won by Case, orange denotes those won by Bush/Romney, and pale red denotes those won by various other candidates; this reflects the posthumous scattering of Bush's electoral votes. Numbers indicate
electoral votes cast by each state. | |||||||||||||||||||||||||||||||||||||
| |||||||||||||||||||||||||||||||||||||

.jpg)
iran contra get bad
| |||||||||||||||||||||||||||||||||||||
538 members of the Electoral College 270 electoral votes needed to win | |||||||||||||||||||||||||||||||||||||
|---|---|---|---|---|---|---|---|---|---|---|---|---|---|---|---|---|---|---|---|---|---|---|---|---|---|---|---|---|---|---|---|---|---|---|---|---|---|
| |||||||||||||||||||||||||||||||||||||
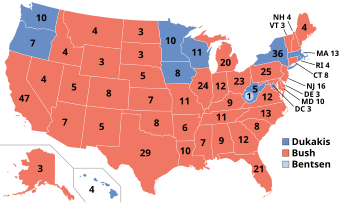
Presidential election results map. Blue denotes states won by Carter/Bentsen, red denotes those won by Quayle/Kemp and orange denotes those won by Bush/Cheney. Numbers indicate
electoral votes cast by each state. | |||||||||||||||||||||||||||||||||||||
| |||||||||||||||||||||||||||||||||||||
.jpg)
_(cropped).JPEG)
andy
| ||||||||||||||||||||||||||||||||
538 members of the Electoral College 270 electoral votes needed to win | ||||||||||||||||||||||||||||||||
|---|---|---|---|---|---|---|---|---|---|---|---|---|---|---|---|---|---|---|---|---|---|---|---|---|---|---|---|---|---|---|---|---|
| ||||||||||||||||||||||||||||||||
Presidential election results map. Purple denotes states won by Anderson/Carey and red denotes those won by Reagan/Bush. Numbers indicate
electoral votes cast by each state. | ||||||||||||||||||||||||||||||||
| ||||||||||||||||||||||||||||||||
.jpg)
.jpg)
ford terms
| |||||||||||||||||||||||||||||||||||||
538 members of the Electoral College 270 electoral votes needed to win | |||||||||||||||||||||||||||||||||||||
|---|---|---|---|---|---|---|---|---|---|---|---|---|---|---|---|---|---|---|---|---|---|---|---|---|---|---|---|---|---|---|---|---|---|---|---|---|---|
| |||||||||||||||||||||||||||||||||||||
Presidential election results map. Red denotes states won by Ford/Anderson, blue denotes those won by Wallace/Jackson, and green denotes those won by McCarthy/None. Numbers indicate
electoral votes cast by each state. | |||||||||||||||||||||||||||||||||||||
| |||||||||||||||||||||||||||||||||||||
.jpg)
.jpg)
| |||||||||||||||||||||||||||||
538 members of the Electoral College 270 electoral votes needed to win | |||||||||||||||||||||||||||||
|---|---|---|---|---|---|---|---|---|---|---|---|---|---|---|---|---|---|---|---|---|---|---|---|---|---|---|---|---|---|
| |||||||||||||||||||||||||||||
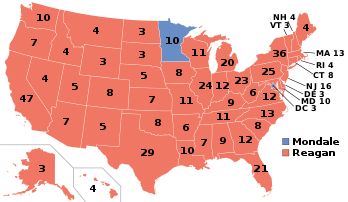
Presidential election results map. Red denotes states won by Ford/Anderson and blue denotes those won by Mondale/Muskie. Numbers indicate
electoral votes cast by each state. | |||||||||||||||||||||||||||||
| |||||||||||||||||||||||||||||
.jpg)
| No. [r] | Portrait | Name (Birth–Death) |
Term [1] | Party [s] [2] | Election | Vice President [3] | |
|---|---|---|---|---|---|---|---|
| 36 |

|
Lyndon B. Johnson (1908–1973) [4] |
November 22, 1963
[t] – January 20, 1969 |
Democratic | –
|
Vacant through January 20, 1965 | |
| 37 |
|
Richard Nixon (1913–1994) [6] |
January 20, 1969 – February 17, 1975 [f] |
Republican |
1968
|
Spiro Agnew
[f]
Vacant: | |
| 38 |
.jpg)
|
Gerald Ford (1913–2006) [8] |
February 17, 1975
[u] – January 20, 1985 |
Republican | –
1976 1980 |
Vacant through May 28, 1975 John B. Anderson | |
| Impeachment process against Richard Nixon | |
|---|---|
 First day of the House Judiciary Committee's formal impeachment hearings against President Nixon, November 18, 1974 | |
| Accused | Richard Nixon, President of the United States |
| Proponents | United States House Committee on the Judiciary |
| Date | May 10, 1974 to February 28, 1975 (3 months, 1 week and 3 days) |
| Outcome | Resolution containing three articles of impeachment adopted February 7, 1975; the impeachment proceedings ended on February 28, 1975, without an impeachment vote, after President Nixon resigned from office. [9] [10] |
| Charges | Adopted:
obstruction of justice,
abuse of power,
contempt of Congress Rejected: usurping congressional war powers, tax fraud |
| ||
|---|---|---|
|
76th Governor of Georgia
39th President of the United States
Policies
Appointments
Tenure
Presidential campaigns Post-presidency
 |
||


 | |||||||||||||||||||||||||||
| George Wallace | Henry M. Jackson | ||||||||||||||||||||||||||
|---|---|---|---|---|---|---|---|---|---|---|---|---|---|---|---|---|---|---|---|---|---|---|---|---|---|---|---|
| for President | for Vice President | ||||||||||||||||||||||||||
 |
 | ||||||||||||||||||||||||||
| 45th and 48th Governor of Alabama (1963-1967, 1971–1979) |
U.S. Senator from Washington (1953–1983) | ||||||||||||||||||||||||||
| Campaign | |||||||||||||||||||||||||||
 | |||||||||||||||||||||||||||||
| Gerald Ford | John B. Anderson | ||||||||||||||||||||||||||||
|---|---|---|---|---|---|---|---|---|---|---|---|---|---|---|---|---|---|---|---|---|---|---|---|---|---|---|---|---|---|
| for President | for Vice President | ||||||||||||||||||||||||||||
.jpg) |
 | ||||||||||||||||||||||||||||
|
38th President of the United States (1975–1985) |
42nd Vice President of the United States (1977–1985) | ||||||||||||||||||||||||||||
| Campaign | |||||||||||||||||||||||||||||
- ^ a b c jawn
- ^ a b jhawn
- ^ a b jdawn
- ^ Elections were held in Arkansas and Louisiana; however, due to various irregularities including allegations of electoral fraud, all electoral votes from those states (6 and 8, respectively) were invalidated.
- ^ Presidents are numbered according to uninterrupted periods served by the same person. For example, George Washington served two consecutive terms and is counted as the first president (not the first and second). Upon the resignation of 37th president, Richard Nixon, Gerald Ford became the 38th president even though he simply served out the remainder of Nixon's second term and was never elected to the presidency in his own right. Grover Cleveland was both the 22nd president and the 24th president because his two terms were not consecutive. A vice president who temporarily becomes acting president under the Twenty-fifth Amendment to the Constitution is not counted, because the president remains in office during such a period.
- ^
a
b
c
d
e
f Cite error: The named reference
resignedintratermwas invoked but never defined (see the help page). - ^ a b c d Appointed as vice president under terms of the Twenty-fifth Amendment, Section 2 [9] Cite error: The named reference "VP25th" was defined multiple times with different content (see the help page).
- ^ Gerald Ford succeeded to the presidency upon the resignation of Richard Nixon. [10]
- ^ This is an estimate provided by the source.
- ^ This is an estimate provided by the source.
- ^ This is an estimate provided by the source.
- ^ This is an estimate provided by the source.
- ^ While there were technically 773 delegates that went to the convention unnbound, they presumably cast their support for the president
- ^ This is an estimate provided by the source.
- ^ In some states labeled as National Unity, Anderson Coalition, Anderson Alternative or "Anderson for President"
- ^ In Alabama he was also on the Ballot as the Democratic Party Candidate, and in other states, although he won electoral votes from none of them, he appeared under various other Labels such as "George Wallace Party" "Courage Party" "American Party" and as an independent candidate.
- ^ In some states labeled as National Unity, Anderson Coalition, Anderson Alternative or "Anderson for President"
- ^ Presidents are numbered according to uninterrupted periods served by the same person. For example, George Washington served two consecutive terms and is counted as the first president (not the first and second). Upon the resignation of 37th president, Richard Nixon, Gerald Ford became the 38th president even though he simply served out the remainder of Nixon's second term and was never elected to the presidency in his own right. Grover Cleveland was both the 22nd president and the 24th president because his two terms were not consecutive. A vice president who temporarily becomes acting president under the Twenty-fifth Amendment to the Constitution is not counted, because the president remains in office during such a period.
- ^ Reflects the president's political party at the start of their presidency. Changes during their time in office are noted. Also reflects the vice president's political party unless otherwise noted beside the individual's name.
- ^ Lyndon B. Johnson succeeded to the presidency upon the death of John F. Kennedy. [5]
- ^ Gerald Ford succeeded to the presidency upon the resignation of Richard Nixon. [8]
| 1976 independent ticket |
| Eugene McCarthy |
|---|
| for President |

|
| U.S. Senator from Minnesota (1959–1971) |
| ||
|---|---|---|
|
76th Governor of Georgia
39th President of the United States
Policies
Appointments
Tenure
Presidential campaigns Post-presidency
|
||
| |||||||||||||||||||||||||||||
| Walter Mondale | Edmund Muskie | ||||||||||||||||||||||||||||
|---|---|---|---|---|---|---|---|---|---|---|---|---|---|---|---|---|---|---|---|---|---|---|---|---|---|---|---|---|---|
| for President | for Vice President | ||||||||||||||||||||||||||||
|
| ||||||||||||||||||||||||||||
|
U.S. Senator from Minnesota (1964–2009) |
U.S. Senator from Maine (1959–1983) | ||||||||||||||||||||||||||||
| Campaign | |||||||||||||||||||||||||||||
| |||||||||||||||||||||||||||||||||||||||||||||||||||||||||||||
3,010 delegates to the 1976 Democratic National Convention 1,506 (majority) votes needed to win | |||||||||||||||||||||||||||||||||||||||||||||||||||||||||||||
|---|---|---|---|---|---|---|---|---|---|---|---|---|---|---|---|---|---|---|---|---|---|---|---|---|---|---|---|---|---|---|---|---|---|---|---|---|---|---|---|---|---|---|---|---|---|---|---|---|---|---|---|---|---|---|---|---|---|---|---|---|---|
| |||||||||||||||||||||||||||||||||||||||||||||||||||||||||||||


Wallace Jackson Udall Brown Humphrey Church Byrd Uncommitted | |||||||||||||||||||||||||||||||||||||||||||||||||||||||||||||
| |||||||||||||||||||||||||||||||||||||||||||||||||||||||||||||
_(3x4).jpg)


.jpg)


| ||||||||||||||||||||||
2,259 delegates to the Republican National Convention 1,130 votes needed to win | ||||||||||||||||||||||
|---|---|---|---|---|---|---|---|---|---|---|---|---|---|---|---|---|---|---|---|---|---|---|
| ||||||||||||||||||||||


Ford | ||||||||||||||||||||||
| ||||||||||||||||||||||
| Poll source | Date(s) administered |
Gerald Ford (R) | George Wallace (D) | Eugene McCarthy (I) | Undecided | Margin |
|---|---|---|---|---|---|---|
| ABC-Harris [11] | October 3–6, 1980 | 49% | 14% | 31% | 6% | 18 |
| Gallup [12] | October 10–12, 1980 | 48% | 18% | 27% | 7% | 21 |
| ABC-Harris [13] | October 14–16, 1980 | 50% | 22% | 24% | 4% | 26 |
| ABC-Harris [14] | October 22–25, 1980 | 49% | 24% | 21% | 6% | 25 |
| Washington Post [15] | October 26–27, 1980 | 51% | 26% | 19% | 4% | 25 |
| Newsweek-Gallup [15] | October 29–30, 1980 | 50% | 27% | 20% | 3% | 23 |
| |||||||||||||||||||||||||||||||||||||||||||||||||||||||||||||
3,346 delegates to the 1980 Democratic National Convention 1,674 delegates votes needed to win | |||||||||||||||||||||||||||||||||||||||||||||||||||||||||||||
|---|---|---|---|---|---|---|---|---|---|---|---|---|---|---|---|---|---|---|---|---|---|---|---|---|---|---|---|---|---|---|---|---|---|---|---|---|---|---|---|---|---|---|---|---|---|---|---|---|---|---|---|---|---|---|---|---|---|---|---|---|---|
| |||||||||||||||||||||||||||||||||||||||||||||||||||||||||||||
|
Mondale Kennedy Carter Brown Finch Udall Uncommitted | |||||||||||||||||||||||||||||||||||||||||||||||||||||||||||||
| |||||||||||||||||||||||||||||||||||||||||||||||||||||||||||||


| |||||||||||||||||||||||||||||
1,990 delegates to the 1980 Republican National Convention 996 (majority) votes needed to win | |||||||||||||||||||||||||||||
|---|---|---|---|---|---|---|---|---|---|---|---|---|---|---|---|---|---|---|---|---|---|---|---|---|---|---|---|---|---|
| |||||||||||||||||||||||||||||
|
| |||||||||||||||||||||||||||||
| |||||||||||||||||||||||||||||
.jpg)
| Assassination of Ronald Reagan | |
|---|---|
 Reagan addresses a crowd of supporters minutes before he is shot. Reagan had been campaigning ahead of the upcoming California primary, which still took place two days later. | |
| Location | Topanga Plaza, Canoga Park, California, United States |
| Date | June 1, 1980 1:48 p.m. ( Pacific Time) |
| Target | Ronald Reagan |
Attack type | Assassination, shooting |
| Weapons | Röhm RG-14 |
| Deaths | Ronald Reagan |
| Injured | 3 |
| Perpetrator | John Hinckley Jr. |
| Motive | Attempt to gain the attention of Jodie Foster; mental illness |
| Verdict | Not guilty by reason of insanity |
- ^ LOC; whitehouse.gov.
- ^ Guide to U.S. Elections (2010), pp. 257–258.
- ^ LOC.
- ^ Gardner (2000).
- ^ Abbott (2005), p. 633.
- ^ Hoff (b) (2000).
- ^ Neale (2004), p. 22.
- ^ a b Greene (2013).
-
^ Cite error: The named reference
nyt-no-impeachmentwas invoked but never defined (see the help page). - ^ Stathis & Huckabee 1998.
- ^ "Poll Reveals 3-Point Slip By Anderson". Tarrytown Daily News.
- ^ "Reagan Holds Narrow Lead; Anderson Dips". The Knoxville News-Sentinel.
- ^ "Poll Reveals 3-Point Slip By Anderson". The Buffalo News.
- ^ "Reagan, Carter In Tight Fight". Florida Today.
- ^ a b "Polls Say Its Going Down To The Wire". The Miami Herald.
EuGeraldgop: c83747ff
dem: 4894a7ff
| |||||||||||||
| |||||||||||||
| |||||||||||||||||||||||||||||||||||||||||||||||||||||||||||||
538 members of the Electoral College 270 electoral votes needed to win | |||||||||||||||||||||||||||||||||||||||||||||||||||||||||||||
|---|---|---|---|---|---|---|---|---|---|---|---|---|---|---|---|---|---|---|---|---|---|---|---|---|---|---|---|---|---|---|---|---|---|---|---|---|---|---|---|---|---|---|---|---|---|---|---|---|---|---|---|---|---|---|---|---|---|---|---|---|---|
| |||||||||||||||||||||||||||||||||||||||||||||||||||||||||||||
Presidential election results map. Blue denotes those won by Clinton/Bayh, light green denotes those won by Perot/Wilson, red denotes states won by Bush/Sovern. Numbers indicate the number of electoral votes allotted to each state. | |||||||||||||||||||||||||||||||||||||||||||||||||||||||||||||
| |||||||||||||||||||||||||||||||||||||||||||||||||||||||||||||
carter 88
| |||||||||||||||||||||||||||||
538 members of the Electoral College 270 electoral votes needed to win | |||||||||||||||||||||||||||||
|---|---|---|---|---|---|---|---|---|---|---|---|---|---|---|---|---|---|---|---|---|---|---|---|---|---|---|---|---|---|
| Turnout | 52.8%
[1] | ||||||||||||||||||||||||||||
| |||||||||||||||||||||||||||||
Presidential election results map. Red denotes states won by Bush/Quayle and blue denotes those won by Carter/Jackson. Numbers indicate
electoral votes cast by each state and the District of Columbia. | |||||||||||||||||||||||||||||
| |||||||||||||||||||||||||||||
This article needs additional citations for
verification. (June 2016) |
| |||||||||||||||||
| |||||||||||||||||
County results Harris: 50–60% 60–70% 70–80% 80–90% >90% Bell: 50–60% | |||||||||||||||||
| |||||||||||||||||
The 1982 Georgia gubernatorial election was held on November 2, 1982. Joe Frank Harris was elected as the 78th Governor of Georgia.
tx:
connally/anderson: 10
connally/crane: 4
connally/biden: 2
mcgovern/bush: 3
reagan/bush: 1
connally/dole: 8
perot/bush: 1
connally: 24
mcgovern: 3
reagan: 1
perot: 1
anderson: 10
dole: 8
crane: 4
bush: 5
biden: 2
| |||||||||||||||||
| |||||||||||||||||
County results Fowler: 50–60% 60–70% 70–80% Mattingly: 50–60% 60–70% | |||||||||||||||||
| |||||||||||||||||
swagballer69
| |||||||||||||||||||||||||
| |||||||||||||||||||||||||
|
Abominable Snowman | |||||||||||||||||||||||||
The 2020 Iowa Republican presidential caucuses took place on Monday, February 3, 2020, as the first caucus or primary in the Republican Party presidential primaries for the 2020 presidential election. [3] The Iowa caucuses are a closed caucus, with Iowa awarding 40 pledged delegates to the Republican National Convention, allocated on the basis of the results of the caucuses. Incumbent president Donald Trump received about 97 percent of the vote to clinch 39 delegates, while Bill Weld received enough votes to clinch 1 delegate.
| Beaver | 49.3% | 24.1% | 30.4% |
| Box Elder | 49.6% | 38.4% | 12.3% |
| Cache | 52.0% | 34.6% | 15.0% |
| Carbon | 23.1% | 31.2% | 49.6% |
| Daggett | 38.9% | 35.0% | 26.4% |
| Davis | 48.1% | 38.1% | 17.2% |
| Duchesne | 43.4% | 35.4% | 14.7% |
| Emery | 36.4% | 33.7% | 27.7% |
| Garfield | 62.3% | 26.4% | 13.4% |
| Grand | 32.9% | 38.2% | 32.5% |
| Iron | 59.9% | 26.6% | 14.2% |
| Juab | 42.7% | 27.8% | 26.2% |
| Kane | 57.1% | 33.1% | 11.4% |
| Millard | 52.3% | 30.8% | 13.4% |
| Morgan | 45.5% | 37.5% | 15.5% |
| Piute | 57.0% | 27.9% | 21.2% |
| Rich | 59.9% | 30.0% | 16.4% |
| Salt Lake | 36.8% | 37.4% | 30.2% |
| San Juan | 46.2% | 21.8% | 36.6% |
| Sanpete | 44.8% | 34.6% | 18.3% |
| Sevier | 50.5% | 35.2% | 11.4% |
| Summit | 33.3% | 41.1% | 31.4% |
| Tooele | 35.8% | 37.8% | 30.6% |
| Uintah | 45.1% | 37.1% | 16.5% |
| Utah | 56.8% | 31.2% | 11.8% |
| Wasatch | 42.1% | 37.0% | 23.8% |
| Washington | 52.7% | 30.0% | 14.5% |
| Wayne | 57.6% | 29.0% | 18.1% |
| Weber | 39.3% | 38.6% | 24.9% |
| Totals | 29.1% | 44.3% | 22.3% |
|---|
| Nebraska † | 28.2 | 32.3 | 32.1 |
| Nebraska-1 | 31.4 | 28.9 | 32.7 |
| Nebraska-2 | 31.2 | 33.2 | 28.6 |
| Nebraska-3 | 22.3 | 35.4 | 35.3 |
- ^ "National General Election VEP Turnout Rates, 1789-Present". United States Election Project. CQ Press.
- ^ Matthew Choi (October 31, 2019). "Trump, a symbol of New York, is officially a Floridian now". Politico. Retrieved February 3, 2020.
- ^ Forgey, Quint (February 3, 2020). "Trump wins Iowa GOP caucuses". Politico. Retrieved February 3, 2020.
| ||
538 members of the Electoral College 270 electoral votes needed to win | ||
|---|---|---|
|
| ||
nigh
| |||||||||||||||||||||||||||||
538 members of the Electoral College 270 electoral votes needed to win | |||||||||||||||||||||||||||||
|---|---|---|---|---|---|---|---|---|---|---|---|---|---|---|---|---|---|---|---|---|---|---|---|---|---|---|---|---|---|
| |||||||||||||||||||||||||||||
Presidential election results map. Brown denotes states won by Nigh/Graham and orange denotes those won by Laxalt/Cheney. Numbers indicate
electoral votes cast by each state and the District of Columbia. | |||||||||||||||||||||||||||||
| |||||||||||||||||||||||||||||
jawn
| |||||||||||||||||||||||||||||
538 members of the Electoral College 270 electoral votes needed to win | |||||||||||||||||||||||||||||
|---|---|---|---|---|---|---|---|---|---|---|---|---|---|---|---|---|---|---|---|---|---|---|---|---|---|---|---|---|---|
| |||||||||||||||||||||||||||||
Presidential election results map. Brown denotes states won by Nigh/Graham and orange denotes those won by Perot/du Pont. Numbers indicate
electoral votes cast by each state and the District of Columbia. | |||||||||||||||||||||||||||||
| |||||||||||||||||||||||||||||
| |||||||||||||||||||||||||||||
538 members of the Electoral College 270 electoral votes needed to win | |||||||||||||||||||||||||||||
|---|---|---|---|---|---|---|---|---|---|---|---|---|---|---|---|---|---|---|---|---|---|---|---|---|---|---|---|---|---|
| |||||||||||||||||||||||||||||
Presidential election results map. Red denotes states won by Pataki/Bush and blue denotes those won by Pence/Bumpers. Numbers indicate
electoral votes cast by each state and the District of Columbia. | |||||||||||||||||||||||||||||
| |||||||||||||||||||||||||||||
ford 80
| |||||||||||||||||||||||||||||||||||||
538 members of the Electoral College 270 electoral votes needed to win | |||||||||||||||||||||||||||||||||||||
|---|---|---|---|---|---|---|---|---|---|---|---|---|---|---|---|---|---|---|---|---|---|---|---|---|---|---|---|---|---|---|---|---|---|---|---|---|---|
| Turnout | 54.2%
[1] | ||||||||||||||||||||||||||||||||||||
| |||||||||||||||||||||||||||||||||||||
Presidential election results map. Blue denotes states won by Ford/Connally and green denotes those won by Carter/Mondale. Olive denotes the five electoral votes for Perot/Boren by Texas
faithless electors. Numbers indicate
electoral votes cast by each state. | |||||||||||||||||||||||||||||||||||||
| |||||||||||||||||||||||||||||||||||||
| |||||||||||||||||||||||||||||
538 members of the Electoral College 270 electoral votes needed to win | |||||||||||||||||||||||||||||
|---|---|---|---|---|---|---|---|---|---|---|---|---|---|---|---|---|---|---|---|---|---|---|---|---|---|---|---|---|---|
| Turnout | 54.2%
[2] | ||||||||||||||||||||||||||||
| |||||||||||||||||||||||||||||
Presidential election results map. Blue denotes those won by Carter/Mondale and Red denotes states won by Ford/Dole. Numbers indicate
electoral votes cast by each state. | |||||||||||||||||||||||||||||
| |||||||||||||||||||||||||||||
| |||||||||||||||||||||||||||||
538 members of the Electoral College 270 electoral votes needed to win | |||||||||||||||||||||||||||||
|---|---|---|---|---|---|---|---|---|---|---|---|---|---|---|---|---|---|---|---|---|---|---|---|---|---|---|---|---|---|
| Turnout | 54.2%
[3] | ||||||||||||||||||||||||||||
| |||||||||||||||||||||||||||||
Presidential election results map. Red denotes states won by Ford/Connally and blue denotes those won by Carter/Mondale. Orange denotes the five electoral votes for Connally/Ford by Texas
faithless electors. Numbers indicate
electoral votes cast by each state. | |||||||||||||||||||||||||||||
| |||||||||||||||||||||||||||||
| |||||||||||||||||||||||||||||
538 members of the Electoral College 270 electoral votes needed to win | |||||||||||||||||||||||||||||
|---|---|---|---|---|---|---|---|---|---|---|---|---|---|---|---|---|---|---|---|---|---|---|---|---|---|---|---|---|---|
| Turnout | 55.2%
[5] | ||||||||||||||||||||||||||||
| |||||||||||||||||||||||||||||
Presidential election results map. Red denotes states won by Connally/Bush and blue denotes those won by McGovern/Biden. Light red and tan are the electoral votes for Reagan/Bush and Bush/None
[b], respectively, by Texas
faithless electors, reflecting the
1984 Texas vice presidential electors controversy. Numbers indicate
electoral votes cast by each state and the District of Columbia. | |||||||||||||||||||||||||||||
| |||||||||||||||||||||||||||||
| |||||||||||||||||||||||||||||||||||||||||||||||||||||||||||||
538 members of the Electoral College 270 votes needed to win | |||||||||||||||||||||||||||||||||||||||||||||||||||||||||||||
|---|---|---|---|---|---|---|---|---|---|---|---|---|---|---|---|---|---|---|---|---|---|---|---|---|---|---|---|---|---|---|---|---|---|---|---|---|---|---|---|---|---|---|---|---|---|---|---|---|---|---|---|---|---|---|---|---|---|---|---|---|---|
| Opinion polls | |||||||||||||||||||||||||||||||||||||||||||||||||||||||||||||
| |||||||||||||||||||||||||||||||||||||||||||||||||||||||||||||
Vice presidential election results map. Red denotes electors who voted for Bush, blue denotes electors who voted for Biden, and light red denotes electors who voted for Anderson. Orange, yellow, and pink are the electoral votes cast for Dole, Crane and Agnew, respectively, by Texas
faithless electors, reflecting the
1984 Texas vice presidential electors controversy. Numbers indicate
electoral votes cast by each state and the District of Columbia. | |||||||||||||||||||||||||||||||||||||||||||||||||||||||||||||
| Agnew v. Texas | |
|---|---|
| |
| Argued November 29, 1984 Decided December 5, 1984 | |
| Full case name | Spiro Agnew, John B. Anderson, Joseph Biden, Jr., Robert Dole, Phillip Crane, petitioners v. Texas |
| Holding | |
| Electors could not be forced to abstain if one of their pledged candidates is not constitutionally eligible to receive their votes. | |
| Court membership | |
| |
| |||||||||||||||||||||||||||||
538 members of the Electoral College 270 electoral votes needed to win | |||||||||||||||||||||||||||||
|---|---|---|---|---|---|---|---|---|---|---|---|---|---|---|---|---|---|---|---|---|---|---|---|---|---|---|---|---|---|
| Turnout | 54.2%
[6] | ||||||||||||||||||||||||||||
| |||||||||||||||||||||||||||||
Presidential election results map. Red denotes those won by Connally/Bush and blue denotes states won by Dodd/Applegate. Texas electors cast votes for Connally for both President and Vice President. Numbers indicate
electoral votes cast by each state. | |||||||||||||||||||||||||||||
| |||||||||||||||||||||||||||||
| |||||||||||||||||||||||||||||
538 members of the Electoral College 270 electoral votes needed to win | |||||||||||||||||||||||||||||
|---|---|---|---|---|---|---|---|---|---|---|---|---|---|---|---|---|---|---|---|---|---|---|---|---|---|---|---|---|---|
| Turnout | 58.1%
[7] | ||||||||||||||||||||||||||||
| |||||||||||||||||||||||||||||
Presidential election results map. Blue denotes states won by Clinton/Gore and red denotes those won by Bush/Quayle. Numbers indicate
electoral votes cast by each state and the District of Columbia. | |||||||||||||||||||||||||||||
| |||||||||||||||||||||||||||||
Presidents
| No. [e] | |||||||
|---|---|---|---|---|---|---|---|
| 37 |
|
Richard Nixon (1913–1994) [8] |
January 20, 1969 – August 9, 1974 [f] |
Republican |
1968
|
Spiro Agnew
[f]
Vacant: | |
| 38 |
|
Gerald Ford (1913–2006) [10] |
August 9, 1974
[h] – January 20, 1977 |
Republican | – | Vacant through December 19, 1974 | |
| 39 |
|
Jimmy Carter ( b. 1924) [11] |
January 20, 1977 – January 20, 1981 |
Democratic | 1976 | Walter Mondale | |
| 40 |
|
Gerald Ford (1913–2006) [12] |
January 20, 1981 – January 20, 1985 |
Republican | 1980 | John Connally | |
| 41 |
|
John Connally (1917–1991) [8] |
January 20, 1985 – July 17, 1989 [f] |
Republican |
1984
|
George H. W. Bush | |
| 42 |
|
George H. W. Bush (1924–2018) [8] |
July 17, 1989 – January 20, 1993 |
Republican | – | Vacant through October 24, 1989 | |
| 43 |
|
Gary Hart (b. 1936) |
January 20, 1993 – January 20, 2001 |
Democratic |
1992
|
David Boren |
| |||||||||||||||||||||||||||||||||
| |||||||||||||||||||||||||||||||||
County Results
Clinton 30-40% | |||||||||||||||||||||||||||||||||
| |||||||||||||||||||||||||||||||||
| |||||||||||||||||||||||||||||||||||||||||||||||||||||||||||||
3,346 delegates to the Democratic National Convention 1,674 delegates votes needed to win | |||||||||||||||||||||||||||||||||||||||||||||||||||||||||||||
|---|---|---|---|---|---|---|---|---|---|---|---|---|---|---|---|---|---|---|---|---|---|---|---|---|---|---|---|---|---|---|---|---|---|---|---|---|---|---|---|---|---|---|---|---|---|---|---|---|---|---|---|---|---|---|---|---|---|---|---|---|---|
| |||||||||||||||||||||||||||||||||||||||||||||||||||||||||||||
| |||||||||||||||||||||||||||||||||||||||||||||||||||||||||||||
| |||||||||||||||||||||||||||||||||||||||||||||||||||||||||||||
| |||||||||||||||||||||||||||||||||||||
538 members of the Electoral College 270 electoral votes needed to win | |||||||||||||||||||||||||||||||||||||
|---|---|---|---|---|---|---|---|---|---|---|---|---|---|---|---|---|---|---|---|---|---|---|---|---|---|---|---|---|---|---|---|---|---|---|---|---|---|
| |||||||||||||||||||||||||||||||||||||
Presidential election results map. Red denotes states won by Reagan/Bush and blue denotes those won by Carter/Mondale. Numbers indicate
electoral votes cast by each state. | |||||||||||||||||||||||||||||||||||||
| |||||||||||||||||||||||||||||||||||||
| |||||||||||||||||||||||||||||
538 members of the Electoral College 270 electoral votes needed to win | |||||||||||||||||||||||||||||
|---|---|---|---|---|---|---|---|---|---|---|---|---|---|---|---|---|---|---|---|---|---|---|---|---|---|---|---|---|---|
| |||||||||||||||||||||||||||||
Presidential election results map. Blue denotes states won by Carter/Kerrey and red denotes those won by Ford/Rumsfeld. Numbers indicate
electoral votes cast by each state. | |||||||||||||||||||||||||||||
| |||||||||||||||||||||||||||||
| |||||||||||||||||||||||||||||
538 members of the Electoral College 270 electoral votes needed to win | |||||||||||||||||||||||||||||
|---|---|---|---|---|---|---|---|---|---|---|---|---|---|---|---|---|---|---|---|---|---|---|---|---|---|---|---|---|---|
| |||||||||||||||||||||||||||||
Presidential election results map. Blue denotes states won by Hart/Clark and red denotes those won by Bush/Cheney. Numbers indicate
electoral votes cast by each state. | |||||||||||||||||||||||||||||
| |||||||||||||||||||||||||||||
- ^ "National General Election VEP Turnout Rates, 1789-Present". United States Election Project. CQ Press.
- ^ "National General Election VEP Turnout Rates, 1789-Present". United States Election Project. CQ Press.
- ^ "National General Election VEP Turnout Rates, 1789-Present". United States Election Project. CQ Press.
-
^ Cite error: The named reference
laws2was invoked but never defined (see the help page). - ^ "National General Election VEP Turnout Rates, 1789-Present". United States Election Project. CQ Press.
- ^ "National General Election VEP Turnout Rates, 1789-Present". United States Election Project. CQ Press.
- ^ "National General Election VEP Turnout Rates, 1789-Present". United States Election Project. CQ Press.
- ^ a b c Hoff (b) (2000).
- ^ Neale (2004), p. 22.
- ^ a b Greene (2013).
- ^ whitehouse.gov (a).
- ^ Schaller (2004).
- ^ "DISENCHANTED". The Boston Globe. Boston, Massachusetts. July 1, 1980. Retrieved April 2, 2024.
- ^ "DISENCHANTED". The Boston Globe. Boston, Massachusetts. July 1, 1980. Retrieved April 2, 2024.
- ^ "DISENCHANTED". The Boston Globe. Boston, Massachusetts. July 1, 1980. Retrieved April 2, 2024.
- ^ "DISENCHANTED". The Boston Globe. Boston, Massachusetts. July 1, 1980. Retrieved April 2, 2024.
- ^ "DISENCHANTED". The Boston Globe. Boston, Massachusetts. July 1, 1980. Retrieved April 2, 2024.
prescott
| |||||||||||||||||||||||||||||||||||||
538 members of the Electoral College 270 electoral votes needed to win | |||||||||||||||||||||||||||||||||||||
|---|---|---|---|---|---|---|---|---|---|---|---|---|---|---|---|---|---|---|---|---|---|---|---|---|---|---|---|---|---|---|---|---|---|---|---|---|---|
| |||||||||||||||||||||||||||||||||||||
Presidential election results map. Red denotes states won by Bush/Romney, blue denotes those won by Muskie/Sanford, and purple denotes those won by Wallace/LeMay, including a North Carolina
faithless elector. Numbers indicate
electoral votes cast by each state. | |||||||||||||||||||||||||||||||||||||
| |||||||||||||||||||||||||||||||||||||
| |||||||||||||||||||||||||||||||||||||
538 members of the Electoral College 270 electoral votes needed to win | |||||||||||||||||||||||||||||||||||||
|---|---|---|---|---|---|---|---|---|---|---|---|---|---|---|---|---|---|---|---|---|---|---|---|---|---|---|---|---|---|---|---|---|---|---|---|---|---|
| |||||||||||||||||||||||||||||||||||||
Presidential election results map. Blue denotes states won by Harris/Moss, red denotes those won by Romney, yellow denotes those won by Gross/Crane, green denotes those won by Rhodes, brown denotes those won by Case, orange denotes those won by Bush/Romney, and pale red denotes those won by various other candidates; this reflects the posthumous scattering of Bush's electoral votes. Numbers indicate
electoral votes cast by each state. | |||||||||||||||||||||||||||||||||||||
| |||||||||||||||||||||||||||||||||||||
iran contra get bad
| |||||||||||||||||||||||||||||||||||||
538 members of the Electoral College 270 electoral votes needed to win | |||||||||||||||||||||||||||||||||||||
|---|---|---|---|---|---|---|---|---|---|---|---|---|---|---|---|---|---|---|---|---|---|---|---|---|---|---|---|---|---|---|---|---|---|---|---|---|---|
| |||||||||||||||||||||||||||||||||||||
Presidential election results map. Blue denotes states won by Carter/Bentsen, red denotes those won by Quayle/Kemp and orange denotes those won by Bush/Cheney. Numbers indicate
electoral votes cast by each state. | |||||||||||||||||||||||||||||||||||||
| |||||||||||||||||||||||||||||||||||||
andy
| ||||||||||||||||||||||||||||||||
538 members of the Electoral College 270 electoral votes needed to win | ||||||||||||||||||||||||||||||||
|---|---|---|---|---|---|---|---|---|---|---|---|---|---|---|---|---|---|---|---|---|---|---|---|---|---|---|---|---|---|---|---|---|
| ||||||||||||||||||||||||||||||||
Presidential election results map. Purple denotes states won by Anderson/Carey and red denotes those won by Reagan/Bush. Numbers indicate
electoral votes cast by each state. | ||||||||||||||||||||||||||||||||
| ||||||||||||||||||||||||||||||||
ford terms
| |||||||||||||||||||||||||||||||||||||
538 members of the Electoral College 270 electoral votes needed to win | |||||||||||||||||||||||||||||||||||||
|---|---|---|---|---|---|---|---|---|---|---|---|---|---|---|---|---|---|---|---|---|---|---|---|---|---|---|---|---|---|---|---|---|---|---|---|---|---|
| |||||||||||||||||||||||||||||||||||||
Presidential election results map. Red denotes states won by Ford/Anderson, blue denotes those won by Wallace/Jackson, and green denotes those won by McCarthy/None. Numbers indicate
electoral votes cast by each state. | |||||||||||||||||||||||||||||||||||||
| |||||||||||||||||||||||||||||||||||||
| |||||||||||||||||||||||||||||
538 members of the Electoral College 270 electoral votes needed to win | |||||||||||||||||||||||||||||
|---|---|---|---|---|---|---|---|---|---|---|---|---|---|---|---|---|---|---|---|---|---|---|---|---|---|---|---|---|---|
| |||||||||||||||||||||||||||||
Presidential election results map. Red denotes states won by Ford/Anderson and blue denotes those won by Mondale/Muskie. Numbers indicate
electoral votes cast by each state. | |||||||||||||||||||||||||||||
| |||||||||||||||||||||||||||||
| No. [r] | Portrait | Name (Birth–Death) |
Term [1] | Party [s] [2] | Election | Vice President [3] | |
|---|---|---|---|---|---|---|---|
| 36 |
|
Lyndon B. Johnson (1908–1973) [4] |
November 22, 1963
[t] – January 20, 1969 |
Democratic | –
|
Vacant through January 20, 1965 | |
| 37 |
|
Richard Nixon (1913–1994) [6] |
January 20, 1969 – February 17, 1975 [f] |
Republican |
1968
|
Spiro Agnew
[f]
Vacant: | |
| 38 |
|
Gerald Ford (1913–2006) [8] |
February 17, 1975
[u] – January 20, 1985 |
Republican | –
1976 1980 |
Vacant through May 28, 1975 John B. Anderson | |
| Impeachment process against Richard Nixon | |
|---|---|
|
First day of the House Judiciary Committee's formal impeachment hearings against President Nixon, November 18, 1974 | |
| Accused | Richard Nixon, President of the United States |
| Proponents | United States House Committee on the Judiciary |
| Date | May 10, 1974 to February 28, 1975 (3 months, 1 week and 3 days) |
| Outcome | Resolution containing three articles of impeachment adopted February 7, 1975; the impeachment proceedings ended on February 28, 1975, without an impeachment vote, after President Nixon resigned from office. [9] [10] |
| Charges | Adopted:
obstruction of justice,
abuse of power,
contempt of Congress Rejected: usurping congressional war powers, tax fraud |
| ||
|---|---|---|
|
76th Governor of Georgia
39th President of the United States
Policies
Appointments
Tenure
Presidential campaigns Post-presidency
|
||
| |||||||||||||||||||||||||||
| George Wallace | Henry M. Jackson | ||||||||||||||||||||||||||
|---|---|---|---|---|---|---|---|---|---|---|---|---|---|---|---|---|---|---|---|---|---|---|---|---|---|---|---|
| for President | for Vice President | ||||||||||||||||||||||||||
|
| ||||||||||||||||||||||||||
| 45th and 48th Governor of Alabama (1963-1967, 1971–1979) |
U.S. Senator from Washington (1953–1983) | ||||||||||||||||||||||||||
| Campaign | |||||||||||||||||||||||||||
| |||||||||||||||||||||||||||||
| Gerald Ford | John B. Anderson | ||||||||||||||||||||||||||||
|---|---|---|---|---|---|---|---|---|---|---|---|---|---|---|---|---|---|---|---|---|---|---|---|---|---|---|---|---|---|
| for President | for Vice President | ||||||||||||||||||||||||||||
|
| ||||||||||||||||||||||||||||
|
38th President of the United States (1975–1985) |
42nd Vice President of the United States (1977–1985) | ||||||||||||||||||||||||||||
| Campaign | |||||||||||||||||||||||||||||
- ^ a b c jawn
- ^ a b jhawn
- ^ a b jdawn
- ^ Elections were held in Arkansas and Louisiana; however, due to various irregularities including allegations of electoral fraud, all electoral votes from those states (6 and 8, respectively) were invalidated.
- ^ Presidents are numbered according to uninterrupted periods served by the same person. For example, George Washington served two consecutive terms and is counted as the first president (not the first and second). Upon the resignation of 37th president, Richard Nixon, Gerald Ford became the 38th president even though he simply served out the remainder of Nixon's second term and was never elected to the presidency in his own right. Grover Cleveland was both the 22nd president and the 24th president because his two terms were not consecutive. A vice president who temporarily becomes acting president under the Twenty-fifth Amendment to the Constitution is not counted, because the president remains in office during such a period.
- ^
a
b
c
d
e
f Cite error: The named reference
resignedintratermwas invoked but never defined (see the help page). - ^ a b c d Appointed as vice president under terms of the Twenty-fifth Amendment, Section 2 [9] Cite error: The named reference "VP25th" was defined multiple times with different content (see the help page).
- ^ Gerald Ford succeeded to the presidency upon the resignation of Richard Nixon. [10]
- ^ This is an estimate provided by the source.
- ^ This is an estimate provided by the source.
- ^ This is an estimate provided by the source.
- ^ This is an estimate provided by the source.
- ^ While there were technically 773 delegates that went to the convention unnbound, they presumably cast their support for the president
- ^ This is an estimate provided by the source.
- ^ In some states labeled as National Unity, Anderson Coalition, Anderson Alternative or "Anderson for President"
- ^ In Alabama he was also on the Ballot as the Democratic Party Candidate, and in other states, although he won electoral votes from none of them, he appeared under various other Labels such as "George Wallace Party" "Courage Party" "American Party" and as an independent candidate.
- ^ In some states labeled as National Unity, Anderson Coalition, Anderson Alternative or "Anderson for President"
- ^ Presidents are numbered according to uninterrupted periods served by the same person. For example, George Washington served two consecutive terms and is counted as the first president (not the first and second). Upon the resignation of 37th president, Richard Nixon, Gerald Ford became the 38th president even though he simply served out the remainder of Nixon's second term and was never elected to the presidency in his own right. Grover Cleveland was both the 22nd president and the 24th president because his two terms were not consecutive. A vice president who temporarily becomes acting president under the Twenty-fifth Amendment to the Constitution is not counted, because the president remains in office during such a period.
- ^ Reflects the president's political party at the start of their presidency. Changes during their time in office are noted. Also reflects the vice president's political party unless otherwise noted beside the individual's name.
- ^ Lyndon B. Johnson succeeded to the presidency upon the death of John F. Kennedy. [5]
- ^ Gerald Ford succeeded to the presidency upon the resignation of Richard Nixon. [8]
| 1976 independent ticket |
| Eugene McCarthy |
|---|
| for President |
|
|
| U.S. Senator from Minnesota (1959–1971) |
| ||
|---|---|---|
|
76th Governor of Georgia
39th President of the United States
Policies
Appointments
Tenure
Presidential campaigns Post-presidency
|
||
| |||||||||||||||||||||||||||||
| Walter Mondale | Edmund Muskie | ||||||||||||||||||||||||||||
|---|---|---|---|---|---|---|---|---|---|---|---|---|---|---|---|---|---|---|---|---|---|---|---|---|---|---|---|---|---|
| for President | for Vice President | ||||||||||||||||||||||||||||
|
| ||||||||||||||||||||||||||||
|
U.S. Senator from Minnesota (1964–2009) |
U.S. Senator from Maine (1959–1983) | ||||||||||||||||||||||||||||
| Campaign | |||||||||||||||||||||||||||||
| |||||||||||||||||||||||||||||||||||||||||||||||||||||||||||||
3,010 delegates to the 1976 Democratic National Convention 1,506 (majority) votes needed to win | |||||||||||||||||||||||||||||||||||||||||||||||||||||||||||||
|---|---|---|---|---|---|---|---|---|---|---|---|---|---|---|---|---|---|---|---|---|---|---|---|---|---|---|---|---|---|---|---|---|---|---|---|---|---|---|---|---|---|---|---|---|---|---|---|---|---|---|---|---|---|---|---|---|---|---|---|---|---|
| |||||||||||||||||||||||||||||||||||||||||||||||||||||||||||||
|
Wallace Jackson Udall Brown Humphrey Church Byrd Uncommitted | |||||||||||||||||||||||||||||||||||||||||||||||||||||||||||||
| |||||||||||||||||||||||||||||||||||||||||||||||||||||||||||||
| ||||||||||||||||||||||
2,259 delegates to the Republican National Convention 1,130 votes needed to win | ||||||||||||||||||||||
|---|---|---|---|---|---|---|---|---|---|---|---|---|---|---|---|---|---|---|---|---|---|---|
| ||||||||||||||||||||||
|
Ford | ||||||||||||||||||||||
| ||||||||||||||||||||||
| Poll source | Date(s) administered |
Gerald Ford (R) | George Wallace (D) | Eugene McCarthy (I) | Undecided | Margin |
|---|---|---|---|---|---|---|
| ABC-Harris [11] | October 3–6, 1980 | 49% | 14% | 31% | 6% | 18 |
| Gallup [12] | October 10–12, 1980 | 48% | 18% | 27% | 7% | 21 |
| ABC-Harris [13] | October 14–16, 1980 | 50% | 22% | 24% | 4% | 26 |
| ABC-Harris [14] | October 22–25, 1980 | 49% | 24% | 21% | 6% | 25 |
| Washington Post [15] | October 26–27, 1980 | 51% | 26% | 19% | 4% | 25 |
| Newsweek-Gallup [15] | October 29–30, 1980 | 50% | 27% | 20% | 3% | 23 |
| |||||||||||||||||||||||||||||||||||||||||||||||||||||||||||||
3,346 delegates to the 1980 Democratic National Convention 1,674 delegates votes needed to win | |||||||||||||||||||||||||||||||||||||||||||||||||||||||||||||
|---|---|---|---|---|---|---|---|---|---|---|---|---|---|---|---|---|---|---|---|---|---|---|---|---|---|---|---|---|---|---|---|---|---|---|---|---|---|---|---|---|---|---|---|---|---|---|---|---|---|---|---|---|---|---|---|---|---|---|---|---|---|
| |||||||||||||||||||||||||||||||||||||||||||||||||||||||||||||
|
Mondale Kennedy Carter Brown Finch Udall Uncommitted | |||||||||||||||||||||||||||||||||||||||||||||||||||||||||||||
| |||||||||||||||||||||||||||||||||||||||||||||||||||||||||||||
| |||||||||||||||||||||||||||||
1,990 delegates to the 1980 Republican National Convention 996 (majority) votes needed to win | |||||||||||||||||||||||||||||
|---|---|---|---|---|---|---|---|---|---|---|---|---|---|---|---|---|---|---|---|---|---|---|---|---|---|---|---|---|---|
| |||||||||||||||||||||||||||||
|
| |||||||||||||||||||||||||||||
| |||||||||||||||||||||||||||||
| Assassination of Ronald Reagan | |
|---|---|
|
Reagan addresses a crowd of supporters minutes before he is shot. Reagan had been campaigning ahead of the upcoming California primary, which still took place two days later. | |
| Location | Topanga Plaza, Canoga Park, California, United States |
| Date | June 1, 1980 1:48 p.m. ( Pacific Time) |
| Target | Ronald Reagan |
Attack type | Assassination, shooting |
| Weapons | Röhm RG-14 |
| Deaths | Ronald Reagan |
| Injured | 3 |
| Perpetrator | John Hinckley Jr. |
| Motive | Attempt to gain the attention of Jodie Foster; mental illness |
| Verdict | Not guilty by reason of insanity |
- ^ LOC; whitehouse.gov.
- ^ Guide to U.S. Elections (2010), pp. 257–258.
- ^ LOC.
- ^ Gardner (2000).
- ^ Abbott (2005), p. 633.
- ^ Hoff (b) (2000).
- ^ Neale (2004), p. 22.
- ^ a b Greene (2013).
-
^ Cite error: The named reference
nyt-no-impeachmentwas invoked but never defined (see the help page). - ^ Stathis & Huckabee 1998.
- ^ "Poll Reveals 3-Point Slip By Anderson". Tarrytown Daily News.
- ^ "Reagan Holds Narrow Lead; Anderson Dips". The Knoxville News-Sentinel.
- ^ "Poll Reveals 3-Point Slip By Anderson". The Buffalo News.
- ^ "Reagan, Carter In Tight Fight". Florida Today.
- ^ a b "Polls Say Its Going Down To The Wire". The Miami Herald.