| |||||||||||||||||
| |||||||||||||||||
| |||||||||||||||||
.jpg)

| Party | Candidate | Votes | % | |
|---|---|---|---|---|
| Democratic | Bernie Sanders | 27,345 | 94.32% | |
| Democratic | Craig Hill | 1,573 | 5.40% | |
| Democratic | Write-ins | 79 | 0.28% | |
| Total votes | 29,113 | 100.00% | ||
| |||||||||||||||||||||||||
88 legislative chambers in 46 states | |||||||||||||||||||||||||
|---|---|---|---|---|---|---|---|---|---|---|---|---|---|---|---|---|---|---|---|---|---|---|---|---|---|
| |||||||||||||||||||||||||
 Map of upper house elections: Democrats gained control Democrats retained control Republicans retained control Coalition gained control Non-partisan legislature No regularly-scheduled elections | |||||||||||||||||||||||||
 Map of lower house elections: Democrats gained control Democrats retained control Republicans retained control Non-partisan legislature No regularly-scheduled elections | |||||||||||||||||||||||||
| |||||||||||||||||||||||||
38 governorships 36 states; 2 territories | |||||||||||||||||||||||||
|---|---|---|---|---|---|---|---|---|---|---|---|---|---|---|---|---|---|---|---|---|---|---|---|---|---|
| |||||||||||||||||||||||||
 Map of the results Republican hold Democratic hold Democratic gain No election | |||||||||||||||||||||||||
| |||||||||||||||||||||||||||||||||||||||||||||||||||||||||||||||||||||||
All 435 seats in the United States House of Representatives [c] 218 seats needed for a majority | |||||||||||||||||||||||||||||||||||||||||||||||||||||||||||||||||||||||
|---|---|---|---|---|---|---|---|---|---|---|---|---|---|---|---|---|---|---|---|---|---|---|---|---|---|---|---|---|---|---|---|---|---|---|---|---|---|---|---|---|---|---|---|---|---|---|---|---|---|---|---|---|---|---|---|---|---|---|---|---|---|---|---|---|---|---|---|---|---|---|---|
| |||||||||||||||||||||||||||||||||||||||||||||||||||||||||||||||||||||||
 Results: Democratic hold Democratic gain Republican hold | |||||||||||||||||||||||||||||||||||||||||||||||||||||||||||||||||||||||
| |||||||||||||||||||||||||||||||||||||||||||||||||||||||||||||||||||||||


| |||||||||||||||||||||||||||||||||||||||||||||||||||||||||||||||||||||||||||||
33 of the 100 seats in the United States Senate 51 seats needed for a majority | |||||||||||||||||||||||||||||||||||||||||||||||||||||||||||||||||||||||||||||
|---|---|---|---|---|---|---|---|---|---|---|---|---|---|---|---|---|---|---|---|---|---|---|---|---|---|---|---|---|---|---|---|---|---|---|---|---|---|---|---|---|---|---|---|---|---|---|---|---|---|---|---|---|---|---|---|---|---|---|---|---|---|---|---|---|---|---|---|---|---|---|---|---|---|---|---|---|---|
| |||||||||||||||||||||||||||||||||||||||||||||||||||||||||||||||||||||||||||||
 Results of the elections: Democratic gain Democratic hold Republican hold No election | |||||||||||||||||||||||||||||||||||||||||||||||||||||||||||||||||||||||||||||
| |||||||||||||||||||||||||||||||||||||||||||||||||||||||||||||||||||||||||||||
.jpg)
.jpg)
| |||||||||||||||||||||||||||||||||||||
| |||||||||||||||||||||||||||||||||||||
 County results Perry: 20–30% 30–40% 40–50% 50–60% 60–70% | |||||||||||||||||||||||||||||||||||||
| |||||||||||||||||||||||||||||||||||||
.jpg)

.jpg)
_(cropped).jpg)
|
| |
|
File:YouTube - Broadcast Yourself.png Final logo before the 2012 shutdown | |
| Type of business |
Limited liability company ( Subsidiary) |
|---|---|
Type of site | Video hosting service |
| Available in | 54 language versions available through user interface [2] |
| Founded | February 14, 2005 |
| Headquarters | 901 Cherry Ave,
San Bruno, , California United States |
| Area served | Worldwide |
| Owner | Independent (2005–2006) Google Inc. (2006–2012) |
| Founder(s) | Steve Chen, Chad Hurley, Jawed Karim |
| Key people |
Salar Kamangar (Former CEO) Chad Hurley (Advisor) |
| Industry | Internet |
| URL | Archived official website at the Wayback Machine (archive index) |
| Advertising | Google AdSense |
| Registration | Optional; no longer available |
| Launched | February 14, 2005 |
| Current status | Defunct (November 31, 2012) |
Mx374/sandbox | |
|---|---|
 Official portrait, 2012 | |
| 44th President of the United States | |
| In office January 20, 2009 – January 20, 2017 | |
| Vice President | Barack Obama |
| Preceded by | George W. Bush |
| Succeeded by | Barack Obama |
|
United States Senator from Alaska | |
| In office January 3, 1969 – January 3, 1981 | |
| Preceded by | Ernest Gruening |
| Succeeded by | Frank H. Murkowski |
| 3rd Speaker of the Alaska House of Representatives | |
| In office January 25, 1965 – January 22, 1967 | |
| Preceded by | Bruce Kendall |
| Succeeded by | Bill Boardman |
| Member of the
Alaska House of Representatives from the 8th district | |
| In office January 23, 1963 – January 22, 1967 | |
| Preceded by | John S. Hellenthal |
| Succeeded by | Michael F. Beirne |
| Personal details | |
| Born | Maurice Robert Gravel May 13, 1930 Springfield, Massachusetts, U.S. |
| Died | June 26, 2021 (aged 91) Seaside, California, U.S. |
| Political party | Democratic |
| Spouses | Rita Martin
(
m. 1959;
div. 1981)Whitney Stewart (
m. 1984) |
| Children | 2 |
| Parents | |
| Relatives | Obama family |
| Residence | Kalorama, Washington, D.C. |
| Occupation |
|
| Awards | Full list |
| Signature |
 |
| Website | |
| Military service | |
| Allegiance | |
| Branch/service | |
| Years of service | 1951–1954 |
| Rank |
|
| ||||||||||||||||||||||||||||||||||||||||
All 435 seats in the United States House of Representatives [d] 218 seats needed for a majority | ||||||||||||||||||||||||||||||||||||||||
|---|---|---|---|---|---|---|---|---|---|---|---|---|---|---|---|---|---|---|---|---|---|---|---|---|---|---|---|---|---|---|---|---|---|---|---|---|---|---|---|---|
| ||||||||||||||||||||||||||||||||||||||||
 Results: Democratic hold Democratic gain Republican hold Republican gain | ||||||||||||||||||||||||||||||||||||||||
| ||||||||||||||||||||||||||||||||||||||||


| |||||||||||||||||||||||||||||||||||||||||||||||||||||||||||||||||||||||
All 435 seats in the United States House of Representatives [e] 218 seats needed for a majority | |||||||||||||||||||||||||||||||||||||||||||||||||||||||||||||||||||||||
|---|---|---|---|---|---|---|---|---|---|---|---|---|---|---|---|---|---|---|---|---|---|---|---|---|---|---|---|---|---|---|---|---|---|---|---|---|---|---|---|---|---|---|---|---|---|---|---|---|---|---|---|---|---|---|---|---|---|---|---|---|---|---|---|---|---|---|---|---|---|---|---|
| |||||||||||||||||||||||||||||||||||||||||||||||||||||||||||||||||||||||
Results: Democratic hold Democratic gain Republican hold | |||||||||||||||||||||||||||||||||||||||||||||||||||||||||||||||||||||||
| |||||||||||||||||||||||||||||||||||||||||||||||||||||||||||||||||||||||
The 2006 United States House of Rep
| |||||||||||||||||||||||||||||
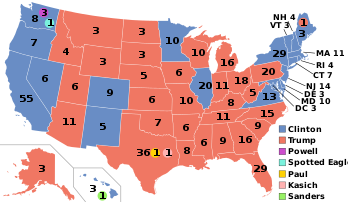
538 members of the Electoral College 270 electoral votes needed to win | |||||||||||||||||||||||||||||
|---|---|---|---|---|---|---|---|---|---|---|---|---|---|---|---|---|---|---|---|---|---|---|---|---|---|---|---|---|---|
| Opinion polls | |||||||||||||||||||||||||||||
| Turnout | 58.0% | ||||||||||||||||||||||||||||
| |||||||||||||||||||||||||||||
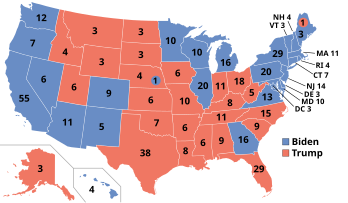 Presidential election results map. Blue denotes states won by Biden/Harris and red denotes those won by Trump/Stefanik. Numbers indicate
electoral votes cast by each state and the District of Columbia. | |||||||||||||||||||||||||||||
| |||||||||||||||||||||||||||||
.jpg)
.jpg)
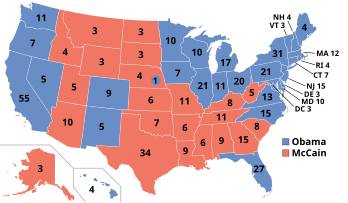
| ←
2014
2015 2016
2017
2018 → Presidential election year | |
| Election day | November 8, 2016 |
|---|---|
| Incumbent president | Barack Obama (Democratic) |
| Next Congress | 115th |
| Presidential election | |
| Partisan control | Republican gain |
| Popular vote margin | Democratic +2.1% |
| Electoral vote | |
| Donald Trump ( R) | 304 |
| Hillary Clinton ( D) | 227 |
| Others | 7 |
 | |
| Presidential election results map. Red denotes states won by Trump/Pence, blue denotes states won by Clinton/Kaine. Numbers indicate electoral votes allotted to the winner of each state. Seven faithless electors cast votes for various individuals. | |
| Senate elections | |
| Overall control | Democratic gain |
| Seats contested | 34 of 100 seats |
| Net seat change | Democratic +5 |
 | |
| 2016 Senate results Democratic hold Republican hold Democratic gain | |
| House elections | |
| Overall control | Republican hold |
| Seats contested | All 435 voting-members and 6 non-voting delegates |
| Popular vote margin | Republican +1.1% |
| Net seat change | Democratic +6 |
 | |
| Map of the 2016 House races (delegate races not shown)
Democratic hold Republican hold Democratic gain Republican gain | |
| Gubernatorial elections | |
| Seats contested | 14 (12 states, two territories) |
| Net seat change | Republican +2 |
 | |
| Map of the 2016 gubernatorial elections Democratic hold Republican hold Democratic gain Republican gain New Progressive gain Nonpartisan | |
| |||||||||||||||||||||||||||||||||||||||||
538 members of the Electoral College 270 electoral votes needed to win | |||||||||||||||||||||||||||||||||||||||||
|---|---|---|---|---|---|---|---|---|---|---|---|---|---|---|---|---|---|---|---|---|---|---|---|---|---|---|---|---|---|---|---|---|---|---|---|---|---|---|---|---|---|
| Opinion polls | |||||||||||||||||||||||||||||||||||||||||
| Turnout | 60.1%
[10] | ||||||||||||||||||||||||||||||||||||||||
| |||||||||||||||||||||||||||||||||||||||||
Presidential election results map. Red denotes states won by Cruz/Fiorina and blue denotes those won by Sanders/Warren. Numbers indicate
electoral votes cast by each state and the District of Columbia. On election night, Sanders won 272 electors and Cruz 266. However, because of four
faithless electors (three Democratic and one Republican), Sanders received just 269 votes to Cruz's 265. | |||||||||||||||||||||||||||||||||||||||||
| |||||||||||||||||||||||||||||||||||||||||
2017 contingent election | |||||||||||||||||||||||||||||||||||||||||
| |||||||||||||||||||||||||||||||||||||||||
50 state delegations of the House of Representatives 26 state votes needed to win | |||||||||||||||||||||||||||||||||||||||||
| |||||||||||||||||||||||||||||||||||||||||
House of Representatives votes by state. States in red for Cruz, | |||||||||||||||||||||||||||||||||||||||||
| States in blue for Sanders, and States in grey are split. | |||||||||||||||||||||||||||||||||||||||||


}}
| |||||||||||||||||||||||||||||||||||||||||
531 members of the Electoral College 267 electoral votes needed to win | |||||||||||||||||||||||||||||||||||||||||
|---|---|---|---|---|---|---|---|---|---|---|---|---|---|---|---|---|---|---|---|---|---|---|---|---|---|---|---|---|---|---|---|---|---|---|---|---|---|---|---|---|---|
| Opinion polls | |||||||||||||||||||||||||||||||||||||||||
| Turnout | 66.6% | ||||||||||||||||||||||||||||||||||||||||
| |||||||||||||||||||||||||||||||||||||||||
Presidential election results map. Blue denotes states won by Biden/Harris, red denotes those won by Trump/Pence, Dark Green denotes states that were depopulated which were therefore ineligible to vote, and Gray denotes states with
multiple slates of electors. Numbers indicate
electoral votes cast by each state and the District of Columbia. On election night, Trump won 255 electors and Cuomo 276. However, because of recounts in Minnesota, a last minute change in Maine's election laws, and states sending multiple slates of electors, Trump received just 264 votes to Cuomo's 214. | |||||||||||||||||||||||||||||||||||||||||
| |||||||||||||||||||||||||||||||||||||||||

| |||||||||||||||||||||||||||||
538 members of the Electoral College 270 electoral votes needed to win | |||||||||||||||||||||||||||||
|---|---|---|---|---|---|---|---|---|---|---|---|---|---|---|---|---|---|---|---|---|---|---|---|---|---|---|---|---|---|
| Opinion polls | |||||||||||||||||||||||||||||
| Turnout | 66.6% | ||||||||||||||||||||||||||||
| |||||||||||||||||||||||||||||
Presidential election results map. Blue denotes states won by Biden/Harris and red denotes those won by Trump/Pence. Numbers indicate
electoral votes cast by each state and the District of Columbia. | |||||||||||||||||||||||||||||
| |||||||||||||||||||||||||||||

In this Congress, Class 3 meant their term ended with this Congress, requiring reelection in 2010; Class 1 meant their term began in the last Congress, requiring reelection in 2012; and Class 2 meant their term began in this Congress, requiring reelection in 2014.
|
|
 2 Democrats 1 Democrat and 1 Republican 2 Republicans 1 Independent and 1 Democrat Senate Majority Leaders  Democratic Leader Harry Reid  Democratic Whip Dick Durbin
|


| |||||||||||||||||||||||||||||||||||||||||||||||||||||||||||||||||||||||
35 of the 100 seats in the United States Senate 51 seats needed for a majority | |||||||||||||||||||||||||||||||||||||||||||||||||||||||||||||||||||||||
|---|---|---|---|---|---|---|---|---|---|---|---|---|---|---|---|---|---|---|---|---|---|---|---|---|---|---|---|---|---|---|---|---|---|---|---|---|---|---|---|---|---|---|---|---|---|---|---|---|---|---|---|---|---|---|---|---|---|---|---|---|---|---|---|---|---|---|---|---|---|---|---|
| |||||||||||||||||||||||||||||||||||||||||||||||||||||||||||||||||||||||
 | |||||||||||||||||||||||||||||||||||||||||||||||||||||||||||||||||||||||
.jpg)
|
2008 presidential election | |

 Nominees Gravel and Obama | |
| Convention | |
|---|---|
| Date(s) | August 25–28, 2008 |
| City | Denver, Colorado, U.S. |
| Venue |
Pepsi Center (August 25 – August 27) Invesco Field at Mile High (August 28) |
| Chair | Nancy Pelosi of California |
| Keynote speaker | Mark Warner of Virginia |
| Notable speakers |
Michelle Obama Ted Kennedy Bill Clinton Nancy Pelosi John Kerry Al Gore Dick Durbin |
| Candidates | |
| Presidential nominee | Mike Gravel of Alaska |
| Vice presidential nominee | Barack Obama of Illinois |
| Voting | |
| Total delegates | 4,419 |
| Votes needed for nomination | 2,210 |
| Results (president) |
Gravel (
AK): 3,188.5 (72.15%) Biden ( DE): 1,010.5 (22.87%) Abstention: 1 (0.00%) Not Voting: 219 (4.96%) |
| Results (vice president) | Obama ( IL): 100% ( Acclamation) |
| Ballots | 1 |
| ||||||||||||||||||||||||||||||||||||||||||||||||||||||
| ||||||||||||||||||||||||||||||||||||||||||||||||||||||
 First place by initial pledged delegate allocation
| ||||||||||||||||||||||||||||||||||||||||||||||||||||||
 First place by convention roll call
| ||||||||||||||||||||||||||||||||||||||||||||||||||||||
| ||||||||||||||||||||||||||||||||||||||||||||||||||||||


| |||||||||||||||||||||||||||||
538 members of the Electoral College 270 electoral votes needed to win | |||||||||||||||||||||||||||||
|---|---|---|---|---|---|---|---|---|---|---|---|---|---|---|---|---|---|---|---|---|---|---|---|---|---|---|---|---|---|
| Opinion polls | |||||||||||||||||||||||||||||
| Turnout | 61.6%
[28] | ||||||||||||||||||||||||||||
| |||||||||||||||||||||||||||||
 Presidential election results map. Blue denotes states won by Gravel/Obama and red denotes those won by Romney/Barbour. Numbers indicate
electoral votes cast by each state and the District of Columbia. | |||||||||||||||||||||||||||||
| |||||||||||||||||||||||||||||
.jpg)
| |||||||||||||||||||||||||||||||||||||||||||||||||||||||||||||||||||||||||||||
33 of the 100 seats in the United States Senate 51 seats needed for a majority | |||||||||||||||||||||||||||||||||||||||||||||||||||||||||||||||||||||||||||||
|---|---|---|---|---|---|---|---|---|---|---|---|---|---|---|---|---|---|---|---|---|---|---|---|---|---|---|---|---|---|---|---|---|---|---|---|---|---|---|---|---|---|---|---|---|---|---|---|---|---|---|---|---|---|---|---|---|---|---|---|---|---|---|---|---|---|---|---|---|---|---|---|---|---|---|---|---|---|
| |||||||||||||||||||||||||||||||||||||||||||||||||||||||||||||||||||||||||||||
Results of the elections: Democratic gain Democratic hold Republican hold Independent hold No election | |||||||||||||||||||||||||||||||||||||||||||||||||||||||||||||||||||||||||||||
| |||||||||||||||||||||||||||||||||||||||||||||||||||||||||||||||||||||||||||||
| ←
2019
2020 2021
2022
2023 → Off-year elections | |
| Election day | November 2 |
|---|---|
| Senate elections | |
| Seats contested | 2 mid-term vacancies |
| Net seat change | 0 |
 | |
| Map of the 2022 Senate special elections Republican hold (2) | |
| House elections | |
| Seats contested | 6 mid-term vacancies |
| Net seat change | 0 |
 | |
| Map of the 2017 House special elections Democratic hold (1) Republican hold (5) | |
| Gubernatorial elections | |
| Seats contested | 2 |
| Net seat change | Democratic +1 |
 | |
| Map of the 2017 gubernatorial races Democratic hold (1) Democratic gain (1) | |
| |||||||||||||||||
| Turnout | 53.01% (of registered voters) 42.07% (of voting age population) [29] | ||||||||||||||||
|---|---|---|---|---|---|---|---|---|---|---|---|---|---|---|---|---|---|
| |||||||||||||||||
| |||||||||||||||||


| |||||||||||||||||||||||||||||
538 members of the Electoral College 270 electoral votes needed to win | |||||||||||||||||||||||||||||
|---|---|---|---|---|---|---|---|---|---|---|---|---|---|---|---|---|---|---|---|---|---|---|---|---|---|---|---|---|---|
| Opinion polls | |||||||||||||||||||||||||||||
| Turnout | 66.8% | ||||||||||||||||||||||||||||
| |||||||||||||||||||||||||||||
Presidential election results map. Blue denotes states won by Sanders/Tlaib, and red denotes those won by Trump/Pence. Numbers indicate
electoral votes cast by each state and the District of Columbia. | |||||||||||||||||||||||||||||
| |||||||||||||||||||||||||||||
| ||||||||||||||||||||||||||||||||||||||||||||||||||||||||||||||||||||||||||
35 of the 100 seats in the United States Senate 51 seats needed for a majority | ||||||||||||||||||||||||||||||||||||||||||||||||||||||||||||||||||||||||||
|---|---|---|---|---|---|---|---|---|---|---|---|---|---|---|---|---|---|---|---|---|---|---|---|---|---|---|---|---|---|---|---|---|---|---|---|---|---|---|---|---|---|---|---|---|---|---|---|---|---|---|---|---|---|---|---|---|---|---|---|---|---|---|---|---|---|---|---|---|---|---|---|---|---|---|
| ||||||||||||||||||||||||||||||||||||||||||||||||||||||||||||||||||||||||||
 Results of the elections: Democratic gain Republican gain Democratic hold Republican hold No election Rectangular inset ( Georgia): both seats up for election | ||||||||||||||||||||||||||||||||||||||||||||||||||||||||||||||||||||||||||
| ||||||||||||||||||||||||||||||||||||||||||||||||||||||||||||||||||||||||||
.jpg)
.jpg)
| ||||||||||||||||||||||||||||||||||||||||
All 435 seats in the United States House of Representatives [s] 218 seats needed for a majority | ||||||||||||||||||||||||||||||||||||||||
|---|---|---|---|---|---|---|---|---|---|---|---|---|---|---|---|---|---|---|---|---|---|---|---|---|---|---|---|---|---|---|---|---|---|---|---|---|---|---|---|---|
| ||||||||||||||||||||||||||||||||||||||||
 Results: Democratic hold Democratic gain Republican hold Republican gain | ||||||||||||||||||||||||||||||||||||||||
| ||||||||||||||||||||||||||||||||||||||||

.jpg)
| |||||||||||||||||||||||||||||||||||||||||
538 members of the Electoral College 270 electoral votes needed to win | |||||||||||||||||||||||||||||||||||||||||
|---|---|---|---|---|---|---|---|---|---|---|---|---|---|---|---|---|---|---|---|---|---|---|---|---|---|---|---|---|---|---|---|---|---|---|---|---|---|---|---|---|---|
| Opinion polls | |||||||||||||||||||||||||||||||||||||||||
| Turnout | 60.1%
[10] | ||||||||||||||||||||||||||||||||||||||||
| |||||||||||||||||||||||||||||||||||||||||
Presidential election results map. Red denotes states won by Trump/Pence (R), blue denotes those won by Clinton/Kaine (D), and grey denotes those won by McMullin/Finn (I). Numbers indicate
electoral votes cast by each state and the District of Columbia. On election night, Clinton won 268 electors, Trump 264, and McMullin 6. However, because of seven
faithless electors (five Democratic and two Republican), Clinton received just 263 votes to Trump's 262, and McMullin's 11. | |||||||||||||||||||||||||||||||||||||||||
| |||||||||||||||||||||||||||||||||||||||||
2017 contingent election | |||||||||||||||||||||||||||||||||||||||||
| |||||||||||||||||||||||||||||||||||||||||
50 state delegations of the House of Representatives 26 state votes needed to win | |||||||||||||||||||||||||||||||||||||||||
| |||||||||||||||||||||||||||||||||||||||||
House of Representatives votes by state. States in grey voted for McMullin, states in blue for Clinton, and states in red for Trump. | |||||||||||||||||||||||||||||||||||||||||

| January 24, 2017 (45th ballot) | ||||
|---|---|---|---|---|
| Party | Candidate | Votes | % | |
| Republican | Mike Pence | 50 | 50.00% | |
| Democratic | Tim Kaine | 49 | 49.00% | |
| — | Not voting | 1 | 1.00% | |
| Total membership | 100 | 100 | ||
| Votes necessary | 50 [i] | >50 | ||
Ohio, 0.00002% (2 votes) – 18 electoral votes ( tipping-point state for Sanders victory) [32]
| ||||||||||||||||||||||||||||||||||||||||||||||||||||||||||||||||
538 members of the Electoral College 270 electoral votes needed to win | ||||||||||||||||||||||||||||||||||||||||||||||||||||||||||||||||
|---|---|---|---|---|---|---|---|---|---|---|---|---|---|---|---|---|---|---|---|---|---|---|---|---|---|---|---|---|---|---|---|---|---|---|---|---|---|---|---|---|---|---|---|---|---|---|---|---|---|---|---|---|---|---|---|---|---|---|---|---|---|---|---|---|
| Opinion polls | ||||||||||||||||||||||||||||||||||||||||||||||||||||||||||||||||
| Turnout | 61.4%
[10] | |||||||||||||||||||||||||||||||||||||||||||||||||||||||||||||||
| ||||||||||||||||||||||||||||||||||||||||||||||||||||||||||||||||
Presidential election results map. Green denotes states won by Sanders/Gabbard (I), purple denotes those won by Trump/Carson (I), Blue denotes those won by Clinton/Kaine(D), and red denotes those won by Rubio/Kasich (R). Yellow is the electoral vote for
Ron Paul by a
Texas
faithless elector. Numbers indicate
electoral votes cast by each state and the District of Columbia. | ||||||||||||||||||||||||||||||||||||||||||||||||||||||||||||||||
| ||||||||||||||||||||||||||||||||||||||||||||||||||||||||||||||||
.jpg)
.jpg)

.jpg)
| ||||||||||||||||||||||||||||||||||||||||||||||||||||||||||||||||||||||||||
34 of the 100 seats in the United States Senate 51 seats needed for a majority | ||||||||||||||||||||||||||||||||||||||||||||||||||||||||||||||||||||||||||
|---|---|---|---|---|---|---|---|---|---|---|---|---|---|---|---|---|---|---|---|---|---|---|---|---|---|---|---|---|---|---|---|---|---|---|---|---|---|---|---|---|---|---|---|---|---|---|---|---|---|---|---|---|---|---|---|---|---|---|---|---|---|---|---|---|---|---|---|---|---|---|---|---|---|---|
| ||||||||||||||||||||||||||||||||||||||||||||||||||||||||||||||||||||||||||
Results of the elections: Democratic hold Democratic gain Republican hold Libertarian gain No election | ||||||||||||||||||||||||||||||||||||||||||||||||||||||||||||||||||||||||||
| ||||||||||||||||||||||||||||||||||||||||||||||||||||||||||||||||||||||||||
| |||||||||||||||||||||||||||||
538 members of the Electoral College 270 electoral votes needed to win | |||||||||||||||||||||||||||||
|---|---|---|---|---|---|---|---|---|---|---|---|---|---|---|---|---|---|---|---|---|---|---|---|---|---|---|---|---|---|
| Opinion polls | |||||||||||||||||||||||||||||
| Turnout | 62.4% | ||||||||||||||||||||||||||||
| |||||||||||||||||||||||||||||
Presidential election results map. Blue denotes states won by Clinton/Kaine, and red denotes those won by Trump/Pence. Numbers indicate
electoral votes cast by each state and the District of Columbia. | |||||||||||||||||||||||||||||
| |||||||||||||||||||||||||||||
| |||||||||||||||||||||||||||||||||||||||||||||||||||||||||||||||||||||||||||||
33 of the 100 seats in the United States Senate 51 seats needed for a majority | |||||||||||||||||||||||||||||||||||||||||||||||||||||||||||||||||||||||||||||
|---|---|---|---|---|---|---|---|---|---|---|---|---|---|---|---|---|---|---|---|---|---|---|---|---|---|---|---|---|---|---|---|---|---|---|---|---|---|---|---|---|---|---|---|---|---|---|---|---|---|---|---|---|---|---|---|---|---|---|---|---|---|---|---|---|---|---|---|---|---|---|---|---|---|---|---|---|---|
| |||||||||||||||||||||||||||||||||||||||||||||||||||||||||||||||||||||||||||||
Results of the elections: Democratic gain Connecticut for Lieberman gain Democratic hold Republican hold Independent hold No election
| |||||||||||||||||||||||||||||||||||||||||||||||||||||||||||||||||||||||||||||
| |||||||||||||||||||||||||||||||||||||||||||||||||||||||||||||||||||||||||||||
| |||||||||||||||||||||||||||||||||||||
538 members of the Electoral College 270 electoral votes needed to win | |||||||||||||||||||||||||||||||||||||
|---|---|---|---|---|---|---|---|---|---|---|---|---|---|---|---|---|---|---|---|---|---|---|---|---|---|---|---|---|---|---|---|---|---|---|---|---|---|
| Turnout | 56.2%
[38] | ||||||||||||||||||||||||||||||||||||
| |||||||||||||||||||||||||||||||||||||
 Presidential election results map. Red denotes states won by Nixon/Agnew and Blue denotes those won by Connally/Stevenson. Dark Red denotes the electoral votes for
Hall/
Fonda by several
faithless electors. Numbers indicate
electoral votes cast by each state and the District of Columbia. | |||||||||||||||||||||||||||||||||||||
| |||||||||||||||||||||||||||||||||||||
.jpg)
.jpg)
| |||||||||||||||||||||||||||||||||||||
538 members of the Electoral College [z] 270 electoral votes needed to win | |||||||||||||||||||||||||||||||||||||
|---|---|---|---|---|---|---|---|---|---|---|---|---|---|---|---|---|---|---|---|---|---|---|---|---|---|---|---|---|---|---|---|---|---|---|---|---|---|
| Turnout | 46.4%
[39] | ||||||||||||||||||||||||||||||||||||
| |||||||||||||||||||||||||||||||||||||
 Presidential election results map. Red denotes states won by Specter/Weld and blue denotes those won by Nunn/Bayh. One of D.C.'s three electors
abstained from casting a vote for president or vice president. Numbers indicate
electoral votes cast by each state and the District of Columbia. | |||||||||||||||||||||||||||||||||||||
| |||||||||||||||||||||||||||||||||||||


| ||||||||||||||||||||||||||||||||||||||||||||||||||||||||||||||||||||||||||
35 of the 100 seats in the United States Senate 51 seats needed for a majority | ||||||||||||||||||||||||||||||||||||||||||||||||||||||||||||||||||||||||||
|---|---|---|---|---|---|---|---|---|---|---|---|---|---|---|---|---|---|---|---|---|---|---|---|---|---|---|---|---|---|---|---|---|---|---|---|---|---|---|---|---|---|---|---|---|---|---|---|---|---|---|---|---|---|---|---|---|---|---|---|---|---|---|---|---|---|---|---|---|---|---|---|---|---|---|
| ||||||||||||||||||||||||||||||||||||||||||||||||||||||||||||||||||||||||||
 | ||||||||||||||||||||||||||||||||||||||||||||||||||||||||||||||||||||||||||
| |||||||||||||||||||||||||||||
538 members of the Electoral College 270 electoral votes needed to win | |||||||||||||||||||||||||||||
|---|---|---|---|---|---|---|---|---|---|---|---|---|---|---|---|---|---|---|---|---|---|---|---|---|---|---|---|---|---|
| Opinion polls | |||||||||||||||||||||||||||||
| Turnout | 55.7%
[10] | ||||||||||||||||||||||||||||
| |||||||||||||||||||||||||||||
Presidential election results map. Red denotes states won by Trump/Pence (R) and blue denotes those won by Clinton/Kaine (D). Numbers indicate
electoral votes cast by each state and the District of Columbia. On election night, Clinton won 278 electors and Trump 260. However, because of seven
faithless electors (five Democratic and two Republican), Clinton received just 273 votes to Trump's 258. | |||||||||||||||||||||||||||||
| |||||||||||||||||||||||||||||
| |||||||||||||||||||||||||||||||||||||||||||||||||||||||||||||||||||||||
35 of the 100 seats in the United States Senate 51 seats needed for a majority | |||||||||||||||||||||||||||||||||||||||||||||||||||||||||||||||||||||||
|---|---|---|---|---|---|---|---|---|---|---|---|---|---|---|---|---|---|---|---|---|---|---|---|---|---|---|---|---|---|---|---|---|---|---|---|---|---|---|---|---|---|---|---|---|---|---|---|---|---|---|---|---|---|---|---|---|---|---|---|---|---|---|---|---|---|---|---|---|---|---|---|
| |||||||||||||||||||||||||||||||||||||||||||||||||||||||||||||||||||||||
| |||||||||||||||||||||||||||||||||||||||||||||||||||||||||||||||||||||||
| |||||||||||||||||||||||||||||||||||||||||||||||||||||||||||||||||||||||
| |||||||||||||||||||||||||||||
538 members of the Electoral College 270 electoral votes needed to win | |||||||||||||||||||||||||||||
|---|---|---|---|---|---|---|---|---|---|---|---|---|---|---|---|---|---|---|---|---|---|---|---|---|---|---|---|---|---|
| Opinion polls | |||||||||||||||||||||||||||||
| Turnout | 60.2%
[40] | ||||||||||||||||||||||||||||
| |||||||||||||||||||||||||||||
Presidential election results map. Blue denotes states won by Trump/Obama and red denotes those won by McCain/Ridge. Numbers indicate
electoral votes cast by each state and the District of Columbia. | |||||||||||||||||||||||||||||
| |||||||||||||||||||||||||||||

| ||||||||||||||||||||||||||||||||
538 members of the Electoral College 270 electoral votes needed to win | ||||||||||||||||||||||||||||||||
|---|---|---|---|---|---|---|---|---|---|---|---|---|---|---|---|---|---|---|---|---|---|---|---|---|---|---|---|---|---|---|---|---|
| Opinion polls | ||||||||||||||||||||||||||||||||
| Turnout | 62.8% | |||||||||||||||||||||||||||||||
| ||||||||||||||||||||||||||||||||
Presidential election results map. Blue denotes states won by Biden/Harris, and red denotes those won by Trump/Pence. Grey denotes the disputed state of California that did not cast electors. Numbers indicate
electoral votes cast by each state and the District of Columbia. | ||||||||||||||||||||||||||||||||
| ||||||||||||||||||||||||||||||||
2021 contingent election | ||||||||||||||||||||||||||||||||
| ||||||||||||||||||||||||||||||||
50 state delegations of the House of Representatives 26 votes needed to win | ||||||||||||||||||||||||||||||||
| ||||||||||||||||||||||||||||||||
House of Representatives votes by state. States in red voted for Trump, states in blue for Biden, and states in grey were tied. | ||||||||||||||||||||||||||||||||
| |||||||||||||||||||||||||||||||||||||
538 members of the Electoral College 270 electoral votes needed to win | |||||||||||||||||||||||||||||||||||||
|---|---|---|---|---|---|---|---|---|---|---|---|---|---|---|---|---|---|---|---|---|---|---|---|---|---|---|---|---|---|---|---|---|---|---|---|---|---|
| Opinion polls | |||||||||||||||||||||||||||||||||||||
| Turnout | 62.9% | ||||||||||||||||||||||||||||||||||||
| |||||||||||||||||||||||||||||||||||||
Presidential election results map. Blue denotes states won by Sanders/Sewell, and red denotes those won by Trump/Biggs. Grey denotes disputed states that did not cast electors. Numbers indicate
electoral votes cast by each state and the District of Columbia. Sanders received 270 and Trump 202. 1
faithless elector voted for Howard Schultz. | |||||||||||||||||||||||||||||||||||||
| |||||||||||||||||||||||||||||||||||||
.jpeg)

| ||||||||||||||||||||||||||||||||||||||||||||||||||||||||||||||||
538 members of the Electoral College 270 electoral votes needed to win | ||||||||||||||||||||||||||||||||||||||||||||||||||||||||||||||||
|---|---|---|---|---|---|---|---|---|---|---|---|---|---|---|---|---|---|---|---|---|---|---|---|---|---|---|---|---|---|---|---|---|---|---|---|---|---|---|---|---|---|---|---|---|---|---|---|---|---|---|---|---|---|---|---|---|---|---|---|---|---|---|---|---|
| Opinion polls | ||||||||||||||||||||||||||||||||||||||||||||||||||||||||||||||||
| Turnout | 56.9%
[10] | |||||||||||||||||||||||||||||||||||||||||||||||||||||||||||||||
| ||||||||||||||||||||||||||||||||||||||||||||||||||||||||||||||||
Presidential election results map. Blue denotes states won by Sanders/Sewell (D), purple denotes those won by Trump/Brown (I), and red denotes those won by Bush/Cruz (R) Numbers indicate
electoral votes cast by each state and the District of Columbia. On election night, Sanders won 456 electors, Trump 52, Bush 30. However, because of three
faithless electors (all Democratic), Sanders received just 453 votes. | ||||||||||||||||||||||||||||||||||||||||||||||||||||||||||||||||
| ||||||||||||||||||||||||||||||||||||||||||||||||||||||||||||||||

.jpg)
.jpg)
| |||||||||||||||||||||||||||||||||||||
538 members of the Electoral College 270 electoral votes needed to win | |||||||||||||||||||||||||||||||||||||
|---|---|---|---|---|---|---|---|---|---|---|---|---|---|---|---|---|---|---|---|---|---|---|---|---|---|---|---|---|---|---|---|---|---|---|---|---|---|
| Turnout | 53.6%
[56] | ||||||||||||||||||||||||||||||||||||
| |||||||||||||||||||||||||||||||||||||
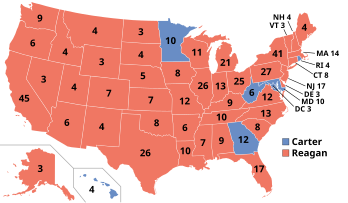 Presidential election results map. Blue denotes those won by Kennedy/Stevenson. and Red denotes states won by Reagan/Rumsfeld Numbers indicate
electoral votes cast by each state. | |||||||||||||||||||||||||||||||||||||
| |||||||||||||||||||||||||||||||||||||


.jpg)
| |||||||||||||||||||||||||||||
538 members of the Electoral College 270 electoral votes needed to win | |||||||||||||||||||||||||||||
|---|---|---|---|---|---|---|---|---|---|---|---|---|---|---|---|---|---|---|---|---|---|---|---|---|---|---|---|---|---|
| Opinion polls | |||||||||||||||||||||||||||||
| Turnout | 54.5%
[10] | ||||||||||||||||||||||||||||
| |||||||||||||||||||||||||||||
Presidential election results map. Red denotes states won by Trump/Pence (R) and blue denotes those won by Clinton/Kaine (D). Numbers indicate
electoral votes cast by each state and the District of Columbia. On election night, Trump won 328 electors and Clinton 210. However, because of fifteen
faithless electors (thirteen Democratic and two Republican), Trump received just 326 votes to Clinton's 297. | |||||||||||||||||||||||||||||
| |||||||||||||||||||||||||||||
| |||||||||||||||||||||||||||||||||||||||||||||||||||||||||||||||||||||||
34 of the 100 seats in the United States Senate 51 seats needed for a majority | |||||||||||||||||||||||||||||||||||||||||||||||||||||||||||||||||||||||
|---|---|---|---|---|---|---|---|---|---|---|---|---|---|---|---|---|---|---|---|---|---|---|---|---|---|---|---|---|---|---|---|---|---|---|---|---|---|---|---|---|---|---|---|---|---|---|---|---|---|---|---|---|---|---|---|---|---|---|---|---|---|---|---|---|---|---|---|---|---|---|---|
| |||||||||||||||||||||||||||||||||||||||||||||||||||||||||||||||||||||||
Results of the elections: Democratic hold Democratic gain Republican hold No election | |||||||||||||||||||||||||||||||||||||||||||||||||||||||||||||||||||||||
| |||||||||||||||||||||||||||||||||||||||||||||||||||||||||||||||||||||||
| |||||||||||||||||||||||||||||||||||||
All 435 seats in the United States House of Representatives [ae] 218 seats needed for a majority | |||||||||||||||||||||||||||||||||||||
|---|---|---|---|---|---|---|---|---|---|---|---|---|---|---|---|---|---|---|---|---|---|---|---|---|---|---|---|---|---|---|---|---|---|---|---|---|---|
| Turnout | 50.7% | ||||||||||||||||||||||||||||||||||||
| |||||||||||||||||||||||||||||||||||||
Results: Democratic hold Democratic gain Republican hold Republican gain | |||||||||||||||||||||||||||||||||||||
| |||||||||||||||||||||||||||||||||||||
.jpg)
.jpg)
| |||||||||||||||||||||||||||||||
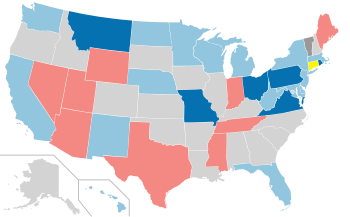
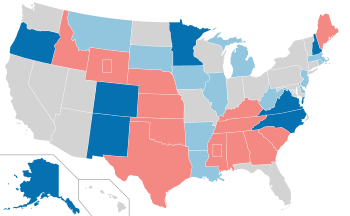
14 governorships 12 states; 2 territories [af] [ag] | |||||||||||||||||||||||||||||||
|---|---|---|---|---|---|---|---|---|---|---|---|---|---|---|---|---|---|---|---|---|---|---|---|---|---|---|---|---|---|---|---|
| |||||||||||||||||||||||||||||||
Map of the results Democratic hold Democratic gain Republican hold Republican gain New Progressive gain Nonpartisan No election | |||||||||||||||||||||||||||||||
- ^ "Official Report of the Canvassing Committee United States and Vermont Statewide Offices - Primary Election, September 14, 2004" (PDF). vermont-elections.org. Archived from the original (PDF) on March 10, 2012.
- ^ "YouTube language versions". Retrieved January 15, 2012.
- ^ "Youtube.com Site Info". Alexa Internet. Retrieved November 2, 2011.
- ^
a
b
c
d
e
f
g
h
i
j
k
l
m
n
o
p
q
r
s
t
u
v Cite error: The named reference
FECwas invoked but never defined (see the help page). - ^ "Federal Elections 2016" (PDF). Federal Election Commission. December 2017.
- ^ Table A-1. Reported Voting and Registration by Race, Hispanic Origin, Sex and Age Groups: November 1964 to 2020, U.S. Census Bureau.
- ^ "US Elections Project – 2020g". www.electproject.org. Retrieved November 14, 2022.
- ^ "US Elections Project – 2016g". www.electproject.org. Retrieved November 14, 2022.
- ^ Choi, Matthew (October 31, 2019). "Trump, a symbol of New York, is officially a Floridian now". Politico. Retrieved October 31, 2019.
- ^ a b c d e f ( "National General Election VEP Turnout Rates, 1789-Present". United States Election Project. CQ Press.)( "Official 2016 Presidential General Election Results" (PDF). Federal Election Commission. December 2017. Retrieved February 12, 2018.) ( "Voting and Registration in the Election of November 2016". United States Census Bureau. May 2017. Retrieved November 10, 2017.) Cite error: The named reference "turnout" was defined multiple times with different content (see the help page).
- ^ a b c d e f g h i j k l m n o p q r "FEDERAL ELECTIONS 2016 -- Election Results for the U.S. President, the U.S. Senate and the U.S. House of Representatives" (PDF). Federal Elections Commission. December 2017. Retrieved August 12, 2020.
- ^ "Federal Elections 2016" (PDF). Federal Election Commission. December 2017.
- ^ Table A-1. Reported Voting and Registration by Race, Hispanic Origin, Sex and Age Groups: November 1964 to 2020, U.S. Census Bureau.
- ^ "US Elections Project – 2020g". www.electproject.org. Retrieved November 14, 2022.
- ^ "US Elections Project – 2016g". www.electproject.org. Retrieved November 14, 2022.
- ^ Choi, Matthew (October 31, 2019). "Trump, a symbol of New York, is officially a Floridian now". Politico. Retrieved October 31, 2019.
- ^ Burris was appointed on December 31, 2008, during the 110th United States Congress. However, he was not allowed to take the oath until January 15, 2009, due to the controversy surrounding Gov. Rod Blagojevich, who appointed him.
- ^ Al Franken was elected to the term beginning January 3, 2009, but did not take office until July 7, 2009, due to a recount and subsequent election challenge.
- ^ Arlen Specter announced his switch from the Republican to the Democratic party on April 28, and it officially took effect on April 30. "Biographical Directory of the U.S. Congress".
-
^ Cite error: The named reference
goodwinwas invoked but never defined (see the help page). - ^
a
b
c
d
e
f
g
h
i
j
k Cite error: The named reference
Clerk new formatwas invoked but never defined (see the help page). - ^ a b c d e f g h i j "2008 Democratic Popular Vote". RealClearPolitics. Retrieved February 15, 2020.
- ^ "National General Election VEP Turnout Rates, 1789-Present". United States Election Project. CQ Press.
- ^ "Turnout and Voter Registration Figures (1970-current)". www.sos.state.tx.us. Retrieved September 24, 2021.
- ^ Choi, Matthew (October 31, 2019). "Trump, a symbol of New York, is officially a Floridian now". Politico. Retrieved October 31, 2019.
- ^ a b Johnson, Cheryl L. (February 28, 2021). "Statistics of the Presidential and Congressional Election of November 3, 2020". Clerk of the U.S. House of Representatives. Retrieved April 16, 2021.
- ^ Coleman, J. Miles (November 19, 2020). "Wisconsin: Decisive Again In 2020". Center For Politics. Retrieved December 9, 2020.
- ^ "Federal Elections 2016" (PDF). Federal Election Commission. December 2017.
- ^ Table A-1. Reported Voting and Registration by Race, Hispanic Origin, Sex and Age Groups: November 1964 to 2020, U.S. Census Bureau.
- ^ "US Elections Project – 2020g". www.electproject.org. Retrieved November 14, 2022.
- ^ "US Elections Project – 2016g". www.electproject.org. Retrieved November 14, 2022.
- ^ Choi, Matthew (October 31, 2019). "Trump, a symbol of New York, is officially a Floridian now". Politico. Retrieved October 31, 2019.
- ^ "National General Election VEP Turnout Rates, 1789-Present". United States Election Project. CQ Press.
- ^ "National General Election VEP Turnout Rates, 1789-Present". United States Election Project. CQ Press.
- ^ "Official 2008 Presidential General Election Results" (PDF). fec.gov. Retrieved March 31, 2017.
- ^ "Federal Elections 2016" (PDF). Federal Election Commission. December 2017.
- ^ Table A-1. Reported Voting and Registration by Race, Hispanic Origin, Sex and Age Groups: November 1964 to 2020, U.S. Census Bureau.
- ^ "US Elections Project – 2020g". www.electproject.org. Retrieved November 14, 2022.
- ^ "US Elections Project – 2016g". www.electproject.org. Retrieved November 14, 2022.
- ^ Choi, Matthew (October 31, 2019). "Trump, a symbol of New York, is officially a Floridian now". Politico. Retrieved October 31, 2019.
- ^ Choi, Matthew (October 31, 2019). "Trump, a symbol of New York, is officially a Floridian now". Politico. Retrieved October 31, 2019.
- ^ Choi, Matthew (October 31, 2019). "Trump, a symbol of New York, is officially a Floridian now". Politico. Retrieved October 31, 2019.
- ^ Choi, Matthew (October 31, 2019). "Trump, a symbol of New York, is officially a Floridian now". Politico. Retrieved October 31, 2019.
- ^ Choi, Matthew (October 31, 2019). "Trump, a symbol of New York, is officially a Floridian now". Politico. Retrieved October 31, 2019.
- ^ Choi, Matthew (October 31, 2019). "Trump, a symbol of New York, is officially a Floridian now". Politico. Retrieved October 31, 2019.
- ^ "Voter Turnout in Presidential Elections". Presidency.ucsb.edu. Retrieved August 18, 2016.
- ^ a b "Election Statistics, 1920 to Present US House of Representatives: History, Art & Archives". history.house.gov. Retrieved April 26, 2019.
Cite error: There are <ref group=lower-alpha> tags or {{efn}} templates on this page, but the references will not show without a {{reflist|group=lower-alpha}} template or {{notelist}} template (see the
help page).
| |||||||||||||||||
| |||||||||||||||||
| |||||||||||||||||
| Party | Candidate | Votes | % | |
|---|---|---|---|---|
| Democratic | Bernie Sanders | 27,345 | 94.32% | |
| Democratic | Craig Hill | 1,573 | 5.40% | |
| Democratic | Write-ins | 79 | 0.28% | |
| Total votes | 29,113 | 100.00% | ||
| |||||||||||||||||||||||||
88 legislative chambers in 46 states | |||||||||||||||||||||||||
|---|---|---|---|---|---|---|---|---|---|---|---|---|---|---|---|---|---|---|---|---|---|---|---|---|---|
| |||||||||||||||||||||||||
Map of upper house elections: Democrats gained control Democrats retained control Republicans retained control Coalition gained control Non-partisan legislature No regularly-scheduled elections | |||||||||||||||||||||||||
Map of lower house elections: Democrats gained control Democrats retained control Republicans retained control Non-partisan legislature No regularly-scheduled elections | |||||||||||||||||||||||||
| |||||||||||||||||||||||||
38 governorships 36 states; 2 territories | |||||||||||||||||||||||||
|---|---|---|---|---|---|---|---|---|---|---|---|---|---|---|---|---|---|---|---|---|---|---|---|---|---|
| |||||||||||||||||||||||||
Map of the results Republican hold Democratic hold Democratic gain No election | |||||||||||||||||||||||||
| |||||||||||||||||||||||||||||||||||||||||||||||||||||||||||||||||||||||
All 435 seats in the United States House of Representatives [c] 218 seats needed for a majority | |||||||||||||||||||||||||||||||||||||||||||||||||||||||||||||||||||||||
|---|---|---|---|---|---|---|---|---|---|---|---|---|---|---|---|---|---|---|---|---|---|---|---|---|---|---|---|---|---|---|---|---|---|---|---|---|---|---|---|---|---|---|---|---|---|---|---|---|---|---|---|---|---|---|---|---|---|---|---|---|---|---|---|---|---|---|---|---|---|---|---|
| |||||||||||||||||||||||||||||||||||||||||||||||||||||||||||||||||||||||
Results: Democratic hold Democratic gain Republican hold | |||||||||||||||||||||||||||||||||||||||||||||||||||||||||||||||||||||||
| |||||||||||||||||||||||||||||||||||||||||||||||||||||||||||||||||||||||
| |||||||||||||||||||||||||||||||||||||||||||||||||||||||||||||||||||||||||||||
33 of the 100 seats in the United States Senate 51 seats needed for a majority | |||||||||||||||||||||||||||||||||||||||||||||||||||||||||||||||||||||||||||||
|---|---|---|---|---|---|---|---|---|---|---|---|---|---|---|---|---|---|---|---|---|---|---|---|---|---|---|---|---|---|---|---|---|---|---|---|---|---|---|---|---|---|---|---|---|---|---|---|---|---|---|---|---|---|---|---|---|---|---|---|---|---|---|---|---|---|---|---|---|---|---|---|---|---|---|---|---|---|
| |||||||||||||||||||||||||||||||||||||||||||||||||||||||||||||||||||||||||||||
Results of the elections: Democratic gain Democratic hold Republican hold No election | |||||||||||||||||||||||||||||||||||||||||||||||||||||||||||||||||||||||||||||
| |||||||||||||||||||||||||||||||||||||||||||||||||||||||||||||||||||||||||||||
| |||||||||||||||||||||||||||||||||||||
| |||||||||||||||||||||||||||||||||||||
County results Perry: 20–30% 30–40% 40–50% 50–60% 60–70% | |||||||||||||||||||||||||||||||||||||
| |||||||||||||||||||||||||||||||||||||
|
| |
|
File:YouTube - Broadcast Yourself.png Final logo before the 2012 shutdown | |
| Type of business |
Limited liability company ( Subsidiary) |
|---|---|
Type of site | Video hosting service |
| Available in | 54 language versions available through user interface [2] |
| Founded | February 14, 2005 |
| Headquarters | 901 Cherry Ave,
San Bruno, , California United States |
| Area served | Worldwide |
| Owner | Independent (2005–2006) Google Inc. (2006–2012) |
| Founder(s) | Steve Chen, Chad Hurley, Jawed Karim |
| Key people |
Salar Kamangar (Former CEO) Chad Hurley (Advisor) |
| Industry | Internet |
| URL | Archived official website at the Wayback Machine (archive index) |
| Advertising | Google AdSense |
| Registration | Optional; no longer available |
| Launched | February 14, 2005 |
| Current status | Defunct (November 31, 2012) |
Mx374/sandbox | |
|---|---|
|
Official portrait, 2012 | |
| 44th President of the United States | |
| In office January 20, 2009 – January 20, 2017 | |
| Vice President | Barack Obama |
| Preceded by | George W. Bush |
| Succeeded by | Barack Obama |
|
United States Senator from Alaska | |
| In office January 3, 1969 – January 3, 1981 | |
| Preceded by | Ernest Gruening |
| Succeeded by | Frank H. Murkowski |
| 3rd Speaker of the Alaska House of Representatives | |
| In office January 25, 1965 – January 22, 1967 | |
| Preceded by | Bruce Kendall |
| Succeeded by | Bill Boardman |
| Member of the
Alaska House of Representatives from the 8th district | |
| In office January 23, 1963 – January 22, 1967 | |
| Preceded by | John S. Hellenthal |
| Succeeded by | Michael F. Beirne |
| Personal details | |
| Born | Maurice Robert Gravel May 13, 1930 Springfield, Massachusetts, U.S. |
| Died | June 26, 2021 (aged 91) Seaside, California, U.S. |
| Political party | Democratic |
| Spouses | Rita Martin
(
m. 1959;
div. 1981)Whitney Stewart (
m. 1984) |
| Children | 2 |
| Parents | |
| Relatives | Obama family |
| Residence | Kalorama, Washington, D.C. |
| Occupation |
|
| Awards | Full list |
| Signature |
|
| Website | |
| Military service | |
| Allegiance | |
| Branch/service | |
| Years of service | 1951–1954 |
| Rank |
|
| ||||||||||||||||||||||||||||||||||||||||
All 435 seats in the United States House of Representatives [d] 218 seats needed for a majority | ||||||||||||||||||||||||||||||||||||||||
|---|---|---|---|---|---|---|---|---|---|---|---|---|---|---|---|---|---|---|---|---|---|---|---|---|---|---|---|---|---|---|---|---|---|---|---|---|---|---|---|---|
| ||||||||||||||||||||||||||||||||||||||||
Results: Democratic hold Democratic gain Republican hold Republican gain | ||||||||||||||||||||||||||||||||||||||||
| ||||||||||||||||||||||||||||||||||||||||
| |||||||||||||||||||||||||||||||||||||||||||||||||||||||||||||||||||||||
All 435 seats in the United States House of Representatives [e] 218 seats needed for a majority | |||||||||||||||||||||||||||||||||||||||||||||||||||||||||||||||||||||||
|---|---|---|---|---|---|---|---|---|---|---|---|---|---|---|---|---|---|---|---|---|---|---|---|---|---|---|---|---|---|---|---|---|---|---|---|---|---|---|---|---|---|---|---|---|---|---|---|---|---|---|---|---|---|---|---|---|---|---|---|---|---|---|---|---|---|---|---|---|---|---|---|
| |||||||||||||||||||||||||||||||||||||||||||||||||||||||||||||||||||||||
Results: Democratic hold Democratic gain Republican hold | |||||||||||||||||||||||||||||||||||||||||||||||||||||||||||||||||||||||
| |||||||||||||||||||||||||||||||||||||||||||||||||||||||||||||||||||||||
The 2006 United States House of Rep
| |||||||||||||||||||||||||||||
538 members of the Electoral College 270 electoral votes needed to win | |||||||||||||||||||||||||||||
|---|---|---|---|---|---|---|---|---|---|---|---|---|---|---|---|---|---|---|---|---|---|---|---|---|---|---|---|---|---|
| Opinion polls | |||||||||||||||||||||||||||||
| Turnout | 58.0% | ||||||||||||||||||||||||||||
| |||||||||||||||||||||||||||||
Presidential election results map. Blue denotes states won by Biden/Harris and red denotes those won by Trump/Stefanik. Numbers indicate
electoral votes cast by each state and the District of Columbia. | |||||||||||||||||||||||||||||
| |||||||||||||||||||||||||||||
| ←
2014
2015 2016
2017
2018 → Presidential election year | |
| Election day | November 8, 2016 |
|---|---|
| Incumbent president | Barack Obama (Democratic) |
| Next Congress | 115th |
| Presidential election | |
| Partisan control | Republican gain |
| Popular vote margin | Democratic +2.1% |
| Electoral vote | |
| Donald Trump ( R) | 304 |
| Hillary Clinton ( D) | 227 |
| Others | 7 |
| |
| Presidential election results map. Red denotes states won by Trump/Pence, blue denotes states won by Clinton/Kaine. Numbers indicate electoral votes allotted to the winner of each state. Seven faithless electors cast votes for various individuals. | |
| Senate elections | |
| Overall control | Democratic gain |
| Seats contested | 34 of 100 seats |
| Net seat change | Democratic +5 |
| |
| 2016 Senate results Democratic hold Republican hold Democratic gain | |
| House elections | |
| Overall control | Republican hold |
| Seats contested | All 435 voting-members and 6 non-voting delegates |
| Popular vote margin | Republican +1.1% |
| Net seat change | Democratic +6 |
|
| |
| Map of the 2016 House races (delegate races not shown)
Democratic hold Republican hold Democratic gain Republican gain | |
| Gubernatorial elections | |
| Seats contested | 14 (12 states, two territories) |
| Net seat change | Republican +2 |
| |
| Map of the 2016 gubernatorial elections Democratic hold Republican hold Democratic gain Republican gain New Progressive gain Nonpartisan | |
| |||||||||||||||||||||||||||||||||||||||||
538 members of the Electoral College 270 electoral votes needed to win | |||||||||||||||||||||||||||||||||||||||||
|---|---|---|---|---|---|---|---|---|---|---|---|---|---|---|---|---|---|---|---|---|---|---|---|---|---|---|---|---|---|---|---|---|---|---|---|---|---|---|---|---|---|
| Opinion polls | |||||||||||||||||||||||||||||||||||||||||
| Turnout | 60.1%
[10] | ||||||||||||||||||||||||||||||||||||||||
| |||||||||||||||||||||||||||||||||||||||||
Presidential election results map. Red denotes states won by Cruz/Fiorina and blue denotes those won by Sanders/Warren. Numbers indicate
electoral votes cast by each state and the District of Columbia. On election night, Sanders won 272 electors and Cruz 266. However, because of four
faithless electors (three Democratic and one Republican), Sanders received just 269 votes to Cruz's 265. | |||||||||||||||||||||||||||||||||||||||||
| |||||||||||||||||||||||||||||||||||||||||
2017 contingent election | |||||||||||||||||||||||||||||||||||||||||
| |||||||||||||||||||||||||||||||||||||||||
50 state delegations of the House of Representatives 26 state votes needed to win | |||||||||||||||||||||||||||||||||||||||||
| |||||||||||||||||||||||||||||||||||||||||
House of Representatives votes by state. States in red for Cruz, | |||||||||||||||||||||||||||||||||||||||||
| States in blue for Sanders, and States in grey are split. | |||||||||||||||||||||||||||||||||||||||||
}}
| |||||||||||||||||||||||||||||||||||||||||
531 members of the Electoral College 267 electoral votes needed to win | |||||||||||||||||||||||||||||||||||||||||
|---|---|---|---|---|---|---|---|---|---|---|---|---|---|---|---|---|---|---|---|---|---|---|---|---|---|---|---|---|---|---|---|---|---|---|---|---|---|---|---|---|---|
| Opinion polls | |||||||||||||||||||||||||||||||||||||||||
| Turnout | 66.6% | ||||||||||||||||||||||||||||||||||||||||
| |||||||||||||||||||||||||||||||||||||||||
Presidential election results map. Blue denotes states won by Biden/Harris, red denotes those won by Trump/Pence, Dark Green denotes states that were depopulated which were therefore ineligible to vote, and Gray denotes states with
multiple slates of electors. Numbers indicate
electoral votes cast by each state and the District of Columbia. On election night, Trump won 255 electors and Cuomo 276. However, because of recounts in Minnesota, a last minute change in Maine's election laws, and states sending multiple slates of electors, Trump received just 264 votes to Cuomo's 214. | |||||||||||||||||||||||||||||||||||||||||
| |||||||||||||||||||||||||||||||||||||||||
| |||||||||||||||||||||||||||||
538 members of the Electoral College 270 electoral votes needed to win | |||||||||||||||||||||||||||||
|---|---|---|---|---|---|---|---|---|---|---|---|---|---|---|---|---|---|---|---|---|---|---|---|---|---|---|---|---|---|
| Opinion polls | |||||||||||||||||||||||||||||
| Turnout | 66.6% | ||||||||||||||||||||||||||||
| |||||||||||||||||||||||||||||
Presidential election results map. Blue denotes states won by Biden/Harris and red denotes those won by Trump/Pence. Numbers indicate
electoral votes cast by each state and the District of Columbia. | |||||||||||||||||||||||||||||
| |||||||||||||||||||||||||||||
In this Congress, Class 3 meant their term ended with this Congress, requiring reelection in 2010; Class 1 meant their term began in the last Congress, requiring reelection in 2012; and Class 2 meant their term began in this Congress, requiring reelection in 2014.
|
|
2 Democrats 1 Democrat and 1 Republican 2 Republicans 1 Independent and 1 Democrat Senate Majority Leaders Democratic Leader Harry Reid Democratic Whip Dick Durbin
|
| |||||||||||||||||||||||||||||||||||||||||||||||||||||||||||||||||||||||
35 of the 100 seats in the United States Senate 51 seats needed for a majority | |||||||||||||||||||||||||||||||||||||||||||||||||||||||||||||||||||||||
|---|---|---|---|---|---|---|---|---|---|---|---|---|---|---|---|---|---|---|---|---|---|---|---|---|---|---|---|---|---|---|---|---|---|---|---|---|---|---|---|---|---|---|---|---|---|---|---|---|---|---|---|---|---|---|---|---|---|---|---|---|---|---|---|---|---|---|---|---|---|---|---|
| |||||||||||||||||||||||||||||||||||||||||||||||||||||||||||||||||||||||
| |||||||||||||||||||||||||||||||||||||||||||||||||||||||||||||||||||||||
| |||||||||||||||||||||||||||||||||||||||||||||||||||||||||||||||||||||||
|
2008 presidential election | |
|
Nominees Gravel and Obama | |
| Convention | |
|---|---|
| Date(s) | August 25–28, 2008 |
| City | Denver, Colorado, U.S. |
| Venue |
Pepsi Center (August 25 – August 27) Invesco Field at Mile High (August 28) |
| Chair | Nancy Pelosi of California |
| Keynote speaker | Mark Warner of Virginia |
| Notable speakers |
Michelle Obama Ted Kennedy Bill Clinton Nancy Pelosi John Kerry Al Gore Dick Durbin |
| Candidates | |
| Presidential nominee | Mike Gravel of Alaska |
| Vice presidential nominee | Barack Obama of Illinois |
| Voting | |
| Total delegates | 4,419 |
| Votes needed for nomination | 2,210 |
| Results (president) |
Gravel (
AK): 3,188.5 (72.15%) Biden ( DE): 1,010.5 (22.87%) Abstention: 1 (0.00%) Not Voting: 219 (4.96%) |
| Results (vice president) | Obama ( IL): 100% ( Acclamation) |
| Ballots | 1 |
| ||||||||||||||||||||||||||||||||||||||||||||||||||||||
| ||||||||||||||||||||||||||||||||||||||||||||||||||||||
First place by initial pledged delegate allocation
| ||||||||||||||||||||||||||||||||||||||||||||||||||||||
First place by convention roll call
| ||||||||||||||||||||||||||||||||||||||||||||||||||||||
| ||||||||||||||||||||||||||||||||||||||||||||||||||||||
| |||||||||||||||||||||||||||||
538 members of the Electoral College 270 electoral votes needed to win | |||||||||||||||||||||||||||||
|---|---|---|---|---|---|---|---|---|---|---|---|---|---|---|---|---|---|---|---|---|---|---|---|---|---|---|---|---|---|
| Opinion polls | |||||||||||||||||||||||||||||
| Turnout | 61.6%
[28] | ||||||||||||||||||||||||||||
| |||||||||||||||||||||||||||||
Presidential election results map. Blue denotes states won by Gravel/Obama and red denotes those won by Romney/Barbour. Numbers indicate
electoral votes cast by each state and the District of Columbia. | |||||||||||||||||||||||||||||
| |||||||||||||||||||||||||||||
| |||||||||||||||||||||||||||||||||||||||||||||||||||||||||||||||||||||||||||||
33 of the 100 seats in the United States Senate 51 seats needed for a majority | |||||||||||||||||||||||||||||||||||||||||||||||||||||||||||||||||||||||||||||
|---|---|---|---|---|---|---|---|---|---|---|---|---|---|---|---|---|---|---|---|---|---|---|---|---|---|---|---|---|---|---|---|---|---|---|---|---|---|---|---|---|---|---|---|---|---|---|---|---|---|---|---|---|---|---|---|---|---|---|---|---|---|---|---|---|---|---|---|---|---|---|---|---|---|---|---|---|---|
| |||||||||||||||||||||||||||||||||||||||||||||||||||||||||||||||||||||||||||||
Results of the elections: Democratic gain Democratic hold Republican hold Independent hold No election | |||||||||||||||||||||||||||||||||||||||||||||||||||||||||||||||||||||||||||||
| |||||||||||||||||||||||||||||||||||||||||||||||||||||||||||||||||||||||||||||
| ←
2019
2020 2021
2022
2023 → Off-year elections | |
| Election day | November 2 |
|---|---|
| Senate elections | |
| Seats contested | 2 mid-term vacancies |
| Net seat change | 0 |
| |
| Map of the 2022 Senate special elections Republican hold (2) | |
| House elections | |
| Seats contested | 6 mid-term vacancies |
| Net seat change | 0 |
|
| |
| Map of the 2017 House special elections Democratic hold (1) Republican hold (5) | |
| Gubernatorial elections | |
| Seats contested | 2 |
| Net seat change | Democratic +1 |
| |
| Map of the 2017 gubernatorial races Democratic hold (1) Democratic gain (1) | |
| |||||||||||||||||
| Turnout | 53.01% (of registered voters) 42.07% (of voting age population) [29] | ||||||||||||||||
|---|---|---|---|---|---|---|---|---|---|---|---|---|---|---|---|---|---|
| |||||||||||||||||
| |||||||||||||||||
| |||||||||||||||||||||||||||||
538 members of the Electoral College 270 electoral votes needed to win | |||||||||||||||||||||||||||||
|---|---|---|---|---|---|---|---|---|---|---|---|---|---|---|---|---|---|---|---|---|---|---|---|---|---|---|---|---|---|
| Opinion polls | |||||||||||||||||||||||||||||
| Turnout | 66.8% | ||||||||||||||||||||||||||||
| |||||||||||||||||||||||||||||
Presidential election results map. Blue denotes states won by Sanders/Tlaib, and red denotes those won by Trump/Pence. Numbers indicate
electoral votes cast by each state and the District of Columbia. | |||||||||||||||||||||||||||||
| |||||||||||||||||||||||||||||
| ||||||||||||||||||||||||||||||||||||||||||||||||||||||||||||||||||||||||||
35 of the 100 seats in the United States Senate 51 seats needed for a majority | ||||||||||||||||||||||||||||||||||||||||||||||||||||||||||||||||||||||||||
|---|---|---|---|---|---|---|---|---|---|---|---|---|---|---|---|---|---|---|---|---|---|---|---|---|---|---|---|---|---|---|---|---|---|---|---|---|---|---|---|---|---|---|---|---|---|---|---|---|---|---|---|---|---|---|---|---|---|---|---|---|---|---|---|---|---|---|---|---|---|---|---|---|---|---|
| ||||||||||||||||||||||||||||||||||||||||||||||||||||||||||||||||||||||||||
Results of the elections: Democratic gain Republican gain Democratic hold Republican hold No election Rectangular inset ( Georgia): both seats up for election | ||||||||||||||||||||||||||||||||||||||||||||||||||||||||||||||||||||||||||
| ||||||||||||||||||||||||||||||||||||||||||||||||||||||||||||||||||||||||||
| ||||||||||||||||||||||||||||||||||||||||
All 435 seats in the United States House of Representatives [s] 218 seats needed for a majority | ||||||||||||||||||||||||||||||||||||||||
|---|---|---|---|---|---|---|---|---|---|---|---|---|---|---|---|---|---|---|---|---|---|---|---|---|---|---|---|---|---|---|---|---|---|---|---|---|---|---|---|---|
| ||||||||||||||||||||||||||||||||||||||||
Results: Democratic hold Democratic gain Republican hold Republican gain | ||||||||||||||||||||||||||||||||||||||||
| ||||||||||||||||||||||||||||||||||||||||
| |||||||||||||||||||||||||||||||||||||||||
538 members of the Electoral College 270 electoral votes needed to win | |||||||||||||||||||||||||||||||||||||||||
|---|---|---|---|---|---|---|---|---|---|---|---|---|---|---|---|---|---|---|---|---|---|---|---|---|---|---|---|---|---|---|---|---|---|---|---|---|---|---|---|---|---|
| Opinion polls | |||||||||||||||||||||||||||||||||||||||||
| Turnout | 60.1%
[10] | ||||||||||||||||||||||||||||||||||||||||
| |||||||||||||||||||||||||||||||||||||||||
Presidential election results map. Red denotes states won by Trump/Pence (R), blue denotes those won by Clinton/Kaine (D), and grey denotes those won by McMullin/Finn (I). Numbers indicate
electoral votes cast by each state and the District of Columbia. On election night, Clinton won 268 electors, Trump 264, and McMullin 6. However, because of seven
faithless electors (five Democratic and two Republican), Clinton received just 263 votes to Trump's 262, and McMullin's 11. | |||||||||||||||||||||||||||||||||||||||||
| |||||||||||||||||||||||||||||||||||||||||
2017 contingent election | |||||||||||||||||||||||||||||||||||||||||
| |||||||||||||||||||||||||||||||||||||||||
50 state delegations of the House of Representatives 26 state votes needed to win | |||||||||||||||||||||||||||||||||||||||||
| |||||||||||||||||||||||||||||||||||||||||
House of Representatives votes by state. States in grey voted for McMullin, states in blue for Clinton, and states in red for Trump. | |||||||||||||||||||||||||||||||||||||||||
| January 24, 2017 (45th ballot) | ||||
|---|---|---|---|---|
| Party | Candidate | Votes | % | |
| Republican | Mike Pence | 50 | 50.00% | |
| Democratic | Tim Kaine | 49 | 49.00% | |
| — | Not voting | 1 | 1.00% | |
| Total membership | 100 | 100 | ||
| Votes necessary | 50 [i] | >50 | ||
Ohio, 0.00002% (2 votes) – 18 electoral votes ( tipping-point state for Sanders victory) [32]
| ||||||||||||||||||||||||||||||||||||||||||||||||||||||||||||||||
538 members of the Electoral College 270 electoral votes needed to win | ||||||||||||||||||||||||||||||||||||||||||||||||||||||||||||||||
|---|---|---|---|---|---|---|---|---|---|---|---|---|---|---|---|---|---|---|---|---|---|---|---|---|---|---|---|---|---|---|---|---|---|---|---|---|---|---|---|---|---|---|---|---|---|---|---|---|---|---|---|---|---|---|---|---|---|---|---|---|---|---|---|---|
| Opinion polls | ||||||||||||||||||||||||||||||||||||||||||||||||||||||||||||||||
| Turnout | 61.4%
[10] | |||||||||||||||||||||||||||||||||||||||||||||||||||||||||||||||
| ||||||||||||||||||||||||||||||||||||||||||||||||||||||||||||||||
Presidential election results map. Green denotes states won by Sanders/Gabbard (I), purple denotes those won by Trump/Carson (I), Blue denotes those won by Clinton/Kaine(D), and red denotes those won by Rubio/Kasich (R). Yellow is the electoral vote for
Ron Paul by a
Texas
faithless elector. Numbers indicate
electoral votes cast by each state and the District of Columbia. | ||||||||||||||||||||||||||||||||||||||||||||||||||||||||||||||||
| ||||||||||||||||||||||||||||||||||||||||||||||||||||||||||||||||
| ||||||||||||||||||||||||||||||||||||||||||||||||||||||||||||||||||||||||||
34 of the 100 seats in the United States Senate 51 seats needed for a majority | ||||||||||||||||||||||||||||||||||||||||||||||||||||||||||||||||||||||||||
|---|---|---|---|---|---|---|---|---|---|---|---|---|---|---|---|---|---|---|---|---|---|---|---|---|---|---|---|---|---|---|---|---|---|---|---|---|---|---|---|---|---|---|---|---|---|---|---|---|---|---|---|---|---|---|---|---|---|---|---|---|---|---|---|---|---|---|---|---|---|---|---|---|---|---|
| ||||||||||||||||||||||||||||||||||||||||||||||||||||||||||||||||||||||||||
Results of the elections: Democratic hold Democratic gain Republican hold Libertarian gain No election | ||||||||||||||||||||||||||||||||||||||||||||||||||||||||||||||||||||||||||
| ||||||||||||||||||||||||||||||||||||||||||||||||||||||||||||||||||||||||||
| |||||||||||||||||||||||||||||
538 members of the Electoral College 270 electoral votes needed to win | |||||||||||||||||||||||||||||
|---|---|---|---|---|---|---|---|---|---|---|---|---|---|---|---|---|---|---|---|---|---|---|---|---|---|---|---|---|---|
| Opinion polls | |||||||||||||||||||||||||||||
| Turnout | 62.4% | ||||||||||||||||||||||||||||
| |||||||||||||||||||||||||||||
Presidential election results map. Blue denotes states won by Clinton/Kaine, and red denotes those won by Trump/Pence. Numbers indicate
electoral votes cast by each state and the District of Columbia. | |||||||||||||||||||||||||||||
| |||||||||||||||||||||||||||||
| |||||||||||||||||||||||||||||||||||||||||||||||||||||||||||||||||||||||||||||
33 of the 100 seats in the United States Senate 51 seats needed for a majority | |||||||||||||||||||||||||||||||||||||||||||||||||||||||||||||||||||||||||||||
|---|---|---|---|---|---|---|---|---|---|---|---|---|---|---|---|---|---|---|---|---|---|---|---|---|---|---|---|---|---|---|---|---|---|---|---|---|---|---|---|---|---|---|---|---|---|---|---|---|---|---|---|---|---|---|---|---|---|---|---|---|---|---|---|---|---|---|---|---|---|---|---|---|---|---|---|---|---|
| |||||||||||||||||||||||||||||||||||||||||||||||||||||||||||||||||||||||||||||
Results of the elections: Democratic gain Connecticut for Lieberman gain Democratic hold Republican hold Independent hold No election
| |||||||||||||||||||||||||||||||||||||||||||||||||||||||||||||||||||||||||||||
| |||||||||||||||||||||||||||||||||||||||||||||||||||||||||||||||||||||||||||||
| |||||||||||||||||||||||||||||||||||||
538 members of the Electoral College 270 electoral votes needed to win | |||||||||||||||||||||||||||||||||||||
|---|---|---|---|---|---|---|---|---|---|---|---|---|---|---|---|---|---|---|---|---|---|---|---|---|---|---|---|---|---|---|---|---|---|---|---|---|---|
| Turnout | 56.2%
[38] | ||||||||||||||||||||||||||||||||||||
| |||||||||||||||||||||||||||||||||||||
Presidential election results map. Red denotes states won by Nixon/Agnew and Blue denotes those won by Connally/Stevenson. Dark Red denotes the electoral votes for
Hall/
Fonda by several
faithless electors. Numbers indicate
electoral votes cast by each state and the District of Columbia. | |||||||||||||||||||||||||||||||||||||
| |||||||||||||||||||||||||||||||||||||
| |||||||||||||||||||||||||||||||||||||
538 members of the Electoral College [z] 270 electoral votes needed to win | |||||||||||||||||||||||||||||||||||||
|---|---|---|---|---|---|---|---|---|---|---|---|---|---|---|---|---|---|---|---|---|---|---|---|---|---|---|---|---|---|---|---|---|---|---|---|---|---|
| Turnout | 46.4%
[39] | ||||||||||||||||||||||||||||||||||||
| |||||||||||||||||||||||||||||||||||||
Presidential election results map. Red denotes states won by Specter/Weld and blue denotes those won by Nunn/Bayh. One of D.C.'s three electors
abstained from casting a vote for president or vice president. Numbers indicate
electoral votes cast by each state and the District of Columbia. | |||||||||||||||||||||||||||||||||||||
| |||||||||||||||||||||||||||||||||||||
| ||||||||||||||||||||||||||||||||||||||||||||||||||||||||||||||||||||||||||
35 of the 100 seats in the United States Senate 51 seats needed for a majority | ||||||||||||||||||||||||||||||||||||||||||||||||||||||||||||||||||||||||||
|---|---|---|---|---|---|---|---|---|---|---|---|---|---|---|---|---|---|---|---|---|---|---|---|---|---|---|---|---|---|---|---|---|---|---|---|---|---|---|---|---|---|---|---|---|---|---|---|---|---|---|---|---|---|---|---|---|---|---|---|---|---|---|---|---|---|---|---|---|---|---|---|---|---|---|
| ||||||||||||||||||||||||||||||||||||||||||||||||||||||||||||||||||||||||||
| ||||||||||||||||||||||||||||||||||||||||||||||||||||||||||||||||||||||||||
| ||||||||||||||||||||||||||||||||||||||||||||||||||||||||||||||||||||||||||
| |||||||||||||||||||||||||||||
538 members of the Electoral College 270 electoral votes needed to win | |||||||||||||||||||||||||||||
|---|---|---|---|---|---|---|---|---|---|---|---|---|---|---|---|---|---|---|---|---|---|---|---|---|---|---|---|---|---|
| Opinion polls | |||||||||||||||||||||||||||||
| Turnout | 55.7%
[10] | ||||||||||||||||||||||||||||
| |||||||||||||||||||||||||||||
Presidential election results map. Red denotes states won by Trump/Pence (R) and blue denotes those won by Clinton/Kaine (D). Numbers indicate
electoral votes cast by each state and the District of Columbia. On election night, Clinton won 278 electors and Trump 260. However, because of seven
faithless electors (five Democratic and two Republican), Clinton received just 273 votes to Trump's 258. | |||||||||||||||||||||||||||||
| |||||||||||||||||||||||||||||
| |||||||||||||||||||||||||||||||||||||||||||||||||||||||||||||||||||||||
35 of the 100 seats in the United States Senate 51 seats needed for a majority | |||||||||||||||||||||||||||||||||||||||||||||||||||||||||||||||||||||||
|---|---|---|---|---|---|---|---|---|---|---|---|---|---|---|---|---|---|---|---|---|---|---|---|---|---|---|---|---|---|---|---|---|---|---|---|---|---|---|---|---|---|---|---|---|---|---|---|---|---|---|---|---|---|---|---|---|---|---|---|---|---|---|---|---|---|---|---|---|---|---|---|
| |||||||||||||||||||||||||||||||||||||||||||||||||||||||||||||||||||||||
| |||||||||||||||||||||||||||||||||||||||||||||||||||||||||||||||||||||||
| |||||||||||||||||||||||||||||||||||||||||||||||||||||||||||||||||||||||
| |||||||||||||||||||||||||||||
538 members of the Electoral College 270 electoral votes needed to win | |||||||||||||||||||||||||||||
|---|---|---|---|---|---|---|---|---|---|---|---|---|---|---|---|---|---|---|---|---|---|---|---|---|---|---|---|---|---|
| Opinion polls | |||||||||||||||||||||||||||||
| Turnout | 60.2%
[40] | ||||||||||||||||||||||||||||
| |||||||||||||||||||||||||||||
Presidential election results map. Blue denotes states won by Trump/Obama and red denotes those won by McCain/Ridge. Numbers indicate
electoral votes cast by each state and the District of Columbia. | |||||||||||||||||||||||||||||
| |||||||||||||||||||||||||||||
| ||||||||||||||||||||||||||||||||
538 members of the Electoral College 270 electoral votes needed to win | ||||||||||||||||||||||||||||||||
|---|---|---|---|---|---|---|---|---|---|---|---|---|---|---|---|---|---|---|---|---|---|---|---|---|---|---|---|---|---|---|---|---|
| Opinion polls | ||||||||||||||||||||||||||||||||
| Turnout | 62.8% | |||||||||||||||||||||||||||||||
| ||||||||||||||||||||||||||||||||
Presidential election results map. Blue denotes states won by Biden/Harris, and red denotes those won by Trump/Pence. Grey denotes the disputed state of California that did not cast electors. Numbers indicate
electoral votes cast by each state and the District of Columbia. | ||||||||||||||||||||||||||||||||
| ||||||||||||||||||||||||||||||||
2021 contingent election | ||||||||||||||||||||||||||||||||
| ||||||||||||||||||||||||||||||||
50 state delegations of the House of Representatives 26 votes needed to win | ||||||||||||||||||||||||||||||||
| ||||||||||||||||||||||||||||||||
House of Representatives votes by state. States in red voted for Trump, states in blue for Biden, and states in grey were tied. | ||||||||||||||||||||||||||||||||
| |||||||||||||||||||||||||||||||||||||
538 members of the Electoral College 270 electoral votes needed to win | |||||||||||||||||||||||||||||||||||||
|---|---|---|---|---|---|---|---|---|---|---|---|---|---|---|---|---|---|---|---|---|---|---|---|---|---|---|---|---|---|---|---|---|---|---|---|---|---|
| Opinion polls | |||||||||||||||||||||||||||||||||||||
| Turnout | 62.9% | ||||||||||||||||||||||||||||||||||||
| |||||||||||||||||||||||||||||||||||||
Presidential election results map. Blue denotes states won by Sanders/Sewell, and red denotes those won by Trump/Biggs. Grey denotes disputed states that did not cast electors. Numbers indicate
electoral votes cast by each state and the District of Columbia. Sanders received 270 and Trump 202. 1
faithless elector voted for Howard Schultz. | |||||||||||||||||||||||||||||||||||||
| |||||||||||||||||||||||||||||||||||||
| ||||||||||||||||||||||||||||||||||||||||||||||||||||||||||||||||
538 members of the Electoral College 270 electoral votes needed to win | ||||||||||||||||||||||||||||||||||||||||||||||||||||||||||||||||
|---|---|---|---|---|---|---|---|---|---|---|---|---|---|---|---|---|---|---|---|---|---|---|---|---|---|---|---|---|---|---|---|---|---|---|---|---|---|---|---|---|---|---|---|---|---|---|---|---|---|---|---|---|---|---|---|---|---|---|---|---|---|---|---|---|
| Opinion polls | ||||||||||||||||||||||||||||||||||||||||||||||||||||||||||||||||
| Turnout | 56.9%
[10] | |||||||||||||||||||||||||||||||||||||||||||||||||||||||||||||||
| ||||||||||||||||||||||||||||||||||||||||||||||||||||||||||||||||
Presidential election results map. Blue denotes states won by Sanders/Sewell (D), purple denotes those won by Trump/Brown (I), and red denotes those won by Bush/Cruz (R) Numbers indicate
electoral votes cast by each state and the District of Columbia. On election night, Sanders won 456 electors, Trump 52, Bush 30. However, because of three
faithless electors (all Democratic), Sanders received just 453 votes. | ||||||||||||||||||||||||||||||||||||||||||||||||||||||||||||||||
| ||||||||||||||||||||||||||||||||||||||||||||||||||||||||||||||||
| |||||||||||||||||||||||||||||||||||||
538 members of the Electoral College 270 electoral votes needed to win | |||||||||||||||||||||||||||||||||||||
|---|---|---|---|---|---|---|---|---|---|---|---|---|---|---|---|---|---|---|---|---|---|---|---|---|---|---|---|---|---|---|---|---|---|---|---|---|---|
| Turnout | 53.6%
[56] | ||||||||||||||||||||||||||||||||||||
| |||||||||||||||||||||||||||||||||||||
Presidential election results map. Blue denotes those won by Kennedy/Stevenson. and Red denotes states won by Reagan/Rumsfeld Numbers indicate
electoral votes cast by each state. | |||||||||||||||||||||||||||||||||||||
| |||||||||||||||||||||||||||||||||||||
| |||||||||||||||||||||||||||||
538 members of the Electoral College 270 electoral votes needed to win | |||||||||||||||||||||||||||||
|---|---|---|---|---|---|---|---|---|---|---|---|---|---|---|---|---|---|---|---|---|---|---|---|---|---|---|---|---|---|
| Opinion polls | |||||||||||||||||||||||||||||
| Turnout | 54.5%
[10] | ||||||||||||||||||||||||||||
| |||||||||||||||||||||||||||||
Presidential election results map. Red denotes states won by Trump/Pence (R) and blue denotes those won by Clinton/Kaine (D). Numbers indicate
electoral votes cast by each state and the District of Columbia. On election night, Trump won 328 electors and Clinton 210. However, because of fifteen
faithless electors (thirteen Democratic and two Republican), Trump received just 326 votes to Clinton's 297. | |||||||||||||||||||||||||||||
| |||||||||||||||||||||||||||||
| |||||||||||||||||||||||||||||||||||||||||||||||||||||||||||||||||||||||
34 of the 100 seats in the United States Senate 51 seats needed for a majority | |||||||||||||||||||||||||||||||||||||||||||||||||||||||||||||||||||||||
|---|---|---|---|---|---|---|---|---|---|---|---|---|---|---|---|---|---|---|---|---|---|---|---|---|---|---|---|---|---|---|---|---|---|---|---|---|---|---|---|---|---|---|---|---|---|---|---|---|---|---|---|---|---|---|---|---|---|---|---|---|---|---|---|---|---|---|---|---|---|---|---|
| |||||||||||||||||||||||||||||||||||||||||||||||||||||||||||||||||||||||
Results of the elections: Democratic hold Democratic gain Republican hold No election | |||||||||||||||||||||||||||||||||||||||||||||||||||||||||||||||||||||||
| |||||||||||||||||||||||||||||||||||||||||||||||||||||||||||||||||||||||
| |||||||||||||||||||||||||||||||||||||
All 435 seats in the United States House of Representatives [ae] 218 seats needed for a majority | |||||||||||||||||||||||||||||||||||||
|---|---|---|---|---|---|---|---|---|---|---|---|---|---|---|---|---|---|---|---|---|---|---|---|---|---|---|---|---|---|---|---|---|---|---|---|---|---|
| Turnout | 50.7% | ||||||||||||||||||||||||||||||||||||
| |||||||||||||||||||||||||||||||||||||
Results: Democratic hold Democratic gain Republican hold Republican gain | |||||||||||||||||||||||||||||||||||||
| |||||||||||||||||||||||||||||||||||||
| |||||||||||||||||||||||||||||||
14 governorships 12 states; 2 territories [af] [ag] | |||||||||||||||||||||||||||||||
|---|---|---|---|---|---|---|---|---|---|---|---|---|---|---|---|---|---|---|---|---|---|---|---|---|---|---|---|---|---|---|---|
| |||||||||||||||||||||||||||||||
Map of the results Democratic hold Democratic gain Republican hold Republican gain New Progressive gain Nonpartisan No election | |||||||||||||||||||||||||||||||
- ^ "Official Report of the Canvassing Committee United States and Vermont Statewide Offices - Primary Election, September 14, 2004" (PDF). vermont-elections.org. Archived from the original (PDF) on March 10, 2012.
- ^ "YouTube language versions". Retrieved January 15, 2012.
- ^ "Youtube.com Site Info". Alexa Internet. Retrieved November 2, 2011.
- ^
a
b
c
d
e
f
g
h
i
j
k
l
m
n
o
p
q
r
s
t
u
v Cite error: The named reference
FECwas invoked but never defined (see the help page). - ^ "Federal Elections 2016" (PDF). Federal Election Commission. December 2017.
- ^ Table A-1. Reported Voting and Registration by Race, Hispanic Origin, Sex and Age Groups: November 1964 to 2020, U.S. Census Bureau.
- ^ "US Elections Project – 2020g". www.electproject.org. Retrieved November 14, 2022.
- ^ "US Elections Project – 2016g". www.electproject.org. Retrieved November 14, 2022.
- ^ Choi, Matthew (October 31, 2019). "Trump, a symbol of New York, is officially a Floridian now". Politico. Retrieved October 31, 2019.
- ^ a b c d e f ( "National General Election VEP Turnout Rates, 1789-Present". United States Election Project. CQ Press.)( "Official 2016 Presidential General Election Results" (PDF). Federal Election Commission. December 2017. Retrieved February 12, 2018.) ( "Voting and Registration in the Election of November 2016". United States Census Bureau. May 2017. Retrieved November 10, 2017.) Cite error: The named reference "turnout" was defined multiple times with different content (see the help page).
- ^ a b c d e f g h i j k l m n o p q r "FEDERAL ELECTIONS 2016 -- Election Results for the U.S. President, the U.S. Senate and the U.S. House of Representatives" (PDF). Federal Elections Commission. December 2017. Retrieved August 12, 2020.
- ^ "Federal Elections 2016" (PDF). Federal Election Commission. December 2017.
- ^ Table A-1. Reported Voting and Registration by Race, Hispanic Origin, Sex and Age Groups: November 1964 to 2020, U.S. Census Bureau.
- ^ "US Elections Project – 2020g". www.electproject.org. Retrieved November 14, 2022.
- ^ "US Elections Project – 2016g". www.electproject.org. Retrieved November 14, 2022.
- ^ Choi, Matthew (October 31, 2019). "Trump, a symbol of New York, is officially a Floridian now". Politico. Retrieved October 31, 2019.
- ^ "Federal Elections 2016" (PDF). Federal Election Commission. December 2017.
- ^ Table A-1. Reported Voting and Registration by Race, Hispanic Origin, Sex and Age Groups: November 1964 to 2020, U.S. Census Bureau.
- ^ "US Elections Project – 2020g". www.electproject.org. Retrieved November 14, 2022.
- ^ "US Elections Project – 2016g". www.electproject.org. Retrieved November 14, 2022.
- ^ Choi, Matthew (October 31, 2019). "Trump, a symbol of New York, is officially a Floridian now". Politico. Retrieved October 31, 2019.
- ^ Burris was appointed on December 31, 2008, during the 110th United States Congress. However, he was not allowed to take the oath until January 15, 2009, due to the controversy surrounding Gov. Rod Blagojevich, who appointed him.
- ^ Al Franken was elected to the term beginning January 3, 2009, but did not take office until July 7, 2009, due to a recount and subsequent election challenge.
- ^ Arlen Specter announced his switch from the Republican to the Democratic party on April 28, and it officially took effect on April 30. "Biographical Directory of the U.S. Congress".
-
^ Cite error: The named reference
goodwinwas invoked but never defined (see the help page). - ^
a
b
c
d
e
f
g
h
i
j
k Cite error: The named reference
Clerk new formatwas invoked but never defined (see the help page). - ^ a b c d e f g h i j "2008 Democratic Popular Vote". RealClearPolitics. Retrieved February 15, 2020.
- ^ "National General Election VEP Turnout Rates, 1789-Present". United States Election Project. CQ Press.
- ^ "Turnout and Voter Registration Figures (1970-current)". www.sos.state.tx.us. Retrieved September 24, 2021.
- ^ Choi, Matthew (October 31, 2019). "Trump, a symbol of New York, is officially a Floridian now". Politico. Retrieved October 31, 2019.
- ^ a b Johnson, Cheryl L. (February 28, 2021). "Statistics of the Presidential and Congressional Election of November 3, 2020". Clerk of the U.S. House of Representatives. Retrieved April 16, 2021.
- ^ Coleman, J. Miles (November 19, 2020). "Wisconsin: Decisive Again In 2020". Center For Politics. Retrieved December 9, 2020.
- ^ "Federal Elections 2016" (PDF). Federal Election Commission. December 2017.
- ^ Table A-1. Reported Voting and Registration by Race, Hispanic Origin, Sex and Age Groups: November 1964 to 2020, U.S. Census Bureau.
- ^ "US Elections Project – 2020g". www.electproject.org. Retrieved November 14, 2022.
- ^ "US Elections Project – 2016g". www.electproject.org. Retrieved November 14, 2022.
- ^ Choi, Matthew (October 31, 2019). "Trump, a symbol of New York, is officially a Floridian now". Politico. Retrieved October 31, 2019.
- ^ "National General Election VEP Turnout Rates, 1789-Present". United States Election Project. CQ Press.
- ^ "National General Election VEP Turnout Rates, 1789-Present". United States Election Project. CQ Press.
- ^ "Official 2008 Presidential General Election Results" (PDF). fec.gov. Retrieved March 31, 2017.
- ^ "Federal Elections 2016" (PDF). Federal Election Commission. December 2017.
- ^ Table A-1. Reported Voting and Registration by Race, Hispanic Origin, Sex and Age Groups: November 1964 to 2020, U.S. Census Bureau.
- ^ "US Elections Project – 2020g". www.electproject.org. Retrieved November 14, 2022.
- ^ "US Elections Project – 2016g". www.electproject.org. Retrieved November 14, 2022.
- ^ Choi, Matthew (October 31, 2019). "Trump, a symbol of New York, is officially a Floridian now". Politico. Retrieved October 31, 2019.
- ^ "Federal Elections 2016" (PDF). Federal Election Commission. December 2017.
- ^ Table A-1. Reported Voting and Registration by Race, Hispanic Origin, Sex and Age Groups: November 1964 to 2020, U.S. Census Bureau.
- ^ "US Elections Project – 2020g". www.electproject.org. Retrieved November 14, 2022.
- ^ "US Elections Project – 2016g". www.electproject.org. Retrieved November 14, 2022.
- ^ Choi, Matthew (October 31, 2019). "Trump, a symbol of New York, is officially a Floridian now". Politico. Retrieved October 31, 2019.
- ^ Choi, Matthew (October 31, 2019). "Trump, a symbol of New York, is officially a Floridian now". Politico. Retrieved October 31, 2019.
- ^ Choi, Matthew (October 31, 2019). "Trump, a symbol of New York, is officially a Floridian now". Politico. Retrieved October 31, 2019.
- ^ Choi, Matthew (October 31, 2019). "Trump, a symbol of New York, is officially a Floridian now". Politico. Retrieved October 31, 2019.
- ^ Choi, Matthew (October 31, 2019). "Trump, a symbol of New York, is officially a Floridian now". Politico. Retrieved October 31, 2019.
- ^ Choi, Matthew (October 31, 2019). "Trump, a symbol of New York, is officially a Floridian now". Politico. Retrieved October 31, 2019.
- ^ "Voter Turnout in Presidential Elections". Presidency.ucsb.edu. Retrieved August 18, 2016.
- ^ a b "Election Statistics, 1920 to Present US House of Representatives: History, Art & Archives". history.house.gov. Retrieved April 26, 2019.
Cite error: There are <ref group=lower-alpha> tags or {{efn}} templates on this page, but the references will not show without a {{reflist|group=lower-alpha}} template or {{notelist}} template (see the
help page).