| Timeline of the 1993 Pacific hurricane season | |||||
|---|---|---|---|---|---|
 Season summary map | |||||
| Season boundaries | |||||
| First system formed | June 11, 1993 | ||||
| Last system dissipated | October 14, 1993 | ||||
| Strongest system | |||||
| Name | Lidia | ||||
| Maximum winds | 240 km/h (150 mph) (1-minute sustained) | ||||
| Lowest pressure | 930 hPa ( mbar) | ||||
| Longest lasting system | |||||
| Name | Greg | ||||
| Duration | 14.00 days | ||||
| |||||
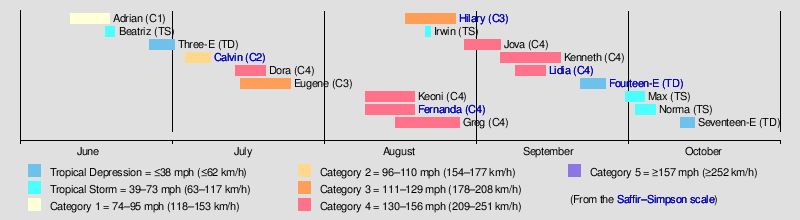
The 1993 Pacific hurricane season was an event in the annual formation of tropical cyclones over the Pacific Ocean north of the Equator and east of the International Date Line. The season officially began on May 15 in the Eastern Pacific proper (east of 140°W) and June 1 in the Central Pacific (140°W to the International Date Line), and ended on November 30. These dates conventionally delineate the period each year during which tropical cyclones tend to form in the basin according to the National Hurricane Center. [1] A total of eighteen tropical depressions formed; fifteen of these developed into named tropical storms, of which eleven became hurricanes and nine became major hurricanes (Category 3 or higher on the Saffir–Simpson scale). [2] The number of tropical storms was near the long-term average; the number of hurricanes was slightly above average, and the number of major hurricanes was more than double the average of four. [1] [3] As with many active Pacific hurricane seasons, El Niño conditions greatly influenced this season's high activity levels. [4] Several long-lived and powerful hurricanes contributed to an overall Accumulated Cyclone Energy value of 201.8 units, the eighth-highest on record for a Pacific hurricane season as of February 2024. [nb 1] [6] The first system, Hurricane Adrian, developed on June 11; the final system, Tropical Depression Seventeen-E, dissipated on October 14.
The most impactful storm of the season was Hurricane Calvin, which made landfall near Manzanillo in the Mexican state of Colima as a Category 2 hurricane; it killed more than 30 people, [nb 2] mainly due to significant flooding, and damages amounted to $32 million (1993 USD). [10] Two months later, Hurricane Lidia came ashore at a similar intensity farther to the northwest along the coast of Sinaloa, where it caused considerable damage and multiple fatalities. [nb 3] [3] In conjunction with a cold front, Lidia's remnants generated severe weather in Texas, including a tornado that caused $8 million (1993 USD) in damage. [12] Earlier in the season, Tropical Storm Beatriz killed 6 people in Mexico when it struck the southern portion of the country, [3] while Tropical Depression Three-E produced heavy rainfall that amounted to nearly a foot (12 in; 30.48 cm) in Acapulco despite remaining offshore. [13] Hurricane Hilary made three landfalls in Mexico – twice on the Baja California peninsula as a tropical storm, and then on the Mexican mainland as a tropical depression – but caused no loss of life and little damage. [14] Hurricanes Dora, Eugene, and Fernanda produced minor impacts in Hawaii; Eugene made landfall on the Big Island as a tropical depression, while Fernanda prompted the issuance of a hurricane warning, though this was discontinued when the storm turned away. [15]
Four time zones are utilized in the Eastern Pacific basin. They are, from east to west: Central east of 106°W; Mountain from 106°W to 114.9°W; Pacific from 115°W to 139.9°W; and Hawaii−Aleutian from 140°W to the International Date Line. For convenience, each event is listed in Coordinated Universal Time (UTC) first, using the 24-hour clock (where 00:00 = midnight UTC), [16] with the respective local time included in parentheses. Figures for maximum sustained winds and position estimates are rounded to the nearest five units ( knots, miles, or kilometers) and averaged over one minute, following National Hurricane Center practice. Direct wind observations are rounded to the nearest whole number. Atmospheric pressures are listed to the nearest millibar and nearest hundredth of an inch of mercury. This timeline documents the formation of tropical cyclones as well as the strengthening, weakening, landfalls, extratropical transitions, and dissipations during the season. It includes information that was not released while the storm was active, meaning that data from post-storm reviews by the National Hurricane Center and the Central Pacific Hurricane Center is included.
Timeline of events
May
May 15
- The 1993 Eastern Pacific hurricane season officially begins. [1]
- No tropical cyclones formed in May.
June
June 1
- The 1993 Central Pacific hurricane season officially begins. [1]

June 11
- 06:00 UTC (12:00 a.m. MDT) at 9°42′N 114°36′W / 9.7°N 114.6°W – The first tropical depression of the season forms an area of disturbed weather about 960 mi (1,545 km) south-southwest of the southern tip of the Baja California peninsula. [17] [18]
June 12
- 06:00 UTC (11:00 p.m. PDT, June 11) at 9°54′N 115°18′W / 9.9°N 115.3°W – The tropical depression strengthens into Tropical Storm Adrian about 960 mi (1,545 km) south-southwest of the southern tip of the Baja California peninsula. [17] [18]
June 15
- 12:00 UTC (5:00 a.m. PDT) at 11°48′N 119°00′W / 11.8°N 119.0°W – Tropical Storm Adrian strengthens into a Category 1 hurricane about 965 mi (1,555 km) southwest of the southern tip of the Baja California peninsula. [17] [18]
June 16
- 00:00 UTC (5:00 p.m. PDT, June 15) at 13°00′N 119°36′W / 13.0°N 119.6°W – Hurricane Adrian reaches peak winds of 85 mph (140 km/h) and a minimum barometric pressure of 979 mbar (28.91 inHg) about 930 mi (1,500 km) southwest of the southern tip of the Baja California peninsula. [17] [18]
June 17
- 00:00 UTC (5:00 p.m. PDT, June 16) at 14°42′N 119°36′W / 14.7°N 119.6°W – Hurricane Adrian weakens into a tropical storm about 845 mi (1,360 km) southwest of the southern tip of the Baja California peninsula. [18]
- 18:00 UTC (11:00 a.m. PDT) at 14°24′N 119°00′W / 14.4°N 119.0°W – Tropical Storm Adrian weakens into a tropical depression about 835 mi (1,345 km) southwest of the southern tip of the Baja California peninsula. [18]

June 18
- 06:00 UTC (1:00 a.m. CDT) at 13°24′N 95°24′W / 13.4°N 95.4°W – A tropical depression forms from an area of low pressure about 175 mi (280 km) south-southeast of Huatulco, Mexico. [19] [20]
- 12:00 UTC (7:00 a.m. CDT) at 13°36′N 95°48′W / 13.6°N 95.8°W – The tropical depression strengthens into Tropical Storm Beatriz about 150 mi (240 km) south-southeast of Huatulco, Mexico. [19] [20]
June 19
- 12:00 UTC (5:00 a.m. PDT) at 13°30′N 118°18′W / 13.5°N 118.3°W – Tropical Depression Adrian is last noted about 845 mi (1,360 km) southwest of the southern tip of the Baja California peninsula; it dissipates six hours later. [18]
- 18:00 UTC (1:00 p.m. CDT) at 15°54′N 97°48′W / 15.9°N 97.8°W – Tropical Storm Beatriz reaches peak winds of 65 mph (100 km/h) and a minimum barometric pressure of 995 millibars (29.38 inHg). It simultaneously makes landfall near Laguna de la Pastoría in the Mexican state of Oaxaca. [19] [20]
June 20
- 00:00 UTC (7:00 p.m. CDT, June 19) at 17°00′N 98°00′W / 17.0°N 98.0°W – Tropical Storm Beatriz weakens into a tropical depression inland over southwestern Mexico; it dissipates six hours later. [20]
June 27

- 00:00 UTC (7:00 p.m. CDT, June 26) at 13°54′N 95°18′W / 13.9°N 95.3°W – Tropical Depression Three-E forms from a large area of disturbed weather about 115 mi (185 km) south of the Gulf of Tehuantepec. [13] [21]
- 12:00 UTC (7:00 a.m. CDT) at 14°36′N 96°06′W / 14.6°N 96.1°W – Tropical Depression Three-E reaches peak winds of 35 mph (55 km/h) about 110 mi (175 km) southeast of Puerto Escondido, Oaxaca. [21]
June 30
- 18:00 UTC (12:00 p.m. MDT) at 20°18′N 108°24′W / 20.3°N 108.4°W – Tropical Depression Three-E reaches a minimum barometric pressure of 1,006 mbar (29.71 inHg) about 295 mi (475 km) south-southeast of La Paz, Baja California Sur. [21]
July
July 2
- 00:00 UTC (6:00 p.m. MDT, July 1) at 24°30′N 110°12′W / 24.5°N 110.2°W – Tropical Depression Three-E is last noted just north of La Paz, Baja California Sur; it dissipates shortly thereafter. [13] [21]
July 4

- 12:00 UTC (7:00 a.m. CDT) at 12°54′N 97°42′W / 12.9°N 97.7°W – A tropical depression forms from an area of disturbed weather about 315 mi (510 km) southeast of Acapulco, Guerrero. [22] [23]
July 5
- 00:00 UTC (7:00 p.m. CDT, July 4) at 12°42′N 98°54′W / 12.7°N 98.9°W – The tropical depression strengthens into Tropical Storm Calvin about 295 mi (475 km) south-southeast of Acapulco, Guerrero. [22] [23]
July 6
- 00:00 UTC (7:00 p.m. CDT, July 5) at 13°36′N 100°06′W / 13.6°N 100.1°W – Tropical Storm Calvin strengthens into a Category 1 hurricane about 225 mi (360 km) south of Acapulco, Guerrero. [22] [23]
- 12:00 UTC (7:00 a.m. CDT) at 15°24′N 100°24′W / 15.4°N 100.4°W – Hurricane Calvin strengthens to Category 2 intensity about 110 mi (175 km) south-southwest of Acapulco, Guerrero. [23]
July 7
- 12:00 UTC (7:00 a.m. CDT) at 18°12′N 104°06′W / 18.2°N 104.1°W – Hurricane Calvin reaches peak winds of 110 mph (175 km/h) and a minimum barometric pressure of 966 mbar (28.53 inHg) about 85 mi (140 km) south-southeast of Manzanillo, Colima. [23] [24]
- 18:00 UTC (1:00 p.m. CDT) at 19°24′N 105°00′W / 19.4°N 105.0°W – Hurricane Calvin makes its first landfall about 45 mi (75 km) west-northwest of Manzanillo, Colima with winds of 100 mph (155 km/h) and a minimum barometric pressure of 973 mbar (28.73 inHg). [23] [24]
July 8

- 00:00 UTC (7:00 p.m. CDT, July 7) at 20°30′N 105°36′W / 20.5°N 105.6°W – Hurricane Calvin rapidly weakens into a tropical storm as it re-emerges over the Pacific Ocean about 130 mi (215 km) northwest of Manzanillo, Colima. [23]
- 17:00 UTC (11:00 a.m. MDT) at 23°48′N 109°54′W / 23.8°N 109.9°W – Tropical Storm Calvin weakens into a tropical depression as it makes its second landfall just south of La Paz, Baja California Sur with winds of 35 mph (55 km/h) and a barometric pressure of 1,005 mbar (29.68 inHg). [23]
July 9
- 00:00 UTC (6:00 p.m. MDT, July 8) at 23°30′N 111°00′W / 23.5°N 111.0°W – Tropical Depression Calvin is last noted about 65 mi (100 km) southwest of La Paz, Baja California Sur; it dissipates six hours later. [23]
July 14
- 12:00 UTC (5:00 a.m. PDT) at 11°00′N 118°54′W / 11.0°N 118.9°W – A tropical depression forms from a tropical wave over the open Eastern Pacific Ocean. [25] [26]
- 18:00 UTC (11:00 a.m. PDT) at 11°36′N 120°00′W / 11.6°N 120.0°W – The tropical depression strengthens into Tropical Storm Dora. [25] [26]

July 15
- 18:00 UTC (11:00 a.m. PDT) at 12°48′N 124°36′W / 12.8°N 124.6°W – Tropical Storm Dora strengthens into a Category 1 hurricane. [25] [26]
- 18:00 UTC (10:00 a.m. MDT) at 11°18′N 112°48′W / 11.3°N 112.8°W – Another tropical depression forms from a tropical wave about 805 mi (1,295 km) south-southwest of the southern tip of the Baja California peninsula. [27] [28]
July 16
- 00:00 UTC (5:00 p.m. PDT, July 15) at 12°54′N 125°30′W / 12.9°N 125.5°W – Hurricane Dora strengthens to Category 2 intensity. [26]
- 06:00 UTC (11:00 p.m. PDT, July 15) at 13°06′N 126°30′W / 13.1°N 126.5°W – Hurricane Dora strengthens to Category 3 intensity, making it the first major hurricane of the season. [26]
- 12:00 UTC (5:00 a.m. PDT) at 11°24′N 115°12′W / 11.4°N 115.2°W – The aforementioned tropical depression strengthens into Tropical Storm Eugene about 865 mi (1,390 km) south-southwest of the southern tip of the Baja California peninsula. [27] [28]
- 18:00 UTC (11:00 a.m. PDT) at 13°48′N 128°00′W / 13.8°N 128.0°W – Hurricane Dora strengthens to Category 4 intensity; it simultaneously reaches peak winds of 130 mph (215 km/h). [25] [26]
July 17
- 06:00 UTC (11:00 p.m. PDT, July 16) at 14°54′N 129°36′W / 14.9°N 129.6°W – Hurricane Dora reaches a minimum barometric pressure of 945 mbar (27.91 inHg). [25] [26]
- 06:00 UTC (11:00 p.m. PDT, July 16) at 11°18′N 117°12′W / 11.3°N 117.2°W – Tropical Storm Eugene strengthens into a Category 1 hurricane about 930 mi (1,500 km) south-southwest of the southern tip of the Baja California peninsula. [27] [28]

- 18:00 UTC (11:00 a.m. PDT) at 15°54′N 131°00′W / 15.9°N 131.0°W – Hurricane Dora weakens to Category 3 intensity. [26]
- 18:00 UTC (11:00 a.m. PDT) at 11°06′N 118°06′W / 11.1°N 118.1°W – Hurricane Eugene strengthens to Category 2 intensity about 975 mi (1,565 km) southwest of the southern tip of the Baja California peninsula. [28]
July 18
- 00:00 UTC (5:00 p.m. PDT, July 17) at 16°24′N 132°00′W / 16.4°N 132.0°W – Hurricane Dora weakens to Category 2 intensity. [26]
- 00:00 UTC (5:00 p.m. PDT, July 17) at 11°12′N 118°30′W / 11.2°N 118.5°W – Hurricane Eugene strengthens to Category 3 intensity about 985 mi (1,585 km) southwest of the southern tip of the Baja California peninsula, making it the second major hurricane of the season. [28]
- 06:00 UTC (11:00 p.m. PDT, July 17) at 16°54′N 132°54′W / 16.9°N 132.9°W – Hurricane Dora weakens to Category 1 intensity. [26]
- 18:00 UTC (11:00 a.m. PDT) at 17°24′N 134°36′W / 17.4°N 134.6°W – Hurricane Dora weakens into a tropical storm. [26]
July 19

- 12:00 UTC (5:00 a.m. PDT) at 17°30′N 138°06′W / 17.5°N 138.1°W – Tropical Storm Dora weakens into a tropical depression. [26]
- 12:00 UTC (5:00 a.m. PDT) at 14°54′N 122°18′W / 14.9°N 122.3°W – Hurricane Eugene reaches peak winds of 125 mph (205 km/h) about 980 mi (1,575 km) southwest of the southern tip of the Baja California peninsula. [27] [28]
- 18:00 UTC (11:00 a.m. PDT) at 15°24′N 123°36′W / 15.4°N 123.6°W – Hurricane Eugene reaches a minimum barometric pressure of 948 mbar (27.99 inHg) about 1,030 mi (1,660 km) west-southwest of the southern tip of the Baja California peninsula. [27] [28]
July 20
- 00:00 UTC (2:00 p.m. HST, July 19) at 17°24′N 140°36′W / 17.4°N 140.6°W – Tropical Depression Dora crosses into the Central Pacific basin. [15] [26]
- 18:00 UTC (11:00 a.m. PDT) at 17°12′N 128°54′W / 17.2°N 128.9°W – Hurricane Eugene weakens to Category 2 intensity about 1,290 mi (2,075 km) west-southwest of the southern tip of the Baja California peninsula. [28]
July 21
- 00:00 UTC (2:00 p.m. HST, July 20) at 17°12′N 146°00′W / 17.2°N 146.0°W – Tropical Depression Dora dissipates about 575 mi (925 km) east of the Hawaiian Islands. [15] [25] [26]
July 22
- 00:00 UTC (5:00 p.m. PDT, July 21) at 18°42′N 135°18′W / 18.7°N 135.3°W – Hurricane Eugene weakens to Category 1 intensity about 1,655 mi (2,670 km) west-southwest of the southern tip of the Baja California peninsula. [28]
- 06:00 UTC (11:00 p.m. PDT, July 21) at 18°48′N 136°48′W / 18.8°N 136.8°W – Hurricane Eugene weakens into a tropical storm about 1,755 mi (2,825 km) west-southwest of the southern tip of the Baja California peninsula. [27] [28]
July 23
- 00:00 UTC (2:00 p.m. HST, July 22) at 19°30′N 142°00′W / 19.5°N 142.0°W – Tropical Storm Eugene crosses into the Central Pacific basin about 1,035 mi (1,670 km) east of Honolulu, Hawaii. [nb 4] [15] [28]

- 18:00 UTC (8:00 a.m. HST) at 19°00′N 148°48′W / 19.0°N 148.8°W – Tropical Storm Eugene weakens into a tropical depression about 610 mi (980 km) east-southeast of Honolulu, Hawaii. [28]
July 24
- 12:00 UTC (2:00 a.m. HST) at 19°12′N 155°18′W / 19.2°N 155.3°W – Tropical Depression Eugene makes landfall on the southern portion of the Big Island of Hawaii. [15] [28]
July 25
- 00:00 UTC (2:00 p.m. HST, July 24) at 19°24′N 160°00′W / 19.4°N 160.0°W – Tropical Depression Eugene is last noted about 190 mi (305 km) southwest of Honolulu, Hawaii; it dissipates six hours later. [27] [28]
August
August 9

- 00:00 UTC (2:00 p.m. HST, August 8) at 12°30′N 144°00′W / 12.5°N 144.0°W – Tropical Depression One-C forms from an area of disturbed weather about 1,725 mi (2,780 km) east-southeast of Johnston Atoll. [15]
- 06:00 UTC (1:00 a.m. CDT) at 13°12′N 104°00′W / 13.2°N 104.0°W – Tropical Depression Seven-E forms from a tropical wave about 405 mi (650 km) south of Manzanillo, Colima. [29] [30]
- 18:00 UTC (12:00 p.m. MDT) at 13°42′N 107°24′W / 13.7°N 107.4°W – Tropical Depression Seven-E strengthens into Tropical Storm Fernanda about 635 mi (1,020 km) south-southeast of the southern tip of the Baja California peninsula. [29] [30]
August 10
- 18:00 UTC (12:00 p.m. MDT) at 14°18′N 114°54′W / 14.3°N 114.9°W – Tropical Storm Fernanda strengthens into a Category 1 hurricane about 675 mi (1,085 km) south-southwest of the southern tip of the Baja California peninsula. [29] [30]
August 11
- 00:00 UTC (5:00 p.m. PDT, August 10) at 14°18′N 116°42′W / 14.3°N 116.7°W – Hurricane Fernanda strengthens to Category 2 intensity about 735 mi (1,185 km) southwest of the southern tip of the Baja California peninsula. [30]
- 06:00 UTC (11:00 p.m. PDT, August 10) at 14°18′N 118°36′W / 14.3°N 118.6°W – Hurricane Fernanda strengthens to Category 3 intensity about 815 mi (1,315 km) southwest of the southern tip of the Baja California peninsula, making it the third major hurricane of the season. [30]
- 12:00 UTC (5:00 a.m. PDT) at 14°24′N 120°24′W / 14.4°N 120.4°W – Hurricane Fernanda strengthens to Category 4 intensity about 900 mi (1,445 km) southwest of the southern tip of the Baja California peninsula. [30]
August 12

- 00:00 UTC (5:00 p.m. PDT, August 11) at 14°48′N 123°54′W / 14.8°N 123.9°W – Hurricane Fernanda reaches peak winds of 145 mph (230 km/h) and a minimum barometric pressure of 934 mbar (27.58 inHg) about 1,065 mi (1,715 km) southwest of the southern tip of the Baja California peninsula. [29] [30]
- 18:00 UTC (8:00 a.m. HST) at 11°48′N 151°00′W / 11.8°N 151.0°W – Tropical Depression One-C strengthens into Tropical Storm Keoni about 1,285 mi (2,065 km) east-southeast of Johnston Atoll. [15]
August 13
- 06:00 UTC (11:00 p.m. PDT, August 12) at 16°54′N 132°36′W / 16.9°N 132.6°W – Hurricane Fernanda weakens to Category 3 intensity about 1,525 mi (2,455 km) west-southwest of the southern tip of the Baja California peninsula. [30]
- 18:00 UTC (11:00 a.m. PDT) at 17°42′N 136°06′W / 17.7°N 136.1°W – Hurricane Fernanda weakens to Category 2 intensity about 1,725 mi (2,780 km) west-southwest of the southern tip of the Baja California peninsula. [30]
August 14
- 12:00 UTC (2:00 a.m. HST) ar 18°36′N 141°12′W / 18.6°N 141.2°W – Hurricane Fernanda weakens to Category 1 intensity as it crosses into the Central Pacific basin about 940 mi (1,510 km) east of the Big Island of Hawaii. [nb 5] [15] [29] [30]
- 18:00 UTC (8:00 a.m. HST) at 13°18′N 161°00′W / 13.3°N 161.0°W – Tropical Storm Keoni strengthens into a Category 1 hurricane about 615 mi (990 km) east-southeast of Johnston Atoll. [15]
August 15

- 00:00 UTC (7:00 p.m. CDT, August 14) at 14°48′N 102°24′W / 14.8°N 102.4°W – A tropical depression forms from the remnants of Tropical Storm Bret, which was part of the 1993 Atlantic hurricane season, about 335 mi (535 km) south-southeast of Manzanillo, Colima. [31] [32]
- 12:00 UTC (2:00 a.m. HST) at 13°54′N 165°18′W / 13.9°N 165.3°W – Hurricane Keoni strengthens to Category 2 intensity about 345 mi (555 km) southeast of Johnston Atoll. [15]
- 12:00 UTC (7:00 a.m. CDT) at 16°12′N 104°00′W / 16.2°N 104.0°W – The aforementioned tropical depression strengthens into Tropical Storm Greg about 195 mi (315 km) south of Manzanillo, Colima. [31] [32]
- 18:00 UTC (8:00 a.m. HST) at 20°00′N 148°00′W / 20.0°N 148.0°W – Hurricane Fernanda regains Category 2 status and reaches a secondary peak intensity with winds of 105 mph (165 km/h) and a barometric pressure of 975 mbar (28.79 inHg) about 490 mi (790 km) east of the Big Island of Hawaii. [15] [30]
August 16
- 06:00 UTC (8:00 p.m. HST, August 15) at 14°24′N 169°30′W / 14.4°N 169.5°W – Hurricane Keoni strengthens to Category 3 intensity about 160 mi (260 km) south of Johnston Atoll, making it the fourth major hurricane of the season. [15]
- 12:00 UTC (2:00 a.m. HST) at 14°48′N 170°48′W / 14.8°N 170.8°W – Hurricane Keoni strengthens to Category 4 intensity about 160 mi (260 km) south-southwest of Johnston Atoll. It simultaneously reaches peak winds of 130 mph (215 km/h). [15]
- 12:00 UTC (6:00 a.m. MDT) at 18°30′N 107°30′W / 18.5°N 107.5°W – Tropical Storm Greg strengthens into a Category 1 hurricane about 215 mi (345 km) west of Manzanillo, Colima. [31] [32]
- 18:00 UTC (12:00 a.m. MDT) at 18°48′N 108°00′W / 18.8°N 108.0°W – Hurricane Greg strengthens to Category 2 status about 240 mi (390 km) west of Manzanillo, Colima. It simultaneously reaches its initial peak intensity with winds of 105 mph (165 km/h) and a barometric pressure of 970 mbar (28.64 inHg). [31] [32]
August 17

- 00:00 UTC (2:00 p.m. HST, August 16) at 20°48′N 150°42′W / 20.8°N 150.7°W – Hurricane Fernanda weakens back to Category 1 intensity about 320 mi (520 km) east-northeast of the Big Island of Hawaii. [15] [30]
- 06:00 UTC (1:00 a.m. CDT) at 13°24′N 94°54′W / 13.4°N 94.9°W – Tropical Depression Nine-E forms from a tropical wave over the Gulf of Tehuantepec, about 185 mi (295 km) south-southeast of Huatulco. [14] [33]
- 12:00 UTC (2:00 a.m. HST) at 16°30′N 173°36′W / 16.5°N 173.6°W – Hurricane Keoni weakens to Category 3 intensity about 270 mi (435 km) west of Johnston Atoll. [15]
- 12:00 UTC (6:00 a.m. MDT) at 19°12′N 109°24′W / 19.2°N 109.4°W – Hurricane Greg weakens to Category 1 intensity about 260 mi (415 km) south of the southern tip of the Baja California peninsula. [32]
- 18:00 UTC (8:00 a.m. HST) at 17°00′N 174°12′W / 17.0°N 174.2°W – Hurricane Keoni weakens to Category 2 intensity about 310 mi (500 km) west of Johnston Atoll. [15]
- 18:00 UTC (8:00 a.m. HST) at 23°36′N 151°36′W / 23.6°N 151.6°W – Hurricane Fernanda weakens into a tropical storm about 375 mi (600 km) northeast of the Big Island of Hawaii. [15] [30]
August 18

- 00:00 UTC (7:00 p.m. CDT, August 17) at 13°24′N 95°42′W / 13.4°N 95.7°W – Tropical Depression Nine-E strengthens into Tropical Storm Hilary about 140 mi (220 km) south of Huatulco. [14] [33]
- 12:00 UTC (2:00 a.m. HST) at 18°00′N 175°42′W / 18.0°N 175.7°W – Hurricane Keoni weakens to Category 1 intensity about 415 mi (665 km) west of Johnston Atoll. [15]
- 18:00 UTC (12:00 p.m. MDT) at 18°18′N 112°48′W / 18.3°N 112.8°W – Hurricane Greg regains Category 2 intensity about 360 mi (585 km) south-southwest of the southern tip of the Baja California peninsula. [32]
August 19
- 06:00 UTC (12:00 a.m. MDT) at 18°18′N 114°42′W / 18.3°N 114.7°W – Hurricane Greg strengthens to Category 3 intensity about 435 mi (705 km) southwest of the southern tip of the Baja California peninsula, making it the fifth major hurricane of the season. [32]
- 12:00 UTC (2:00 a.m. HST) at 29°42′N 154°00′W / 29.7°N 154.0°W – Tropical Storm Fernanda is last noted as a tropical cyclone about 700 mi (1,130 km) north of the Big Island of Hawaii; it transitions into an extratropical cyclone six hours later. [15] [30]
- 12:00 UTC (5:00 a.m. PDT) at 18°12′N 115°48′W / 18.2°N 115.8°W – Hurricane Greg strengthens to Category 4 intensity about 495 mi (795 km) southwest of the southern tip of the Baja California peninsula. It simultaneously reaches peak winds of 130 mph (215 km/h). [31] [32]
- 12:00 UTC (7:00 a.m. CDT) at 14°48′N 102°12′W / 14.8°N 102.2°W – Tropical Storm Hilary strengthens into a Category 1 hurricane about 330 mi (530 km) south-southeast of Manzanillo, Colima. [14] [33]
- 18:00 UTC (8:00 a.m. HST) at 20°06′N 180°00′W / 20.1°N 180.0°W – Hurricane Keoni crosses the International Date Line about 725 mi (1,165 km) west-northwest of Johnston Atoll and is redesignated as Typhoon Keoni in the Western Pacific basin. [15]
- 18:00 UTC (11:00 a.m. PDT) at 18°12′N 116°48′W / 18.2°N 116.8°W – Hurricane Greg reaches a minimum barometric pressure of 948 mbar (27.99 inHg) about 540 mi (870 km) southwest of the southern tip of the Baja California peninsula. [31] [32]
August 20

- 18:00 UTC (11:00 a.m. PDT) at 18°30′N 120°42′W / 18.5°N 120.7°W – Hurricane Greg weakens to Category 3 intensity about 755 mi (1,215 km) west-southwest of the southern tip of the Baja California peninsula. [32]
- 18:00 UTC (12:00 p.m. MDT) at 17°42′N 106°18′W / 17.7°N 106.3°W – Hurricane Hilary strengthens to Category 2 intensity about 160 mi (260 km) southwest of Manzanillo, Colima. [34]
August 21
- 06:00 UTC (12:00 a.m. MDT) at 18°18′N 107°24′W / 18.3°N 107.4°W – Hurricane Hilary strengthens to Category 3 intensity about 205 mi (335 km) west-southwest of Manzanillo, Colima, making it the sixth major hurricane of the season. [34]
- 06:00 UTC (1:00 a.m. CDT) at 13°24′N 99°54′W / 13.4°N 99.9°W – A tropical depression forms from a tropical wave about 490 mi (790 km) southeast of Manzanillo, Colima. [35] [36]
- 12:00 UTC (5:00 a.m. PDT) at 18°42′N 123°18′W / 18.7°N 123.3°W – Hurricane Greg weakens to Category 2 intensity about 910 mi (1,465 km) west-southwest of the southern tip of the Baja California peninsula. [32] [37]
- 12:00 UTC (6:00 a.m. MDT) at 18°36′N 107°54′W / 18.6°N 107.9°W – Hurricane Hilary reaches peak winds of 120 mph (195 km/h) and a minimum barometric pressure of 957 mbar (28.26 inHg) about 235 mi (380 km) west of Manzanillo, Colima. [33] [34]
- 12:00 UTC (7:00 a.m. CDT) at 14°12′N 101°00′W / 14.2°N 101.0°W – The aforementioned tropical depression strengthens into Tropical Storm Irwin about 405 mi (650 km) southeast of Manzanillo, Colima. [35] [36]
August 22
- 00:00 UTC (7:00 p.m. CDT, August 21) at 16°42′N 102°54′W / 16.7°N 102.9°W – Tropical Storm Irwin reaches peak winds of 70 mph (110 km/h) and a minimum barometric pressure of 999 mbar (29.50 inHg) about 190 mi (305 km) south-southeast of Manzanillo, Colima. [35] [36]
- 06:00 UTC (12:00 a.m. MDT) at 20°06′N 109°42′W / 20.1°N 109.7°W – Hurricane Hilary weakens to Category 2 intensity about 190 mi (305 km) south of the southern tip of the Baja California peninsula. [34]

- 12:00 UTC (7:00 a.m. CDT) at 18°42′N 105°00′W / 18.7°N 105.0°W – Tropical Storm Irwin weakens into a tropical depression about 50 mi (85 km) west-southwest of Manzanillo, Colima; it is absorbed by Hurricane Hilary six hours later. [35] [36]
- 18:00 UTC (11:00 a.m. PDT) at 19°18′N 127°54′W / 19.3°N 127.9°W – Hurricane Greg weakens to Category 1 intensity about 1,180 mi (1,900 km) west-southwest of the southern tip of the Baja California peninsula. [32] [37]
- 18:00 UTC (12:00 p.m. MDT) at 20°00′N 110°42′W / 20.0°N 110.7°W – Hurricane Hilary weakens to Category 1 intensity about 200 mi (325 km) south-southwest of the southern tip of the Baja California peninsula. [34]
August 23
- 00:00 UTC (6:00 p.m. MDT, August 22) at 20°00′N 110°30′W / 20.0°N 110.5°W – Hurricane Hilary weakens into a tropical storm about 200 mi (325 km) south of the southern tip of the Baja California peninsula. [34]
August 25
- 13:00 UTC (7:00 a.m. MDT) at 24°48′N 112°18′W / 24.8°N 112.3°W – Tropical Storm Hilary makes its first landfall on the west coast of the Baja California peninsula about 130 mi (215 km) west-northwest of La Paz with winds of 60 mph (95 km/h) and a barometric pressure of 993 mbar (29.32 inHg), re-emerging over the Pacific Ocean shortly thereafter. [34] [38]
- 18:00 UTC (12:00 p.m. MDT) at 25°18′N 112°18′W / 25.3°N 112.3°W – Tropical Storm Hilary reaches its secondary peak intensity with winds of 65 mph (100 km/h) and a barometric pressure of 991 mbar (29.26 inHg) about 150 mi (240 km) west-northwest of La Paz. [34] [38]
August 26

- 00:00 UTC (5:00 p.m. PDT, August 25) at 19°30′N 135°18′W / 19.5°N 135.3°W – Hurricane Greg weakens into a tropical storm about 1,645 mi (2,650 km) west-southwest of the southern tip of the Baja California peninsula. [32] [37]
- 00:00 UTC (6:00 p.m. MDT, August 25) at 25°54′N 112°12′W / 25.9°N 112.2°W – Tropical Storm Hilary makes its second landfall on the west coast of the Baja California peninsula about 180 mi (285 km) northwest of La Paz with winds of 60 mph (95 km/h) and a barometric pressure of 995 mbar (29.38 inHg). [34] [38]
- 12:00 UTC (6:00 a.m. MDT) at 27°54′N 112°06′W / 27.9°N 112.1°W – Tropical Storm Hilary weakens into a tropical depression over the Gulf of California about 110 mi (175 km) southwest of Hermosillo, Sonora. [34]
- 18:00 UTC (12:00 p.m. MDT) at 29°06′N 112°12′W / 29.1°N 112.2°W – Tropical Depression Hilary makes its third landfall about 85 mi (140 km) west of Hermosillo, Sonora with winds of 35 mph (55 km/h) and a barometric pressure of 1,008 mbar (29.77 inHg). [34] [38]
August 27
- 06:00 UTC (12:00 a.m. MDT) at 30°42′N 112°48′W / 30.7°N 112.8°W – Tropical Depression Hilary is last noted just inland to the east of the northern tip of the Gulf of California, dissipating shortly thereafter. [34] [38]
August 28
- 00:00 UTC (5:00 p.m. PDT, August 27) at 21°12′N 139°42′W / 21.2°N 139.7°W – Tropical Storm Greg weakens into a tropical depression about 1,905 mi (3,065 km) west of the southern tip of the Baja California peninsula. [32] [37]
- 06:00 UTC (8:00 p.m. HST, August 27) at 21°18′N 140°12′W / 21.3°N 140.2°W – Tropical Depression Greg crosses into the Central Pacific basin about 1,135 mi (1,825 km) east of Honolulu, Hawaii. [15] [32] [37]
- 18:00 UTC (8:00 a.m. HST) at 21°18′N 141°00′W / 21.3°N 141.0°W – Tropical Depression Greg is last noted about 1,080 mi (1,740 km) east of Honolulu, Hawaii; it dissipates six hours later. [15] [32] [37]
August 29

- 00:00 UTC (7:00 p.m. CDT, August 28) at 13°30′N 96°24′W / 13.5°N 96.4°W – Tropical Depression Eleven-E forms from a tropical wave about 345 mi (555 km) southeast of Acapulco, Guerrero. [39] [40]
- 18:00 UTC (1:00 p.m. CDT) at 14°18′N 99°54′W / 14.3°N 99.9°W – Tropical Depression Eleven-E strengthens into Tropical Storm Jova about 180 mi (285 km) south of Acapulco, Guerrero. [39] [40]
August 31
- 06:00 UTC (1:00 a.m. CDT) at 16°12′N 103°24′W / 16.2°N 103.4°W – Tropical Storm Jova strengthens into a Category 1 hurricane about 205 mi (335 km) south-southeast of Manzanillo, Colima. [39] [40]
September
September 1
- 00:00 UTC (7:00 p.m. CDT, August 31) at 17°12′N 105°12′W / 17.2°N 105.2°W – Hurricane Jova rapidly strengthens to Category 3 intensity, skipping Category 2 status, about 140 mi (220 km) south-southwest of Manzanillo, Colima; this makes it the seventh major hurricane of the season. [40]
- 06:00 UTC (1:00 a.m. CDT) at 17°30′N 105°54′W / 17.5°N 105.9°W – Hurricane Jova strengthens to Category 4 intensity about 145 mi (230 km) southwest of Manzanillo, Colima; it simultaneously reaches peak winds of 130 mph (215 km/h) and a minimum barometric pressure of 948 mbar (27.99 inHg). [39] [40]
- 18:00 UTC (12:00 p.m. MDT) at 18°12′N 107°24′W / 18.2°N 107.4°W – Hurricane Jova weakens to Category 3 intensity about 215 mi (345 km) west-southwest of Manzanillo, Colima. [40]
September 2

- 06:00 UTC (12:00 a.m. MDT) at 19°06′N 109°00′W / 19.1°N 109.0°W – Hurricane Jova weakens to Category 2 intensity about 270 mi (435 km) south-southeast of the southern tip of the Baja California peninsula. [40]
- 12:00 UTC (6:00 a.m. MDT) at 19°30′N 109°54′W / 19.5°N 109.9°W – Hurricane Jova weakens to Category 1 intensity about 235 mi (380 km) south of the southern tip of the Baja California peninsula. [40]
September 3
- 00:00 UTC (6:00 p.m. MDT, September 2) at 20°24′N 111°54′W / 20.4°N 111.9°W – Hurricane Jova regains Category 2 intensity about 215 mi (345 km) southwest of the southern tip of the Baja California peninsula. [40]
- 06:00 UTC (12:00 a.m. MDT) at 20°48′N 113°00′W / 20.8°N 113.0°W – Hurricane Jova reaches its secondary peak intensity with winds of 105 mph (165 km/h) and a barometric pressure of 970 mbar (28.64 inHg) about 240 mi (390 km) southwest of the southern tip of the Baja California peninsula. [40]
- 18:00 UTC (11:00 a.m. PDT) at 21°30′N 115°30′W / 21.5°N 115.5°W – Hurricane Jova weakens back to Category 1 intensity about 370 mi (595 km) west-southwest of the southern tip of the Baja California peninsula. [40]
September 4
- 06:00 UTC (11:00 p.m. PDT, September 3) at 21°48′N 118°06′W / 21.8°N 118.1°W – Hurricane Jova weakens into a tropical storm about 525 mi (845 km) west of the southern tip of the Baja California peninsula. [40]
- 12:00 UTC (5:00 a.m. PDT) at 21°42′N 119°00′W / 21.7°N 119.0°W – Tropical Storm Jova weakens into a tropical depression about 580 mi (935 km) west of the southern tip of the Baja California peninsula. [40]
September 5
- 12:00 UTC (6:00 a.m. MDT) at 12°12′N 107°12′W / 12.2°N 107.2°W – Tropical Depression Twelve-E forms from an area of disturbed weather about 740 mi (1,195 km) south-southeast of the southern tip of the Baja California peninsula. [41] [42]
September 6
- 00:00 UTC (5:00 p.m. PDT, September 5) at 21°24′N 122°36′W / 21.4°N 122.6°W – Tropical Depression Jova degenerates into a remnant low about 815 mi (1,315 km) west of the southern tip of the Baja California peninsula. [39] [40]

- 06:00 UTC (12:00 a.m. MDT) at 12°24′N 108°06′W / 12.4°N 108.1°W – Tropical Depression Twelve-E strengthens into Tropical Storm Kenneth about 720 mi (1,160 km) south of the southern tip of the Baja California peninsula. [41] [42]
September 8
- 06:00 UTC (12:00 a.m. MDT) at 14°42′N 112°00′W / 14.7°N 112.0°W – Tropical Storm Kenneth strengthens into a Category 1 hurricane about 580 mi (935 km) south-southwest of the southern tip of the Baja California peninsula. [41] [42]
- 12:00 UTC (7:00 a.m. CDT) at 10°36′N 94°48′W / 10.6°N 94.8°W – A tropical depression forms from a tropical wave about 385 mi (620 km) south of Salina Cruz, Oaxaca. [43] [44]
September 9
- 00:00 UTC (7:00 p.m. CDT, September 8) at 11°48′N 95°42′W / 11.8°N 95.7°W – The aforementioned tropical depression strengthens into Tropical Storm Lidia about 310 mi (500 km) south-southwest of Salina Cruz, Oaxaca. [43] [44]
September 10
- 06:00 UTC (11:00 p.m. PDT, September 9) at 15°18′N 117°24′W / 15.3°N 117.4°W – Hurricane Kenneth strengthens to Category 2 intensity about 715 mi (1,150 km) southwest of the southern tip of the Baja California peninsula. [42]
- 06:00 UTC (1:00 a.m. CDT) at 14°06′N 100°06′W / 14.1°N 100.1°W – Tropical Storm Lidia strengthens into a Category 1 hurricane about 310 mi (500 km) west-southwest of Salina Cruz, Oaxaca. [44]
- 12:00 UTC (5:00 a.m. PDT) at 15°42′N 117°54′W / 15.7°N 117.9°W – Hurricane Kenneth strengthens to Category 3 intensity about 715 mi (1,150 km) southwest of the southern tip of the Baja California peninsula, making it the eighth major hurricane of the season. [42]
- 18:00 UTC (11:00 a.m. PDT) at 16°06′N 118°24′W / 16.1°N 118.4°W – Hurricane Kenneth strengthens to Category 4 intensity about 720 mi (1,160 km) southwest of the southern tip of the Baja California peninsula. [42]
- 18:00 UTC (1:00 p.m. CDT) at 15°36′N 102°48′W / 15.6°N 102.8°W – Hurricane Lidia strengthens to Category 2 intensity about 505 mi (815 km) west of Salina Cruz, Oaxaca. [44]
September 11

- 00:00 UTC (7:00 p.m. CDT, September 10) at 16°12′N 104°12′W / 16.2°N 104.2°W – Hurricane Lidia rapidly strengthens to Category 4 intensity, skipping Category 3 status, off the southwestern coast of Mexico; this makes it the ninth major hurricane of the season. [44]
- 06:00 UTC (11:00 p.m. PDT, September 10) at 17°12′N 119°36′W / 17.2°N 119.6°W – Hurricane Kenneth reaches peak winds of 150 mph (240 km/h) and a minimum barometric pressure of 932 mbar (27.52 inHg) about 735 mi (1,185 km) southwest of the southern tip of the Baja California peninsula. [41] [42]
- 06:00 UTC (1:00 a.m. CDT) at 16°42′N 105°24′W / 16.7°N 105.4°W – Hurricane Lidia reaches peak winds of 150 mph (240 km/h) and a minimum barometric pressure of 930 mbar (27.46 inHg) off the southwestern coast of Mexico, making it the strongest storm of the season. [43] [44]
September 12
- 00:00 UTC (6:00 p.m. MDT, September 11) at 19°00′N 108°30′W / 19.0°N 108.5°W – Hurricane Lidia weakens to Category 3 intensity about 410 mi (660 km) south of Culiacán, Sinaloa. [44]
- 06:00 UTC (11:00 p.m. PDT, September 11) at 18°12′N 122°54′W / 18.2°N 122.9°W – Hurricane Kenneth weakens to Category 3 intensity about 900 mi (1,445 km) west-southwest of the southern tip of the Baja California peninsula. [42]
- 12:00 UTC (6:00 a.m. MDT) at 20°24′N 109°48′W / 20.4°N 109.8°W – Hurricane Lidia weakens to Category 2 intensity about 340 mi (545 km) south-southwest of Culiacán, Sinaloa. [44]
- 18:00 UTC (11:00 a.m. PDT) at 18°06′N 124°36′W / 18.1°N 124.6°W – Hurricane Kenneth weakens to Category 2 intensity about 1,000 mi (1,610 km) west-southwest of the southern tip of the Baja California peninsula. [42]
September 13
- 08:00 UTC (2:00 a.m. MDT) at 24°18′N 107°30′W / 24.3°N 107.5°W – Hurricane Lidia makes landfall about 40 mi (65 km) south-southwest of Culiacán, Sinaloa with winds of 100 mph (155 km/h) and a barometric pressure of 975 mbar (28.79 inHg). [44] [45]
- 12:00 UTC (6:00 a.m. MDT) at 25°54′N 106°18′W / 25.9°N 106.3°W – Hurricane Lidia rapidly weakens into a tropical storm inland about 105 mi (165 km) northeast of Culiacán, Sinaloa. [44] [45]

September 14
- 00:00 UTC (7:00 p.m. CDT, September 13) at 29°30′N 101°00′W / 29.5°N 101.0°W – Tropical Storm Lidia weakens into a tropical depression inland near the Texas–Mexico border. [44] [45]
- 06:00 UTC (11:00 p.m. PDT, September 13) at 19°12′N 130°48′W / 19.2°N 130.8°W – Hurricane Kenneth weakens to Category 1 intensity about 1,365 mi (2,195 km) west-southwest of the southern tip of the Baja California peninsula. [42]
- 06:00 UTC (1:00 a.m. CDT) at 30°30′N 98°30′W / 30.5°N 98.5°W – Tropical Depression Lidia is last noted inland about 45 mi (75 km) west-northwest of Austin, Texas; it dissipates six hours later. [44] [45]
September 15
- 00:00 UTC (5:00 p.m. PDT, September 14) at 20°42′N 133°30′W / 20.7°N 133.5°W – Hurricane Kenneth weakens into a tropical storm about 1,515 mi (2,435 km) west of the southern tip of the Baja California peninsula. [41] [42]
September 16
- 12:00 UTC (5:00 a.m. PDT) at 23°00′N 137°30′W / 23.0°N 137.5°W – Tropical Storm Kenneth weakens into a tropical depression about 1,750 mi (2,815 km) west of the southern tip of the Baja California peninsula. [41] [42]
September 17

- 18:00 UTC (11:00 a.m. PDT) at 24°48′N 138°54′W / 24.8°N 138.9°W – Tropical Depression Kenneth is last noted about 1,830 mi (2,945 km) west of the southern tip of the Baja California peninsula; it dissipates six hours later. [41] [42]
September 21
- 18:00 UTC (1:00 p.m. CDT) at 20°48′N 104°42′W / 20.8°N 104.7°W – Tropical Depression Gert of the 1993 Atlantic hurricane season is located just inland from the Pacific coast of Mexico; it emerges over the Pacific Ocean within the next six hours, at which point it is redesignated as Tropical Depression Fourteen-E. [46]
September 22
- 00:00 UTC (6:00 p.m. MDT, September 21) at 20°54′N 106°30′W / 20.9°N 106.5°W – Tropical Depression Fourteen-E reaches peak winds of 35 mph (55 km/h). [46]
September 23
- 00:00 UTC (6:00 p.m. MDT, September 22) at 22°12′N 110°36′W / 22.2°N 110.6°W – Tropical Depression Fourteen-E reaches a minimum barometric pressure of 1,002 mbar (29.59 inHg). [46]
September 26
- 00:00 UTC (5:00 p.m. PDT, September 25) at 20°48′N 116°00′W / 20.8°N 116.0°W – Tropical Depression Fourteen-E is last noted; it dissipates shortly thereafter. [46]

September 30
- 00:00 UTC (6:00 p.m. MDT, September 29) at 10°30′N 114°36′W / 10.5°N 114.6°W – A tropical depression forms from a tropical wave. [47] [48]
- 12:00 UTC (6:00 a.m. MDT) at 11°12′N 114°54′W / 11.2°N 114.9°W – The tropical depression strengthens into Tropical Storm Max; it simultaneously attains its initial peak intensity with winds of 40 mph (65 km/h) and a barometric pressure of 1,004 mbar (29.65 inHg). [47] [48]
October
October 1
- 00:00 UTC (5:00 p.m. PDT, September 30) at 11°24′N 115°24′W / 11.4°N 115.4°W – Tropical Storm Max weakens into a tropical depression. [47] [48]
- 18:00 UTC (11:00 a.m. PDT) at 11°18′N 116°24′W / 11.3°N 116.4°W – Tropical Depression Max restrengthens into a tropical storm. [48]
October 2
- 00:00 UTC (5:00 p.m. PDT, October 1) at 11°00′N 116°42′W / 11.0°N 116.7°W – Tropical Storm Max reaches peak winds of 45 mph (75 km/h) and a minimum barometric pressure of 1,000 mbar (29.53 inHg). [47] [48]
- 18:00 UTC (12:00 p.m. MDT) at 13°24′N 111°12′W / 13.4°N 111.2°W – Tropical Depression Sixteen-E forms from a large area of disturbed weather about 690 mi (1,110 km) south of the southern tip of the Baja California peninsula. [49] [50]

October 3
- 12:00 UTC (5:00 a.m. PDT) at 11°42′N 117°00′W / 11.7°N 117.0°W – Tropical Storm Max weakens back into a tropical depression. [48]
- 12:00 UTC (6:00 a.m. MDT) at 15°42′N 113°12′W / 15.7°N 113.2°W – Tropical Depression Sixteen-E strengthens into Tropical Storm Norma about 540 mi (870 km) south-southwest of the southern tip of the Baja California peninsula. [49] [50]
October 4
- 00:00 UTC (5:00 p.m. PDT, October 3) at 13°54′N 116°42′W / 13.9°N 116.7°W – Tropical Depression Max is absorbed by Tropical Storm Norma. [47] [48]
- 00:00 UTC (6:00 p.m. MDT, October 3) at 17°30′N 114°24′W / 17.5°N 114.4°W – Tropical Storm Norma reaches peak winds of 50 mph (85 km/h) and a minimum barometric pressure of 1,000 mbar (29.53 inHg) about 470 mi (760 km) southwest of the southern tip of the Baja California peninsula. [49] [50]
October 5
- 00:00 UTC (5:00 p.m. PDT, October 4) at 18°12′N 117°06′W / 18.2°N 117.1°W – Tropical Storm Norma weakens into a tropical depression about 565 mi (910 km) southwest of the southern tip of the Baja California peninsula. [49] [50]
October 6
- 18:00 UTC (11:00 a.m. PDT) at 21°36′N 118°42′W / 21.6°N 118.7°W – Tropical Depression Norma is last noted about 565 mi (910 km) west of the southern tip of the Baja California peninsula; it dissipates shortly thereafter. [50]
October 11
- 18:00 UTC (11:00 a.m. PDT) at 15°36′N 120°48′W / 15.6°N 120.8°W – Tropical Depression Seventeen-E forms. [51]
October 12

- 00:00 UTC (5:00 p.m. PDT, October 11) at 16°30′N 121°42′W / 16.5°N 121.7°W – Tropical Depression Seventeen-E reaches peak winds of 35 mph (55 km/h) and a minimum barometric pressure of 1,009 mbar (29.80 inHg). [51]
October 14
- 00:00 UTC (5:00 p.m. PDT, October 13) at 22°06′N 126°48′W / 22.1°N 126.8°W – Tropical Depression Seventeen-E is last noted; it dissipates shortly thereafter. [51]
November
- No tropical cyclones formed in November.
November 30
- The 1993 Pacific hurricane season officially ends. [1]
Notes
- ^ Broadly speaking, Accumulated Cyclone Energy is the square of a tropical cyclone's wind intensity in knots at 6-hour intervals, multiplied by the length of time it existed. [5]
- ^ Sources conflict on the exact number of deaths from Calvin. While the National Hurricane Center stated in their Preliminary Report for Calvin that 34 fatalities had occurred, [7] articles from Gulf News and the Los Angeles Times have given a death toll of 37. [8] [9]
- ^ Sources conflict on the exact number of deaths from Lidia. A September 1993 article by the Oxnard Press-Courier stated that Lidia had killed 7 people, [11] while the National Hurricane Center's report on the season gave a death toll of 2. [3]
- ^ The National Hurricane Center and the Central Pacific Hurricane Center disagree on when Eugene entered the Central Pacific basin. In their overall report on the tropical cyclones which entered their area of responsibility (AOR) in 1993, the Central Pacific Hurricane Center states that Eugene did so at 18:00 UTC on July 22; [15] at this time, the National Hurricane Center lists Eugene's longitude as 139.8°W, just east of the Central Pacific basin limits. [28] As both agencies agree that Eugene was in the Central Pacific basin at 00:00 UTC on July 23, and because the National Hurricane Center's Preliminary Report on Eugene contains the storm's full track, the National Hurricane Center is given precedence.
- ^ The National Hurricane Center and the Central Pacific Hurricane Center disagree on when Fernanda entered the Central Pacific basin. In their overall report on the tropical cyclones which entered their AOR in 1993, the Central Pacific Hurricane Center states that Fernanda did so at 06:00 UTC on August 14; [15] at this time, the National Hurricane Center lists Fernanda's longitude as 139.6°W, just east of the Central Pacific basin limits. [30] As both agencies agree that Fernanda was in the Central Pacific basin at 12:00 UTC on August 14, and because the National Hurricane Center's Preliminary Report on Fernanda contains the storm's full track, the National Hurricane Center is given precedence.
See also
References
- ^ a b c d e "Tropical Cyclone Climatology". Miami, Florida: National Hurricane Center. Archived from the original on February 23, 2024. Retrieved February 17, 2024.
-
^
National Hurricane Center;
Hurricane Research Division;
Central Pacific Hurricane Center (April 4, 2023).
"The Northeast and North Central Pacific hurricane database 1949–2022". United States National Oceanic and Atmospheric Administration's National Weather Service. A guide on how to read the database is available
here.
 This article incorporates text from this source, which is in the
public domain.
This article incorporates text from this source, which is in the
public domain.
- ^ a b c d Avila, Lixion A.; Mayfield, Britt M. (March 1, 1995). "Eastern North Pacific Hurricane Season of 1993". Monthly Weather Review. 123 (3). American Meteorological Society: 1393–1410. Bibcode: 1995MWRv..123..897A. doi: 10.1175/1520-0493(1995)123<0897:ENPHSO>2.0.CO;2.
- ^ Jan Tenbruggencate (August 22, 1993). "Weird weather in the Pacific due to El Nino". The Honolulu Advertiser. Honolulu, Hawaii. p. 6. Archived from the original on February 23, 2024. Retrieved February 20, 2024 – via Newspapers.com.
- ^ "Background information: Eastern Pacific Hurricane Season". United States Climate Prediction Center. May 22, 2019. Archived from the original on July 24, 2020. Retrieved February 20, 2024.
- ^ "Basin Archives: Northeast Pacific Ocean Historical Tropical Cyclone Statistics". Fort Collins, Colorado: Colorado State University. Archived from the original on December 17, 2023. Retrieved February 20, 2024.
- ^ Rappaport, Edward (August 2, 1993). Hurricane Calvin Preliminary Report (Page Three) (GIF) (Report). National Hurricane Center. Archived from the original on February 15, 2024. Retrieved February 15, 2024.
- ^ Kareem, Abdul (July 6, 2018). "July 7, 1993: Hurricane Calvin kills 37 in Mexico". Gulf News. Dubai, United Arab Emirates. Archived from the original on February 15, 2024. Retrieved February 15, 2024.
- ^ Darling, Juanita (July 9, 1993). "Death Toll 37 in Mexico as Storm Heads Out to Sea : Disaster: About a third of nation is under state of emergency. Officials report 42,000 homeless". Los Angeles Times. Los Angeles, California. Archived from the original on February 15, 2024. Retrieved February 15, 2024.
- ^ Rappaport, Edward (August 2, 1993). Hurricane Calvin Preliminary Report (Page Four) (GIF) (Report). National Hurricane Center. Archived from the original on February 20, 2024. Retrieved February 20, 2024.
- ^ "Storm kills 7, forces evacuations". Oxnard Press-Courier. Associated Press. September 18, 1993. Retrieved February 20, 2024.
- ^ "Texas reeling from series of tornadoes". The Tuscaloosa News. Associated Press. September 14, 1993. Retrieved February 20, 2024.
- ^ a b c Pasch, Richard J. (November 18, 1993). Tropical Depression Three-E Preliminary Report (Page One) (GIF) (Report). National Hurricane Center. Archived from the original on January 2, 2022. Retrieved January 31, 2024.
- ^ a b c d Rappaport, Edward (September 27, 1993). Hurricane Hilary Preliminary Report (Page Three) (GIF) (Report). National Hurricane Center. Archived from the original on February 3, 2024. Retrieved February 3, 2024.
- ^ a b c d e f g h i j k l m n o p q r s t u v w x Tropical Cyclones 1993 (PDF) (Report). Central Pacific Hurricane Center. Archived (PDF) from the original on February 7, 2024. Retrieved February 1, 2024.
- ^ "Understanding the Date/Time Stamps". Silver Spring, Maryland: National Weather Service. Archived from the original on February 26, 2023. Retrieved February 23, 2024.
- ^ a b c d Lawrence, Miles (July 10, 1993). Hurricane Adrian Preliminary Report (Page One) (GIF) (Report). National Hurricane Center. Archived from the original on July 15, 2023. Retrieved February 6, 2024.
- ^ a b c d e f g Lawrence, Miles (July 10, 1993). Hurricane Adrian Preliminary Report (Page Three) (GIF) (Report). National Hurricane Center. Archived from the original on July 15, 2023. Retrieved January 31, 2024.
- ^ a b c Mayfield, Max (July 31, 1993). Tropical Storm Beatriz Preliminary Report (Page One) (GIF) (Report). National Hurricane Center. Archived from the original on February 6, 2024. Retrieved February 6, 2024.
- ^ a b c d Mayfield, Max (July 31, 1993). Tropical Storm Beatriz Preliminary Report (Page Three) (GIF) (Report). National Hurricane Center. Archived from the original on January 31, 2024. Retrieved January 31, 2024.
- ^ a b c d Pasch, Richard J. (November 18, 1993). Tropical Depression Three-E Preliminary Report (Page Two) (GIF) (Report). National Hurricane Center. Archived from the original on January 31, 2024. Retrieved January 31, 2024.
- ^ a b c Rappaport, Edward (August 2, 1993). Hurricane Calvin Preliminary Report (Page One) (GIF) (Report). National Hurricane Center. Archived from the original on February 6, 2024. Retrieved February 6, 2024.
- ^ a b c d e f g h i Rappaport, Edward (August 2, 1993). Hurricane Calvin Preliminary Report (Page Five) (GIF) (Report). National Hurricane Center. Archived from the original on January 31, 2024. Retrieved January 31, 2024.
- ^ a b Rappaport, Edward (August 2, 1993). Hurricane Calvin Preliminary Report (Page Two) (GIF) (Report). National Hurricane Center. Archived from the original on February 6, 2024. Retrieved February 6, 2024.
- ^ a b c d e f Avila, Lixion (1993). Hurricane Dora Preliminary Report (Page One) (GIF) (Report). National Hurricane Center. Archived from the original on February 6, 2024. Retrieved February 6, 2024.
- ^ a b c d e f g h i j k l m n Avila, Lixion (1993). Hurricane Dora Preliminary Report (Page Three) (GIF) (Report). National Hurricane Center. Archived from the original on March 4, 2016. Retrieved January 31, 2024.
- ^ a b c d e f g Lawrence, Miles (October 7, 1993). Hurricane Eugene Preliminary Report (Page One) (GIF) (Report). National Hurricane Center. Archived from the original on February 6, 2024. Retrieved February 6, 2024.
- ^ a b c d e f g h i j k l m n o Lawrence, Miles (October 7, 1993). Hurricane Eugene Preliminary Report (Page Three) (GIF) (Report). National Hurricane Center. Archived from the original on February 1, 2024. Retrieved February 1, 2024.
- ^ a b c d e Mayfield, Max (October 19, 1993). Hurricane Fernanda Preliminary Report (Page One) (GIF) (Report). National Hurricane Center. Archived from the original on March 13, 2016. Retrieved February 6, 2024.
- ^ a b c d e f g h i j k l m n o Mayfield, Max (October 19, 1993). Hurricane Fernanda Preliminary Report (Page Three) (GIF) (Report). National Hurricane Center. Archived from the original on March 4, 2016. Retrieved February 2, 2024.
- ^ a b c d e f Pasch, Richard J. (November 28, 1993). Hurricane Greg Preliminary Report (Page One) (GIF) (Report). National Hurricane Center. Archived from the original on March 4, 2016. Retrieved February 6, 2024.
- ^ a b c d e f g h i j k l m n o p Pasch, Richard J. (November 28, 1993). Hurricane Greg Preliminary Report (Page Three) (GIF) (Report). National Hurricane Center. Archived from the original on February 2, 2024. Retrieved February 2, 2024.
- ^ a b c d Rappaport, Edward (September 27, 1993). Hurricane Hilary Preliminary Report (Page Three) (GIF) (Report). National Hurricane Center. Archived from the original on November 3, 2023. Retrieved February 6, 2024.
- ^ a b c d e f g h i j k l Rappaport, Edward (September 27, 1993). Hurricane Hilary Preliminary Report (Page Four) (GIF) (Report). National Hurricane Center. Archived from the original on August 25, 2008. Retrieved February 3, 2024.
- ^ a b c d Avila, Lixion A. (October 19, 1993). Tropical Storm Irwin Preliminary Report (Page One) (GIF) (Report). National Hurricane Center. Archived from the original on February 6, 2024. Retrieved February 6, 2024.
- ^ a b c d Avila, Lixion A. (October 19, 1993). Tropical Storm Irwin Preliminary Report (Page Two) (GIF) (Report). National Hurricane Center. Archived from the original on February 3, 2024. Retrieved February 3, 2024.
- ^ a b c d e f Pasch, Richard J. (November 28, 1993). Hurricane Greg Preliminary Report (Page Two) (GIF) (Report). National Hurricane Center. Archived from the original on February 6, 2024. Retrieved February 6, 2024.
- ^ a b c d e Rappaport, Edward (September 27, 1993). Hurricane Hilary Preliminary Report (Page Two) (GIF) (Report). National Hurricane Center. Archived from the original on February 6, 2024. Retrieved February 6, 2024.
- ^ a b c d e Lawrence, Miles (October 21, 1993). Hurricane Jova Preliminary Report (Page One) (GIF) (Report). National Hurricane Center. Archived from the original on February 6, 2024. Retrieved February 6, 2024.
- ^ a b c d e f g h i j k l m n Lawrence, Miles (October 21, 1993). Hurricane Jova Preliminary Report (Page Three) (GIF) (Report). National Hurricane Center. Archived from the original on September 7, 2023. Retrieved February 3, 2024.
- ^ a b c d e f g Mayfield, Max (October 19, 1993). Hurricane Kenneth Preliminary Report (Page One) (GIF) (Report). National Hurricane Center. Archived from the original on February 6, 2024. Retrieved February 6, 2024.
- ^ a b c d e f g h i j k l m Mayfield, Max (October 19, 1993). Hurricane Kenneth Preliminary Report (Page Three) (GIF) (Report). National Hurricane Center. Archived from the original on September 7, 2023. Retrieved February 3, 2024.
- ^ a b c Pasch, Richard J. (November 28, 1993). Hurricane Lidia Preliminary Report (Page One) (GIF) (Report). National Hurricane Center. Archived from the original on February 6, 2024. Retrieved February 6, 2024.
- ^ a b c d e f g h i j k l Pasch, Richard J. (November 28, 1993). Hurricane Lidia Preliminary Report (Page Four) (GIF) (Report). National Hurricane Center. Archived from the original on September 7, 2023. Retrieved February 4, 2024.
- ^ a b c d Pasch, Richard J. (November 28, 1993). Hurricane Lidia Preliminary Report (Page Two) (GIF) (Report). National Hurricane Center. Archived from the original on February 6, 2024. Retrieved February 6, 2024.
- ^ a b c d Rappaport, Edward (September 29, 1993). Tropical Depression Fourteen-E Preliminary Report (Page One) (GIF) (Report). National Hurricane Center. Archived from the original on October 7, 2023. Retrieved February 4, 2024.
- ^ a b c d e Avila, Lixion A. (October 29, 1993). Tropical Storm Max Preliminary Report (Page One) (GIF) (Report). National Hurricane Center. Archived from the original on February 6, 2024. Retrieved February 6, 2024.
- ^ a b c d e f g Avila, Lixion A. (October 29, 1993). Tropical Storm Max Preliminary Report (Page Two) (GIF) (Report). National Hurricane Center. Archived from the original on February 4, 2024. Retrieved February 4, 2024.
- ^ a b c d Lawrence, Miles (October 21, 1993). Tropical Storm Norma Preliminary Report (Page One) (GIF) (Report). National Hurricane Center. Archived from the original on February 6, 2024. Retrieved February 6, 2024.
- ^ a b c d e Lawrence, Miles (October 21, 1993). Tropical Storm Norma Preliminary Report (Page Two) (GIF) (Report). National Hurricane Center. Archived from the original on February 4, 2024. Retrieved February 4, 2024.
- ^ a b c Mayfield, Max (October 16, 1993). Tropical Depression Seventeen-E Preliminary Report (GIF) (Report). National Hurricane Center. Archived from the original on January 4, 2022. Retrieved February 4, 2024.
External links
- The National Hurricane Center's storm wallet for 1993
Tropical cyclones of the
1993 Pacific hurricane season | ||
|---|---|---|
| ||
| Timeline of the 1993 Pacific hurricane season | |||||
|---|---|---|---|---|---|
|
Season summary map | |||||
| Season boundaries | |||||
| First system formed | June 11, 1993 | ||||
| Last system dissipated | October 14, 1993 | ||||
| Strongest system | |||||
| Name | Lidia | ||||
| Maximum winds | 240 km/h (150 mph) (1-minute sustained) | ||||
| Lowest pressure | 930 hPa ( mbar) | ||||
| Longest lasting system | |||||
| Name | Greg | ||||
| Duration | 14.00 days | ||||
| |||||
The 1993 Pacific hurricane season was an event in the annual formation of tropical cyclones over the Pacific Ocean north of the Equator and east of the International Date Line. The season officially began on May 15 in the Eastern Pacific proper (east of 140°W) and June 1 in the Central Pacific (140°W to the International Date Line), and ended on November 30. These dates conventionally delineate the period each year during which tropical cyclones tend to form in the basin according to the National Hurricane Center. [1] A total of eighteen tropical depressions formed; fifteen of these developed into named tropical storms, of which eleven became hurricanes and nine became major hurricanes (Category 3 or higher on the Saffir–Simpson scale). [2] The number of tropical storms was near the long-term average; the number of hurricanes was slightly above average, and the number of major hurricanes was more than double the average of four. [1] [3] As with many active Pacific hurricane seasons, El Niño conditions greatly influenced this season's high activity levels. [4] Several long-lived and powerful hurricanes contributed to an overall Accumulated Cyclone Energy value of 201.8 units, the eighth-highest on record for a Pacific hurricane season as of February 2024. [nb 1] [6] The first system, Hurricane Adrian, developed on June 11; the final system, Tropical Depression Seventeen-E, dissipated on October 14.
The most impactful storm of the season was Hurricane Calvin, which made landfall near Manzanillo in the Mexican state of Colima as a Category 2 hurricane; it killed more than 30 people, [nb 2] mainly due to significant flooding, and damages amounted to $32 million (1993 USD). [10] Two months later, Hurricane Lidia came ashore at a similar intensity farther to the northwest along the coast of Sinaloa, where it caused considerable damage and multiple fatalities. [nb 3] [3] In conjunction with a cold front, Lidia's remnants generated severe weather in Texas, including a tornado that caused $8 million (1993 USD) in damage. [12] Earlier in the season, Tropical Storm Beatriz killed 6 people in Mexico when it struck the southern portion of the country, [3] while Tropical Depression Three-E produced heavy rainfall that amounted to nearly a foot (12 in; 30.48 cm) in Acapulco despite remaining offshore. [13] Hurricane Hilary made three landfalls in Mexico – twice on the Baja California peninsula as a tropical storm, and then on the Mexican mainland as a tropical depression – but caused no loss of life and little damage. [14] Hurricanes Dora, Eugene, and Fernanda produced minor impacts in Hawaii; Eugene made landfall on the Big Island as a tropical depression, while Fernanda prompted the issuance of a hurricane warning, though this was discontinued when the storm turned away. [15]
Four time zones are utilized in the Eastern Pacific basin. They are, from east to west: Central east of 106°W; Mountain from 106°W to 114.9°W; Pacific from 115°W to 139.9°W; and Hawaii−Aleutian from 140°W to the International Date Line. For convenience, each event is listed in Coordinated Universal Time (UTC) first, using the 24-hour clock (where 00:00 = midnight UTC), [16] with the respective local time included in parentheses. Figures for maximum sustained winds and position estimates are rounded to the nearest five units ( knots, miles, or kilometers) and averaged over one minute, following National Hurricane Center practice. Direct wind observations are rounded to the nearest whole number. Atmospheric pressures are listed to the nearest millibar and nearest hundredth of an inch of mercury. This timeline documents the formation of tropical cyclones as well as the strengthening, weakening, landfalls, extratropical transitions, and dissipations during the season. It includes information that was not released while the storm was active, meaning that data from post-storm reviews by the National Hurricane Center and the Central Pacific Hurricane Center is included.
Timeline of events
May
May 15
- The 1993 Eastern Pacific hurricane season officially begins. [1]
- No tropical cyclones formed in May.
June
June 1
- The 1993 Central Pacific hurricane season officially begins. [1]
June 11
- 06:00 UTC (12:00 a.m. MDT) at 9°42′N 114°36′W / 9.7°N 114.6°W – The first tropical depression of the season forms an area of disturbed weather about 960 mi (1,545 km) south-southwest of the southern tip of the Baja California peninsula. [17] [18]
June 12
- 06:00 UTC (11:00 p.m. PDT, June 11) at 9°54′N 115°18′W / 9.9°N 115.3°W – The tropical depression strengthens into Tropical Storm Adrian about 960 mi (1,545 km) south-southwest of the southern tip of the Baja California peninsula. [17] [18]
June 15
- 12:00 UTC (5:00 a.m. PDT) at 11°48′N 119°00′W / 11.8°N 119.0°W – Tropical Storm Adrian strengthens into a Category 1 hurricane about 965 mi (1,555 km) southwest of the southern tip of the Baja California peninsula. [17] [18]
June 16
- 00:00 UTC (5:00 p.m. PDT, June 15) at 13°00′N 119°36′W / 13.0°N 119.6°W – Hurricane Adrian reaches peak winds of 85 mph (140 km/h) and a minimum barometric pressure of 979 mbar (28.91 inHg) about 930 mi (1,500 km) southwest of the southern tip of the Baja California peninsula. [17] [18]
June 17
- 00:00 UTC (5:00 p.m. PDT, June 16) at 14°42′N 119°36′W / 14.7°N 119.6°W – Hurricane Adrian weakens into a tropical storm about 845 mi (1,360 km) southwest of the southern tip of the Baja California peninsula. [18]
- 18:00 UTC (11:00 a.m. PDT) at 14°24′N 119°00′W / 14.4°N 119.0°W – Tropical Storm Adrian weakens into a tropical depression about 835 mi (1,345 km) southwest of the southern tip of the Baja California peninsula. [18]
June 18
- 06:00 UTC (1:00 a.m. CDT) at 13°24′N 95°24′W / 13.4°N 95.4°W – A tropical depression forms from an area of low pressure about 175 mi (280 km) south-southeast of Huatulco, Mexico. [19] [20]
- 12:00 UTC (7:00 a.m. CDT) at 13°36′N 95°48′W / 13.6°N 95.8°W – The tropical depression strengthens into Tropical Storm Beatriz about 150 mi (240 km) south-southeast of Huatulco, Mexico. [19] [20]
June 19
- 12:00 UTC (5:00 a.m. PDT) at 13°30′N 118°18′W / 13.5°N 118.3°W – Tropical Depression Adrian is last noted about 845 mi (1,360 km) southwest of the southern tip of the Baja California peninsula; it dissipates six hours later. [18]
- 18:00 UTC (1:00 p.m. CDT) at 15°54′N 97°48′W / 15.9°N 97.8°W – Tropical Storm Beatriz reaches peak winds of 65 mph (100 km/h) and a minimum barometric pressure of 995 millibars (29.38 inHg). It simultaneously makes landfall near Laguna de la Pastoría in the Mexican state of Oaxaca. [19] [20]
June 20
- 00:00 UTC (7:00 p.m. CDT, June 19) at 17°00′N 98°00′W / 17.0°N 98.0°W – Tropical Storm Beatriz weakens into a tropical depression inland over southwestern Mexico; it dissipates six hours later. [20]
June 27
- 00:00 UTC (7:00 p.m. CDT, June 26) at 13°54′N 95°18′W / 13.9°N 95.3°W – Tropical Depression Three-E forms from a large area of disturbed weather about 115 mi (185 km) south of the Gulf of Tehuantepec. [13] [21]
- 12:00 UTC (7:00 a.m. CDT) at 14°36′N 96°06′W / 14.6°N 96.1°W – Tropical Depression Three-E reaches peak winds of 35 mph (55 km/h) about 110 mi (175 km) southeast of Puerto Escondido, Oaxaca. [21]
June 30
- 18:00 UTC (12:00 p.m. MDT) at 20°18′N 108°24′W / 20.3°N 108.4°W – Tropical Depression Three-E reaches a minimum barometric pressure of 1,006 mbar (29.71 inHg) about 295 mi (475 km) south-southeast of La Paz, Baja California Sur. [21]
July
July 2
- 00:00 UTC (6:00 p.m. MDT, July 1) at 24°30′N 110°12′W / 24.5°N 110.2°W – Tropical Depression Three-E is last noted just north of La Paz, Baja California Sur; it dissipates shortly thereafter. [13] [21]
July 4
- 12:00 UTC (7:00 a.m. CDT) at 12°54′N 97°42′W / 12.9°N 97.7°W – A tropical depression forms from an area of disturbed weather about 315 mi (510 km) southeast of Acapulco, Guerrero. [22] [23]
July 5
- 00:00 UTC (7:00 p.m. CDT, July 4) at 12°42′N 98°54′W / 12.7°N 98.9°W – The tropical depression strengthens into Tropical Storm Calvin about 295 mi (475 km) south-southeast of Acapulco, Guerrero. [22] [23]
July 6
- 00:00 UTC (7:00 p.m. CDT, July 5) at 13°36′N 100°06′W / 13.6°N 100.1°W – Tropical Storm Calvin strengthens into a Category 1 hurricane about 225 mi (360 km) south of Acapulco, Guerrero. [22] [23]
- 12:00 UTC (7:00 a.m. CDT) at 15°24′N 100°24′W / 15.4°N 100.4°W – Hurricane Calvin strengthens to Category 2 intensity about 110 mi (175 km) south-southwest of Acapulco, Guerrero. [23]
July 7
- 12:00 UTC (7:00 a.m. CDT) at 18°12′N 104°06′W / 18.2°N 104.1°W – Hurricane Calvin reaches peak winds of 110 mph (175 km/h) and a minimum barometric pressure of 966 mbar (28.53 inHg) about 85 mi (140 km) south-southeast of Manzanillo, Colima. [23] [24]
- 18:00 UTC (1:00 p.m. CDT) at 19°24′N 105°00′W / 19.4°N 105.0°W – Hurricane Calvin makes its first landfall about 45 mi (75 km) west-northwest of Manzanillo, Colima with winds of 100 mph (155 km/h) and a minimum barometric pressure of 973 mbar (28.73 inHg). [23] [24]
July 8
- 00:00 UTC (7:00 p.m. CDT, July 7) at 20°30′N 105°36′W / 20.5°N 105.6°W – Hurricane Calvin rapidly weakens into a tropical storm as it re-emerges over the Pacific Ocean about 130 mi (215 km) northwest of Manzanillo, Colima. [23]
- 17:00 UTC (11:00 a.m. MDT) at 23°48′N 109°54′W / 23.8°N 109.9°W – Tropical Storm Calvin weakens into a tropical depression as it makes its second landfall just south of La Paz, Baja California Sur with winds of 35 mph (55 km/h) and a barometric pressure of 1,005 mbar (29.68 inHg). [23]
July 9
- 00:00 UTC (6:00 p.m. MDT, July 8) at 23°30′N 111°00′W / 23.5°N 111.0°W – Tropical Depression Calvin is last noted about 65 mi (100 km) southwest of La Paz, Baja California Sur; it dissipates six hours later. [23]
July 14
- 12:00 UTC (5:00 a.m. PDT) at 11°00′N 118°54′W / 11.0°N 118.9°W – A tropical depression forms from a tropical wave over the open Eastern Pacific Ocean. [25] [26]
- 18:00 UTC (11:00 a.m. PDT) at 11°36′N 120°00′W / 11.6°N 120.0°W – The tropical depression strengthens into Tropical Storm Dora. [25] [26]
July 15
- 18:00 UTC (11:00 a.m. PDT) at 12°48′N 124°36′W / 12.8°N 124.6°W – Tropical Storm Dora strengthens into a Category 1 hurricane. [25] [26]
- 18:00 UTC (10:00 a.m. MDT) at 11°18′N 112°48′W / 11.3°N 112.8°W – Another tropical depression forms from a tropical wave about 805 mi (1,295 km) south-southwest of the southern tip of the Baja California peninsula. [27] [28]
July 16
- 00:00 UTC (5:00 p.m. PDT, July 15) at 12°54′N 125°30′W / 12.9°N 125.5°W – Hurricane Dora strengthens to Category 2 intensity. [26]
- 06:00 UTC (11:00 p.m. PDT, July 15) at 13°06′N 126°30′W / 13.1°N 126.5°W – Hurricane Dora strengthens to Category 3 intensity, making it the first major hurricane of the season. [26]
- 12:00 UTC (5:00 a.m. PDT) at 11°24′N 115°12′W / 11.4°N 115.2°W – The aforementioned tropical depression strengthens into Tropical Storm Eugene about 865 mi (1,390 km) south-southwest of the southern tip of the Baja California peninsula. [27] [28]
- 18:00 UTC (11:00 a.m. PDT) at 13°48′N 128°00′W / 13.8°N 128.0°W – Hurricane Dora strengthens to Category 4 intensity; it simultaneously reaches peak winds of 130 mph (215 km/h). [25] [26]
July 17
- 06:00 UTC (11:00 p.m. PDT, July 16) at 14°54′N 129°36′W / 14.9°N 129.6°W – Hurricane Dora reaches a minimum barometric pressure of 945 mbar (27.91 inHg). [25] [26]
- 06:00 UTC (11:00 p.m. PDT, July 16) at 11°18′N 117°12′W / 11.3°N 117.2°W – Tropical Storm Eugene strengthens into a Category 1 hurricane about 930 mi (1,500 km) south-southwest of the southern tip of the Baja California peninsula. [27] [28]
- 18:00 UTC (11:00 a.m. PDT) at 15°54′N 131°00′W / 15.9°N 131.0°W – Hurricane Dora weakens to Category 3 intensity. [26]
- 18:00 UTC (11:00 a.m. PDT) at 11°06′N 118°06′W / 11.1°N 118.1°W – Hurricane Eugene strengthens to Category 2 intensity about 975 mi (1,565 km) southwest of the southern tip of the Baja California peninsula. [28]
July 18
- 00:00 UTC (5:00 p.m. PDT, July 17) at 16°24′N 132°00′W / 16.4°N 132.0°W – Hurricane Dora weakens to Category 2 intensity. [26]
- 00:00 UTC (5:00 p.m. PDT, July 17) at 11°12′N 118°30′W / 11.2°N 118.5°W – Hurricane Eugene strengthens to Category 3 intensity about 985 mi (1,585 km) southwest of the southern tip of the Baja California peninsula, making it the second major hurricane of the season. [28]
- 06:00 UTC (11:00 p.m. PDT, July 17) at 16°54′N 132°54′W / 16.9°N 132.9°W – Hurricane Dora weakens to Category 1 intensity. [26]
- 18:00 UTC (11:00 a.m. PDT) at 17°24′N 134°36′W / 17.4°N 134.6°W – Hurricane Dora weakens into a tropical storm. [26]
July 19
- 12:00 UTC (5:00 a.m. PDT) at 17°30′N 138°06′W / 17.5°N 138.1°W – Tropical Storm Dora weakens into a tropical depression. [26]
- 12:00 UTC (5:00 a.m. PDT) at 14°54′N 122°18′W / 14.9°N 122.3°W – Hurricane Eugene reaches peak winds of 125 mph (205 km/h) about 980 mi (1,575 km) southwest of the southern tip of the Baja California peninsula. [27] [28]
- 18:00 UTC (11:00 a.m. PDT) at 15°24′N 123°36′W / 15.4°N 123.6°W – Hurricane Eugene reaches a minimum barometric pressure of 948 mbar (27.99 inHg) about 1,030 mi (1,660 km) west-southwest of the southern tip of the Baja California peninsula. [27] [28]
July 20
- 00:00 UTC (2:00 p.m. HST, July 19) at 17°24′N 140°36′W / 17.4°N 140.6°W – Tropical Depression Dora crosses into the Central Pacific basin. [15] [26]
- 18:00 UTC (11:00 a.m. PDT) at 17°12′N 128°54′W / 17.2°N 128.9°W – Hurricane Eugene weakens to Category 2 intensity about 1,290 mi (2,075 km) west-southwest of the southern tip of the Baja California peninsula. [28]
July 21
- 00:00 UTC (2:00 p.m. HST, July 20) at 17°12′N 146°00′W / 17.2°N 146.0°W – Tropical Depression Dora dissipates about 575 mi (925 km) east of the Hawaiian Islands. [15] [25] [26]
July 22
- 00:00 UTC (5:00 p.m. PDT, July 21) at 18°42′N 135°18′W / 18.7°N 135.3°W – Hurricane Eugene weakens to Category 1 intensity about 1,655 mi (2,670 km) west-southwest of the southern tip of the Baja California peninsula. [28]
- 06:00 UTC (11:00 p.m. PDT, July 21) at 18°48′N 136°48′W / 18.8°N 136.8°W – Hurricane Eugene weakens into a tropical storm about 1,755 mi (2,825 km) west-southwest of the southern tip of the Baja California peninsula. [27] [28]
July 23
- 00:00 UTC (2:00 p.m. HST, July 22) at 19°30′N 142°00′W / 19.5°N 142.0°W – Tropical Storm Eugene crosses into the Central Pacific basin about 1,035 mi (1,670 km) east of Honolulu, Hawaii. [nb 4] [15] [28]
- 18:00 UTC (8:00 a.m. HST) at 19°00′N 148°48′W / 19.0°N 148.8°W – Tropical Storm Eugene weakens into a tropical depression about 610 mi (980 km) east-southeast of Honolulu, Hawaii. [28]
July 24
- 12:00 UTC (2:00 a.m. HST) at 19°12′N 155°18′W / 19.2°N 155.3°W – Tropical Depression Eugene makes landfall on the southern portion of the Big Island of Hawaii. [15] [28]
July 25
- 00:00 UTC (2:00 p.m. HST, July 24) at 19°24′N 160°00′W / 19.4°N 160.0°W – Tropical Depression Eugene is last noted about 190 mi (305 km) southwest of Honolulu, Hawaii; it dissipates six hours later. [27] [28]
August
August 9
- 00:00 UTC (2:00 p.m. HST, August 8) at 12°30′N 144°00′W / 12.5°N 144.0°W – Tropical Depression One-C forms from an area of disturbed weather about 1,725 mi (2,780 km) east-southeast of Johnston Atoll. [15]
- 06:00 UTC (1:00 a.m. CDT) at 13°12′N 104°00′W / 13.2°N 104.0°W – Tropical Depression Seven-E forms from a tropical wave about 405 mi (650 km) south of Manzanillo, Colima. [29] [30]
- 18:00 UTC (12:00 p.m. MDT) at 13°42′N 107°24′W / 13.7°N 107.4°W – Tropical Depression Seven-E strengthens into Tropical Storm Fernanda about 635 mi (1,020 km) south-southeast of the southern tip of the Baja California peninsula. [29] [30]
August 10
- 18:00 UTC (12:00 p.m. MDT) at 14°18′N 114°54′W / 14.3°N 114.9°W – Tropical Storm Fernanda strengthens into a Category 1 hurricane about 675 mi (1,085 km) south-southwest of the southern tip of the Baja California peninsula. [29] [30]
August 11
- 00:00 UTC (5:00 p.m. PDT, August 10) at 14°18′N 116°42′W / 14.3°N 116.7°W – Hurricane Fernanda strengthens to Category 2 intensity about 735 mi (1,185 km) southwest of the southern tip of the Baja California peninsula. [30]
- 06:00 UTC (11:00 p.m. PDT, August 10) at 14°18′N 118°36′W / 14.3°N 118.6°W – Hurricane Fernanda strengthens to Category 3 intensity about 815 mi (1,315 km) southwest of the southern tip of the Baja California peninsula, making it the third major hurricane of the season. [30]
- 12:00 UTC (5:00 a.m. PDT) at 14°24′N 120°24′W / 14.4°N 120.4°W – Hurricane Fernanda strengthens to Category 4 intensity about 900 mi (1,445 km) southwest of the southern tip of the Baja California peninsula. [30]
August 12
- 00:00 UTC (5:00 p.m. PDT, August 11) at 14°48′N 123°54′W / 14.8°N 123.9°W – Hurricane Fernanda reaches peak winds of 145 mph (230 km/h) and a minimum barometric pressure of 934 mbar (27.58 inHg) about 1,065 mi (1,715 km) southwest of the southern tip of the Baja California peninsula. [29] [30]
- 18:00 UTC (8:00 a.m. HST) at 11°48′N 151°00′W / 11.8°N 151.0°W – Tropical Depression One-C strengthens into Tropical Storm Keoni about 1,285 mi (2,065 km) east-southeast of Johnston Atoll. [15]
August 13
- 06:00 UTC (11:00 p.m. PDT, August 12) at 16°54′N 132°36′W / 16.9°N 132.6°W – Hurricane Fernanda weakens to Category 3 intensity about 1,525 mi (2,455 km) west-southwest of the southern tip of the Baja California peninsula. [30]
- 18:00 UTC (11:00 a.m. PDT) at 17°42′N 136°06′W / 17.7°N 136.1°W – Hurricane Fernanda weakens to Category 2 intensity about 1,725 mi (2,780 km) west-southwest of the southern tip of the Baja California peninsula. [30]
August 14
- 12:00 UTC (2:00 a.m. HST) ar 18°36′N 141°12′W / 18.6°N 141.2°W – Hurricane Fernanda weakens to Category 1 intensity as it crosses into the Central Pacific basin about 940 mi (1,510 km) east of the Big Island of Hawaii. [nb 5] [15] [29] [30]
- 18:00 UTC (8:00 a.m. HST) at 13°18′N 161°00′W / 13.3°N 161.0°W – Tropical Storm Keoni strengthens into a Category 1 hurricane about 615 mi (990 km) east-southeast of Johnston Atoll. [15]
August 15
- 00:00 UTC (7:00 p.m. CDT, August 14) at 14°48′N 102°24′W / 14.8°N 102.4°W – A tropical depression forms from the remnants of Tropical Storm Bret, which was part of the 1993 Atlantic hurricane season, about 335 mi (535 km) south-southeast of Manzanillo, Colima. [31] [32]
- 12:00 UTC (2:00 a.m. HST) at 13°54′N 165°18′W / 13.9°N 165.3°W – Hurricane Keoni strengthens to Category 2 intensity about 345 mi (555 km) southeast of Johnston Atoll. [15]
- 12:00 UTC (7:00 a.m. CDT) at 16°12′N 104°00′W / 16.2°N 104.0°W – The aforementioned tropical depression strengthens into Tropical Storm Greg about 195 mi (315 km) south of Manzanillo, Colima. [31] [32]
- 18:00 UTC (8:00 a.m. HST) at 20°00′N 148°00′W / 20.0°N 148.0°W – Hurricane Fernanda regains Category 2 status and reaches a secondary peak intensity with winds of 105 mph (165 km/h) and a barometric pressure of 975 mbar (28.79 inHg) about 490 mi (790 km) east of the Big Island of Hawaii. [15] [30]
August 16
- 06:00 UTC (8:00 p.m. HST, August 15) at 14°24′N 169°30′W / 14.4°N 169.5°W – Hurricane Keoni strengthens to Category 3 intensity about 160 mi (260 km) south of Johnston Atoll, making it the fourth major hurricane of the season. [15]
- 12:00 UTC (2:00 a.m. HST) at 14°48′N 170°48′W / 14.8°N 170.8°W – Hurricane Keoni strengthens to Category 4 intensity about 160 mi (260 km) south-southwest of Johnston Atoll. It simultaneously reaches peak winds of 130 mph (215 km/h). [15]
- 12:00 UTC (6:00 a.m. MDT) at 18°30′N 107°30′W / 18.5°N 107.5°W – Tropical Storm Greg strengthens into a Category 1 hurricane about 215 mi (345 km) west of Manzanillo, Colima. [31] [32]
- 18:00 UTC (12:00 a.m. MDT) at 18°48′N 108°00′W / 18.8°N 108.0°W – Hurricane Greg strengthens to Category 2 status about 240 mi (390 km) west of Manzanillo, Colima. It simultaneously reaches its initial peak intensity with winds of 105 mph (165 km/h) and a barometric pressure of 970 mbar (28.64 inHg). [31] [32]
August 17
- 00:00 UTC (2:00 p.m. HST, August 16) at 20°48′N 150°42′W / 20.8°N 150.7°W – Hurricane Fernanda weakens back to Category 1 intensity about 320 mi (520 km) east-northeast of the Big Island of Hawaii. [15] [30]
- 06:00 UTC (1:00 a.m. CDT) at 13°24′N 94°54′W / 13.4°N 94.9°W – Tropical Depression Nine-E forms from a tropical wave over the Gulf of Tehuantepec, about 185 mi (295 km) south-southeast of Huatulco. [14] [33]
- 12:00 UTC (2:00 a.m. HST) at 16°30′N 173°36′W / 16.5°N 173.6°W – Hurricane Keoni weakens to Category 3 intensity about 270 mi (435 km) west of Johnston Atoll. [15]
- 12:00 UTC (6:00 a.m. MDT) at 19°12′N 109°24′W / 19.2°N 109.4°W – Hurricane Greg weakens to Category 1 intensity about 260 mi (415 km) south of the southern tip of the Baja California peninsula. [32]
- 18:00 UTC (8:00 a.m. HST) at 17°00′N 174°12′W / 17.0°N 174.2°W – Hurricane Keoni weakens to Category 2 intensity about 310 mi (500 km) west of Johnston Atoll. [15]
- 18:00 UTC (8:00 a.m. HST) at 23°36′N 151°36′W / 23.6°N 151.6°W – Hurricane Fernanda weakens into a tropical storm about 375 mi (600 km) northeast of the Big Island of Hawaii. [15] [30]
August 18
- 00:00 UTC (7:00 p.m. CDT, August 17) at 13°24′N 95°42′W / 13.4°N 95.7°W – Tropical Depression Nine-E strengthens into Tropical Storm Hilary about 140 mi (220 km) south of Huatulco. [14] [33]
- 12:00 UTC (2:00 a.m. HST) at 18°00′N 175°42′W / 18.0°N 175.7°W – Hurricane Keoni weakens to Category 1 intensity about 415 mi (665 km) west of Johnston Atoll. [15]
- 18:00 UTC (12:00 p.m. MDT) at 18°18′N 112°48′W / 18.3°N 112.8°W – Hurricane Greg regains Category 2 intensity about 360 mi (585 km) south-southwest of the southern tip of the Baja California peninsula. [32]
August 19
- 06:00 UTC (12:00 a.m. MDT) at 18°18′N 114°42′W / 18.3°N 114.7°W – Hurricane Greg strengthens to Category 3 intensity about 435 mi (705 km) southwest of the southern tip of the Baja California peninsula, making it the fifth major hurricane of the season. [32]
- 12:00 UTC (2:00 a.m. HST) at 29°42′N 154°00′W / 29.7°N 154.0°W – Tropical Storm Fernanda is last noted as a tropical cyclone about 700 mi (1,130 km) north of the Big Island of Hawaii; it transitions into an extratropical cyclone six hours later. [15] [30]
- 12:00 UTC (5:00 a.m. PDT) at 18°12′N 115°48′W / 18.2°N 115.8°W – Hurricane Greg strengthens to Category 4 intensity about 495 mi (795 km) southwest of the southern tip of the Baja California peninsula. It simultaneously reaches peak winds of 130 mph (215 km/h). [31] [32]
- 12:00 UTC (7:00 a.m. CDT) at 14°48′N 102°12′W / 14.8°N 102.2°W – Tropical Storm Hilary strengthens into a Category 1 hurricane about 330 mi (530 km) south-southeast of Manzanillo, Colima. [14] [33]
- 18:00 UTC (8:00 a.m. HST) at 20°06′N 180°00′W / 20.1°N 180.0°W – Hurricane Keoni crosses the International Date Line about 725 mi (1,165 km) west-northwest of Johnston Atoll and is redesignated as Typhoon Keoni in the Western Pacific basin. [15]
- 18:00 UTC (11:00 a.m. PDT) at 18°12′N 116°48′W / 18.2°N 116.8°W – Hurricane Greg reaches a minimum barometric pressure of 948 mbar (27.99 inHg) about 540 mi (870 km) southwest of the southern tip of the Baja California peninsula. [31] [32]
August 20
- 18:00 UTC (11:00 a.m. PDT) at 18°30′N 120°42′W / 18.5°N 120.7°W – Hurricane Greg weakens to Category 3 intensity about 755 mi (1,215 km) west-southwest of the southern tip of the Baja California peninsula. [32]
- 18:00 UTC (12:00 p.m. MDT) at 17°42′N 106°18′W / 17.7°N 106.3°W – Hurricane Hilary strengthens to Category 2 intensity about 160 mi (260 km) southwest of Manzanillo, Colima. [34]
August 21
- 06:00 UTC (12:00 a.m. MDT) at 18°18′N 107°24′W / 18.3°N 107.4°W – Hurricane Hilary strengthens to Category 3 intensity about 205 mi (335 km) west-southwest of Manzanillo, Colima, making it the sixth major hurricane of the season. [34]
- 06:00 UTC (1:00 a.m. CDT) at 13°24′N 99°54′W / 13.4°N 99.9°W – A tropical depression forms from a tropical wave about 490 mi (790 km) southeast of Manzanillo, Colima. [35] [36]
- 12:00 UTC (5:00 a.m. PDT) at 18°42′N 123°18′W / 18.7°N 123.3°W – Hurricane Greg weakens to Category 2 intensity about 910 mi (1,465 km) west-southwest of the southern tip of the Baja California peninsula. [32] [37]
- 12:00 UTC (6:00 a.m. MDT) at 18°36′N 107°54′W / 18.6°N 107.9°W – Hurricane Hilary reaches peak winds of 120 mph (195 km/h) and a minimum barometric pressure of 957 mbar (28.26 inHg) about 235 mi (380 km) west of Manzanillo, Colima. [33] [34]
- 12:00 UTC (7:00 a.m. CDT) at 14°12′N 101°00′W / 14.2°N 101.0°W – The aforementioned tropical depression strengthens into Tropical Storm Irwin about 405 mi (650 km) southeast of Manzanillo, Colima. [35] [36]
August 22
- 00:00 UTC (7:00 p.m. CDT, August 21) at 16°42′N 102°54′W / 16.7°N 102.9°W – Tropical Storm Irwin reaches peak winds of 70 mph (110 km/h) and a minimum barometric pressure of 999 mbar (29.50 inHg) about 190 mi (305 km) south-southeast of Manzanillo, Colima. [35] [36]
- 06:00 UTC (12:00 a.m. MDT) at 20°06′N 109°42′W / 20.1°N 109.7°W – Hurricane Hilary weakens to Category 2 intensity about 190 mi (305 km) south of the southern tip of the Baja California peninsula. [34]
- 12:00 UTC (7:00 a.m. CDT) at 18°42′N 105°00′W / 18.7°N 105.0°W – Tropical Storm Irwin weakens into a tropical depression about 50 mi (85 km) west-southwest of Manzanillo, Colima; it is absorbed by Hurricane Hilary six hours later. [35] [36]
- 18:00 UTC (11:00 a.m. PDT) at 19°18′N 127°54′W / 19.3°N 127.9°W – Hurricane Greg weakens to Category 1 intensity about 1,180 mi (1,900 km) west-southwest of the southern tip of the Baja California peninsula. [32] [37]
- 18:00 UTC (12:00 p.m. MDT) at 20°00′N 110°42′W / 20.0°N 110.7°W – Hurricane Hilary weakens to Category 1 intensity about 200 mi (325 km) south-southwest of the southern tip of the Baja California peninsula. [34]
August 23
- 00:00 UTC (6:00 p.m. MDT, August 22) at 20°00′N 110°30′W / 20.0°N 110.5°W – Hurricane Hilary weakens into a tropical storm about 200 mi (325 km) south of the southern tip of the Baja California peninsula. [34]
August 25
- 13:00 UTC (7:00 a.m. MDT) at 24°48′N 112°18′W / 24.8°N 112.3°W – Tropical Storm Hilary makes its first landfall on the west coast of the Baja California peninsula about 130 mi (215 km) west-northwest of La Paz with winds of 60 mph (95 km/h) and a barometric pressure of 993 mbar (29.32 inHg), re-emerging over the Pacific Ocean shortly thereafter. [34] [38]
- 18:00 UTC (12:00 p.m. MDT) at 25°18′N 112°18′W / 25.3°N 112.3°W – Tropical Storm Hilary reaches its secondary peak intensity with winds of 65 mph (100 km/h) and a barometric pressure of 991 mbar (29.26 inHg) about 150 mi (240 km) west-northwest of La Paz. [34] [38]
August 26
- 00:00 UTC (5:00 p.m. PDT, August 25) at 19°30′N 135°18′W / 19.5°N 135.3°W – Hurricane Greg weakens into a tropical storm about 1,645 mi (2,650 km) west-southwest of the southern tip of the Baja California peninsula. [32] [37]
- 00:00 UTC (6:00 p.m. MDT, August 25) at 25°54′N 112°12′W / 25.9°N 112.2°W – Tropical Storm Hilary makes its second landfall on the west coast of the Baja California peninsula about 180 mi (285 km) northwest of La Paz with winds of 60 mph (95 km/h) and a barometric pressure of 995 mbar (29.38 inHg). [34] [38]
- 12:00 UTC (6:00 a.m. MDT) at 27°54′N 112°06′W / 27.9°N 112.1°W – Tropical Storm Hilary weakens into a tropical depression over the Gulf of California about 110 mi (175 km) southwest of Hermosillo, Sonora. [34]
- 18:00 UTC (12:00 p.m. MDT) at 29°06′N 112°12′W / 29.1°N 112.2°W – Tropical Depression Hilary makes its third landfall about 85 mi (140 km) west of Hermosillo, Sonora with winds of 35 mph (55 km/h) and a barometric pressure of 1,008 mbar (29.77 inHg). [34] [38]
August 27
- 06:00 UTC (12:00 a.m. MDT) at 30°42′N 112°48′W / 30.7°N 112.8°W – Tropical Depression Hilary is last noted just inland to the east of the northern tip of the Gulf of California, dissipating shortly thereafter. [34] [38]
August 28
- 00:00 UTC (5:00 p.m. PDT, August 27) at 21°12′N 139°42′W / 21.2°N 139.7°W – Tropical Storm Greg weakens into a tropical depression about 1,905 mi (3,065 km) west of the southern tip of the Baja California peninsula. [32] [37]
- 06:00 UTC (8:00 p.m. HST, August 27) at 21°18′N 140°12′W / 21.3°N 140.2°W – Tropical Depression Greg crosses into the Central Pacific basin about 1,135 mi (1,825 km) east of Honolulu, Hawaii. [15] [32] [37]
- 18:00 UTC (8:00 a.m. HST) at 21°18′N 141°00′W / 21.3°N 141.0°W – Tropical Depression Greg is last noted about 1,080 mi (1,740 km) east of Honolulu, Hawaii; it dissipates six hours later. [15] [32] [37]
August 29
- 00:00 UTC (7:00 p.m. CDT, August 28) at 13°30′N 96°24′W / 13.5°N 96.4°W – Tropical Depression Eleven-E forms from a tropical wave about 345 mi (555 km) southeast of Acapulco, Guerrero. [39] [40]
- 18:00 UTC (1:00 p.m. CDT) at 14°18′N 99°54′W / 14.3°N 99.9°W – Tropical Depression Eleven-E strengthens into Tropical Storm Jova about 180 mi (285 km) south of Acapulco, Guerrero. [39] [40]
August 31
- 06:00 UTC (1:00 a.m. CDT) at 16°12′N 103°24′W / 16.2°N 103.4°W – Tropical Storm Jova strengthens into a Category 1 hurricane about 205 mi (335 km) south-southeast of Manzanillo, Colima. [39] [40]
September
September 1
- 00:00 UTC (7:00 p.m. CDT, August 31) at 17°12′N 105°12′W / 17.2°N 105.2°W – Hurricane Jova rapidly strengthens to Category 3 intensity, skipping Category 2 status, about 140 mi (220 km) south-southwest of Manzanillo, Colima; this makes it the seventh major hurricane of the season. [40]
- 06:00 UTC (1:00 a.m. CDT) at 17°30′N 105°54′W / 17.5°N 105.9°W – Hurricane Jova strengthens to Category 4 intensity about 145 mi (230 km) southwest of Manzanillo, Colima; it simultaneously reaches peak winds of 130 mph (215 km/h) and a minimum barometric pressure of 948 mbar (27.99 inHg). [39] [40]
- 18:00 UTC (12:00 p.m. MDT) at 18°12′N 107°24′W / 18.2°N 107.4°W – Hurricane Jova weakens to Category 3 intensity about 215 mi (345 km) west-southwest of Manzanillo, Colima. [40]
September 2
- 06:00 UTC (12:00 a.m. MDT) at 19°06′N 109°00′W / 19.1°N 109.0°W – Hurricane Jova weakens to Category 2 intensity about 270 mi (435 km) south-southeast of the southern tip of the Baja California peninsula. [40]
- 12:00 UTC (6:00 a.m. MDT) at 19°30′N 109°54′W / 19.5°N 109.9°W – Hurricane Jova weakens to Category 1 intensity about 235 mi (380 km) south of the southern tip of the Baja California peninsula. [40]
September 3
- 00:00 UTC (6:00 p.m. MDT, September 2) at 20°24′N 111°54′W / 20.4°N 111.9°W – Hurricane Jova regains Category 2 intensity about 215 mi (345 km) southwest of the southern tip of the Baja California peninsula. [40]
- 06:00 UTC (12:00 a.m. MDT) at 20°48′N 113°00′W / 20.8°N 113.0°W – Hurricane Jova reaches its secondary peak intensity with winds of 105 mph (165 km/h) and a barometric pressure of 970 mbar (28.64 inHg) about 240 mi (390 km) southwest of the southern tip of the Baja California peninsula. [40]
- 18:00 UTC (11:00 a.m. PDT) at 21°30′N 115°30′W / 21.5°N 115.5°W – Hurricane Jova weakens back to Category 1 intensity about 370 mi (595 km) west-southwest of the southern tip of the Baja California peninsula. [40]
September 4
- 06:00 UTC (11:00 p.m. PDT, September 3) at 21°48′N 118°06′W / 21.8°N 118.1°W – Hurricane Jova weakens into a tropical storm about 525 mi (845 km) west of the southern tip of the Baja California peninsula. [40]
- 12:00 UTC (5:00 a.m. PDT) at 21°42′N 119°00′W / 21.7°N 119.0°W – Tropical Storm Jova weakens into a tropical depression about 580 mi (935 km) west of the southern tip of the Baja California peninsula. [40]
September 5
- 12:00 UTC (6:00 a.m. MDT) at 12°12′N 107°12′W / 12.2°N 107.2°W – Tropical Depression Twelve-E forms from an area of disturbed weather about 740 mi (1,195 km) south-southeast of the southern tip of the Baja California peninsula. [41] [42]
September 6
- 00:00 UTC (5:00 p.m. PDT, September 5) at 21°24′N 122°36′W / 21.4°N 122.6°W – Tropical Depression Jova degenerates into a remnant low about 815 mi (1,315 km) west of the southern tip of the Baja California peninsula. [39] [40]
- 06:00 UTC (12:00 a.m. MDT) at 12°24′N 108°06′W / 12.4°N 108.1°W – Tropical Depression Twelve-E strengthens into Tropical Storm Kenneth about 720 mi (1,160 km) south of the southern tip of the Baja California peninsula. [41] [42]
September 8
- 06:00 UTC (12:00 a.m. MDT) at 14°42′N 112°00′W / 14.7°N 112.0°W – Tropical Storm Kenneth strengthens into a Category 1 hurricane about 580 mi (935 km) south-southwest of the southern tip of the Baja California peninsula. [41] [42]
- 12:00 UTC (7:00 a.m. CDT) at 10°36′N 94°48′W / 10.6°N 94.8°W – A tropical depression forms from a tropical wave about 385 mi (620 km) south of Salina Cruz, Oaxaca. [43] [44]
September 9
- 00:00 UTC (7:00 p.m. CDT, September 8) at 11°48′N 95°42′W / 11.8°N 95.7°W – The aforementioned tropical depression strengthens into Tropical Storm Lidia about 310 mi (500 km) south-southwest of Salina Cruz, Oaxaca. [43] [44]
September 10
- 06:00 UTC (11:00 p.m. PDT, September 9) at 15°18′N 117°24′W / 15.3°N 117.4°W – Hurricane Kenneth strengthens to Category 2 intensity about 715 mi (1,150 km) southwest of the southern tip of the Baja California peninsula. [42]
- 06:00 UTC (1:00 a.m. CDT) at 14°06′N 100°06′W / 14.1°N 100.1°W – Tropical Storm Lidia strengthens into a Category 1 hurricane about 310 mi (500 km) west-southwest of Salina Cruz, Oaxaca. [44]
- 12:00 UTC (5:00 a.m. PDT) at 15°42′N 117°54′W / 15.7°N 117.9°W – Hurricane Kenneth strengthens to Category 3 intensity about 715 mi (1,150 km) southwest of the southern tip of the Baja California peninsula, making it the eighth major hurricane of the season. [42]
- 18:00 UTC (11:00 a.m. PDT) at 16°06′N 118°24′W / 16.1°N 118.4°W – Hurricane Kenneth strengthens to Category 4 intensity about 720 mi (1,160 km) southwest of the southern tip of the Baja California peninsula. [42]
- 18:00 UTC (1:00 p.m. CDT) at 15°36′N 102°48′W / 15.6°N 102.8°W – Hurricane Lidia strengthens to Category 2 intensity about 505 mi (815 km) west of Salina Cruz, Oaxaca. [44]
September 11
- 00:00 UTC (7:00 p.m. CDT, September 10) at 16°12′N 104°12′W / 16.2°N 104.2°W – Hurricane Lidia rapidly strengthens to Category 4 intensity, skipping Category 3 status, off the southwestern coast of Mexico; this makes it the ninth major hurricane of the season. [44]
- 06:00 UTC (11:00 p.m. PDT, September 10) at 17°12′N 119°36′W / 17.2°N 119.6°W – Hurricane Kenneth reaches peak winds of 150 mph (240 km/h) and a minimum barometric pressure of 932 mbar (27.52 inHg) about 735 mi (1,185 km) southwest of the southern tip of the Baja California peninsula. [41] [42]
- 06:00 UTC (1:00 a.m. CDT) at 16°42′N 105°24′W / 16.7°N 105.4°W – Hurricane Lidia reaches peak winds of 150 mph (240 km/h) and a minimum barometric pressure of 930 mbar (27.46 inHg) off the southwestern coast of Mexico, making it the strongest storm of the season. [43] [44]
September 12
- 00:00 UTC (6:00 p.m. MDT, September 11) at 19°00′N 108°30′W / 19.0°N 108.5°W – Hurricane Lidia weakens to Category 3 intensity about 410 mi (660 km) south of Culiacán, Sinaloa. [44]
- 06:00 UTC (11:00 p.m. PDT, September 11) at 18°12′N 122°54′W / 18.2°N 122.9°W – Hurricane Kenneth weakens to Category 3 intensity about 900 mi (1,445 km) west-southwest of the southern tip of the Baja California peninsula. [42]
- 12:00 UTC (6:00 a.m. MDT) at 20°24′N 109°48′W / 20.4°N 109.8°W – Hurricane Lidia weakens to Category 2 intensity about 340 mi (545 km) south-southwest of Culiacán, Sinaloa. [44]
- 18:00 UTC (11:00 a.m. PDT) at 18°06′N 124°36′W / 18.1°N 124.6°W – Hurricane Kenneth weakens to Category 2 intensity about 1,000 mi (1,610 km) west-southwest of the southern tip of the Baja California peninsula. [42]
September 13
- 08:00 UTC (2:00 a.m. MDT) at 24°18′N 107°30′W / 24.3°N 107.5°W – Hurricane Lidia makes landfall about 40 mi (65 km) south-southwest of Culiacán, Sinaloa with winds of 100 mph (155 km/h) and a barometric pressure of 975 mbar (28.79 inHg). [44] [45]
- 12:00 UTC (6:00 a.m. MDT) at 25°54′N 106°18′W / 25.9°N 106.3°W – Hurricane Lidia rapidly weakens into a tropical storm inland about 105 mi (165 km) northeast of Culiacán, Sinaloa. [44] [45]
September 14
- 00:00 UTC (7:00 p.m. CDT, September 13) at 29°30′N 101°00′W / 29.5°N 101.0°W – Tropical Storm Lidia weakens into a tropical depression inland near the Texas–Mexico border. [44] [45]
- 06:00 UTC (11:00 p.m. PDT, September 13) at 19°12′N 130°48′W / 19.2°N 130.8°W – Hurricane Kenneth weakens to Category 1 intensity about 1,365 mi (2,195 km) west-southwest of the southern tip of the Baja California peninsula. [42]
- 06:00 UTC (1:00 a.m. CDT) at 30°30′N 98°30′W / 30.5°N 98.5°W – Tropical Depression Lidia is last noted inland about 45 mi (75 km) west-northwest of Austin, Texas; it dissipates six hours later. [44] [45]
September 15
- 00:00 UTC (5:00 p.m. PDT, September 14) at 20°42′N 133°30′W / 20.7°N 133.5°W – Hurricane Kenneth weakens into a tropical storm about 1,515 mi (2,435 km) west of the southern tip of the Baja California peninsula. [41] [42]
September 16
- 12:00 UTC (5:00 a.m. PDT) at 23°00′N 137°30′W / 23.0°N 137.5°W – Tropical Storm Kenneth weakens into a tropical depression about 1,750 mi (2,815 km) west of the southern tip of the Baja California peninsula. [41] [42]
September 17
- 18:00 UTC (11:00 a.m. PDT) at 24°48′N 138°54′W / 24.8°N 138.9°W – Tropical Depression Kenneth is last noted about 1,830 mi (2,945 km) west of the southern tip of the Baja California peninsula; it dissipates six hours later. [41] [42]
September 21
- 18:00 UTC (1:00 p.m. CDT) at 20°48′N 104°42′W / 20.8°N 104.7°W – Tropical Depression Gert of the 1993 Atlantic hurricane season is located just inland from the Pacific coast of Mexico; it emerges over the Pacific Ocean within the next six hours, at which point it is redesignated as Tropical Depression Fourteen-E. [46]
September 22
- 00:00 UTC (6:00 p.m. MDT, September 21) at 20°54′N 106°30′W / 20.9°N 106.5°W – Tropical Depression Fourteen-E reaches peak winds of 35 mph (55 km/h). [46]
September 23
- 00:00 UTC (6:00 p.m. MDT, September 22) at 22°12′N 110°36′W / 22.2°N 110.6°W – Tropical Depression Fourteen-E reaches a minimum barometric pressure of 1,002 mbar (29.59 inHg). [46]
September 26
- 00:00 UTC (5:00 p.m. PDT, September 25) at 20°48′N 116°00′W / 20.8°N 116.0°W – Tropical Depression Fourteen-E is last noted; it dissipates shortly thereafter. [46]
September 30
- 00:00 UTC (6:00 p.m. MDT, September 29) at 10°30′N 114°36′W / 10.5°N 114.6°W – A tropical depression forms from a tropical wave. [47] [48]
- 12:00 UTC (6:00 a.m. MDT) at 11°12′N 114°54′W / 11.2°N 114.9°W – The tropical depression strengthens into Tropical Storm Max; it simultaneously attains its initial peak intensity with winds of 40 mph (65 km/h) and a barometric pressure of 1,004 mbar (29.65 inHg). [47] [48]
October
October 1
- 00:00 UTC (5:00 p.m. PDT, September 30) at 11°24′N 115°24′W / 11.4°N 115.4°W – Tropical Storm Max weakens into a tropical depression. [47] [48]
- 18:00 UTC (11:00 a.m. PDT) at 11°18′N 116°24′W / 11.3°N 116.4°W – Tropical Depression Max restrengthens into a tropical storm. [48]
October 2
- 00:00 UTC (5:00 p.m. PDT, October 1) at 11°00′N 116°42′W / 11.0°N 116.7°W – Tropical Storm Max reaches peak winds of 45 mph (75 km/h) and a minimum barometric pressure of 1,000 mbar (29.53 inHg). [47] [48]
- 18:00 UTC (12:00 p.m. MDT) at 13°24′N 111°12′W / 13.4°N 111.2°W – Tropical Depression Sixteen-E forms from a large area of disturbed weather about 690 mi (1,110 km) south of the southern tip of the Baja California peninsula. [49] [50]
October 3
- 12:00 UTC (5:00 a.m. PDT) at 11°42′N 117°00′W / 11.7°N 117.0°W – Tropical Storm Max weakens back into a tropical depression. [48]
- 12:00 UTC (6:00 a.m. MDT) at 15°42′N 113°12′W / 15.7°N 113.2°W – Tropical Depression Sixteen-E strengthens into Tropical Storm Norma about 540 mi (870 km) south-southwest of the southern tip of the Baja California peninsula. [49] [50]
October 4
- 00:00 UTC (5:00 p.m. PDT, October 3) at 13°54′N 116°42′W / 13.9°N 116.7°W – Tropical Depression Max is absorbed by Tropical Storm Norma. [47] [48]
- 00:00 UTC (6:00 p.m. MDT, October 3) at 17°30′N 114°24′W / 17.5°N 114.4°W – Tropical Storm Norma reaches peak winds of 50 mph (85 km/h) and a minimum barometric pressure of 1,000 mbar (29.53 inHg) about 470 mi (760 km) southwest of the southern tip of the Baja California peninsula. [49] [50]
October 5
- 00:00 UTC (5:00 p.m. PDT, October 4) at 18°12′N 117°06′W / 18.2°N 117.1°W – Tropical Storm Norma weakens into a tropical depression about 565 mi (910 km) southwest of the southern tip of the Baja California peninsula. [49] [50]
October 6
- 18:00 UTC (11:00 a.m. PDT) at 21°36′N 118°42′W / 21.6°N 118.7°W – Tropical Depression Norma is last noted about 565 mi (910 km) west of the southern tip of the Baja California peninsula; it dissipates shortly thereafter. [50]
October 11
- 18:00 UTC (11:00 a.m. PDT) at 15°36′N 120°48′W / 15.6°N 120.8°W – Tropical Depression Seventeen-E forms. [51]
October 12
- 00:00 UTC (5:00 p.m. PDT, October 11) at 16°30′N 121°42′W / 16.5°N 121.7°W – Tropical Depression Seventeen-E reaches peak winds of 35 mph (55 km/h) and a minimum barometric pressure of 1,009 mbar (29.80 inHg). [51]
October 14
- 00:00 UTC (5:00 p.m. PDT, October 13) at 22°06′N 126°48′W / 22.1°N 126.8°W – Tropical Depression Seventeen-E is last noted; it dissipates shortly thereafter. [51]
November
- No tropical cyclones formed in November.
November 30
- The 1993 Pacific hurricane season officially ends. [1]
Notes
- ^ Broadly speaking, Accumulated Cyclone Energy is the square of a tropical cyclone's wind intensity in knots at 6-hour intervals, multiplied by the length of time it existed. [5]
- ^ Sources conflict on the exact number of deaths from Calvin. While the National Hurricane Center stated in their Preliminary Report for Calvin that 34 fatalities had occurred, [7] articles from Gulf News and the Los Angeles Times have given a death toll of 37. [8] [9]
- ^ Sources conflict on the exact number of deaths from Lidia. A September 1993 article by the Oxnard Press-Courier stated that Lidia had killed 7 people, [11] while the National Hurricane Center's report on the season gave a death toll of 2. [3]
- ^ The National Hurricane Center and the Central Pacific Hurricane Center disagree on when Eugene entered the Central Pacific basin. In their overall report on the tropical cyclones which entered their area of responsibility (AOR) in 1993, the Central Pacific Hurricane Center states that Eugene did so at 18:00 UTC on July 22; [15] at this time, the National Hurricane Center lists Eugene's longitude as 139.8°W, just east of the Central Pacific basin limits. [28] As both agencies agree that Eugene was in the Central Pacific basin at 00:00 UTC on July 23, and because the National Hurricane Center's Preliminary Report on Eugene contains the storm's full track, the National Hurricane Center is given precedence.
- ^ The National Hurricane Center and the Central Pacific Hurricane Center disagree on when Fernanda entered the Central Pacific basin. In their overall report on the tropical cyclones which entered their AOR in 1993, the Central Pacific Hurricane Center states that Fernanda did so at 06:00 UTC on August 14; [15] at this time, the National Hurricane Center lists Fernanda's longitude as 139.6°W, just east of the Central Pacific basin limits. [30] As both agencies agree that Fernanda was in the Central Pacific basin at 12:00 UTC on August 14, and because the National Hurricane Center's Preliminary Report on Fernanda contains the storm's full track, the National Hurricane Center is given precedence.
See also
References
- ^ a b c d e "Tropical Cyclone Climatology". Miami, Florida: National Hurricane Center. Archived from the original on February 23, 2024. Retrieved February 17, 2024.
-
^
National Hurricane Center;
Hurricane Research Division;
Central Pacific Hurricane Center (April 4, 2023).
"The Northeast and North Central Pacific hurricane database 1949–2022". United States National Oceanic and Atmospheric Administration's National Weather Service. A guide on how to read the database is available
here. This article incorporates text from this source, which is in the
public domain.
- ^ a b c d Avila, Lixion A.; Mayfield, Britt M. (March 1, 1995). "Eastern North Pacific Hurricane Season of 1993". Monthly Weather Review. 123 (3). American Meteorological Society: 1393–1410. Bibcode: 1995MWRv..123..897A. doi: 10.1175/1520-0493(1995)123<0897:ENPHSO>2.0.CO;2.
- ^ Jan Tenbruggencate (August 22, 1993). "Weird weather in the Pacific due to El Nino". The Honolulu Advertiser. Honolulu, Hawaii. p. 6. Archived from the original on February 23, 2024. Retrieved February 20, 2024 – via Newspapers.com.
- ^ "Background information: Eastern Pacific Hurricane Season". United States Climate Prediction Center. May 22, 2019. Archived from the original on July 24, 2020. Retrieved February 20, 2024.
- ^ "Basin Archives: Northeast Pacific Ocean Historical Tropical Cyclone Statistics". Fort Collins, Colorado: Colorado State University. Archived from the original on December 17, 2023. Retrieved February 20, 2024.
- ^ Rappaport, Edward (August 2, 1993). Hurricane Calvin Preliminary Report (Page Three) (GIF) (Report). National Hurricane Center. Archived from the original on February 15, 2024. Retrieved February 15, 2024.
- ^ Kareem, Abdul (July 6, 2018). "July 7, 1993: Hurricane Calvin kills 37 in Mexico". Gulf News. Dubai, United Arab Emirates. Archived from the original on February 15, 2024. Retrieved February 15, 2024.
- ^ Darling, Juanita (July 9, 1993). "Death Toll 37 in Mexico as Storm Heads Out to Sea : Disaster: About a third of nation is under state of emergency. Officials report 42,000 homeless". Los Angeles Times. Los Angeles, California. Archived from the original on February 15, 2024. Retrieved February 15, 2024.
- ^ Rappaport, Edward (August 2, 1993). Hurricane Calvin Preliminary Report (Page Four) (GIF) (Report). National Hurricane Center. Archived from the original on February 20, 2024. Retrieved February 20, 2024.
- ^ "Storm kills 7, forces evacuations". Oxnard Press-Courier. Associated Press. September 18, 1993. Retrieved February 20, 2024.
- ^ "Texas reeling from series of tornadoes". The Tuscaloosa News. Associated Press. September 14, 1993. Retrieved February 20, 2024.
- ^ a b c Pasch, Richard J. (November 18, 1993). Tropical Depression Three-E Preliminary Report (Page One) (GIF) (Report). National Hurricane Center. Archived from the original on January 2, 2022. Retrieved January 31, 2024.
- ^ a b c d Rappaport, Edward (September 27, 1993). Hurricane Hilary Preliminary Report (Page Three) (GIF) (Report). National Hurricane Center. Archived from the original on February 3, 2024. Retrieved February 3, 2024.
- ^ a b c d e f g h i j k l m n o p q r s t u v w x Tropical Cyclones 1993 (PDF) (Report). Central Pacific Hurricane Center. Archived (PDF) from the original on February 7, 2024. Retrieved February 1, 2024.
- ^ "Understanding the Date/Time Stamps". Silver Spring, Maryland: National Weather Service. Archived from the original on February 26, 2023. Retrieved February 23, 2024.
- ^ a b c d Lawrence, Miles (July 10, 1993). Hurricane Adrian Preliminary Report (Page One) (GIF) (Report). National Hurricane Center. Archived from the original on July 15, 2023. Retrieved February 6, 2024.
- ^ a b c d e f g Lawrence, Miles (July 10, 1993). Hurricane Adrian Preliminary Report (Page Three) (GIF) (Report). National Hurricane Center. Archived from the original on July 15, 2023. Retrieved January 31, 2024.
- ^ a b c Mayfield, Max (July 31, 1993). Tropical Storm Beatriz Preliminary Report (Page One) (GIF) (Report). National Hurricane Center. Archived from the original on February 6, 2024. Retrieved February 6, 2024.
- ^ a b c d Mayfield, Max (July 31, 1993). Tropical Storm Beatriz Preliminary Report (Page Three) (GIF) (Report). National Hurricane Center. Archived from the original on January 31, 2024. Retrieved January 31, 2024.
- ^ a b c d Pasch, Richard J. (November 18, 1993). Tropical Depression Three-E Preliminary Report (Page Two) (GIF) (Report). National Hurricane Center. Archived from the original on January 31, 2024. Retrieved January 31, 2024.
- ^ a b c Rappaport, Edward (August 2, 1993). Hurricane Calvin Preliminary Report (Page One) (GIF) (Report). National Hurricane Center. Archived from the original on February 6, 2024. Retrieved February 6, 2024.
- ^ a b c d e f g h i Rappaport, Edward (August 2, 1993). Hurricane Calvin Preliminary Report (Page Five) (GIF) (Report). National Hurricane Center. Archived from the original on January 31, 2024. Retrieved January 31, 2024.
- ^ a b Rappaport, Edward (August 2, 1993). Hurricane Calvin Preliminary Report (Page Two) (GIF) (Report). National Hurricane Center. Archived from the original on February 6, 2024. Retrieved February 6, 2024.
- ^ a b c d e f Avila, Lixion (1993). Hurricane Dora Preliminary Report (Page One) (GIF) (Report). National Hurricane Center. Archived from the original on February 6, 2024. Retrieved February 6, 2024.
- ^ a b c d e f g h i j k l m n Avila, Lixion (1993). Hurricane Dora Preliminary Report (Page Three) (GIF) (Report). National Hurricane Center. Archived from the original on March 4, 2016. Retrieved January 31, 2024.
- ^ a b c d e f g Lawrence, Miles (October 7, 1993). Hurricane Eugene Preliminary Report (Page One) (GIF) (Report). National Hurricane Center. Archived from the original on February 6, 2024. Retrieved February 6, 2024.
- ^ a b c d e f g h i j k l m n o Lawrence, Miles (October 7, 1993). Hurricane Eugene Preliminary Report (Page Three) (GIF) (Report). National Hurricane Center. Archived from the original on February 1, 2024. Retrieved February 1, 2024.
- ^ a b c d e Mayfield, Max (October 19, 1993). Hurricane Fernanda Preliminary Report (Page One) (GIF) (Report). National Hurricane Center. Archived from the original on March 13, 2016. Retrieved February 6, 2024.
- ^ a b c d e f g h i j k l m n o Mayfield, Max (October 19, 1993). Hurricane Fernanda Preliminary Report (Page Three) (GIF) (Report). National Hurricane Center. Archived from the original on March 4, 2016. Retrieved February 2, 2024.
- ^ a b c d e f Pasch, Richard J. (November 28, 1993). Hurricane Greg Preliminary Report (Page One) (GIF) (Report). National Hurricane Center. Archived from the original on March 4, 2016. Retrieved February 6, 2024.
- ^ a b c d e f g h i j k l m n o p Pasch, Richard J. (November 28, 1993). Hurricane Greg Preliminary Report (Page Three) (GIF) (Report). National Hurricane Center. Archived from the original on February 2, 2024. Retrieved February 2, 2024.
- ^ a b c d Rappaport, Edward (September 27, 1993). Hurricane Hilary Preliminary Report (Page Three) (GIF) (Report). National Hurricane Center. Archived from the original on November 3, 2023. Retrieved February 6, 2024.
- ^ a b c d e f g h i j k l Rappaport, Edward (September 27, 1993). Hurricane Hilary Preliminary Report (Page Four) (GIF) (Report). National Hurricane Center. Archived from the original on August 25, 2008. Retrieved February 3, 2024.
- ^ a b c d Avila, Lixion A. (October 19, 1993). Tropical Storm Irwin Preliminary Report (Page One) (GIF) (Report). National Hurricane Center. Archived from the original on February 6, 2024. Retrieved February 6, 2024.
- ^ a b c d Avila, Lixion A. (October 19, 1993). Tropical Storm Irwin Preliminary Report (Page Two) (GIF) (Report). National Hurricane Center. Archived from the original on February 3, 2024. Retrieved February 3, 2024.
- ^ a b c d e f Pasch, Richard J. (November 28, 1993). Hurricane Greg Preliminary Report (Page Two) (GIF) (Report). National Hurricane Center. Archived from the original on February 6, 2024. Retrieved February 6, 2024.
- ^ a b c d e Rappaport, Edward (September 27, 1993). Hurricane Hilary Preliminary Report (Page Two) (GIF) (Report). National Hurricane Center. Archived from the original on February 6, 2024. Retrieved February 6, 2024.
- ^ a b c d e Lawrence, Miles (October 21, 1993). Hurricane Jova Preliminary Report (Page One) (GIF) (Report). National Hurricane Center. Archived from the original on February 6, 2024. Retrieved February 6, 2024.
- ^ a b c d e f g h i j k l m n Lawrence, Miles (October 21, 1993). Hurricane Jova Preliminary Report (Page Three) (GIF) (Report). National Hurricane Center. Archived from the original on September 7, 2023. Retrieved February 3, 2024.
- ^ a b c d e f g Mayfield, Max (October 19, 1993). Hurricane Kenneth Preliminary Report (Page One) (GIF) (Report). National Hurricane Center. Archived from the original on February 6, 2024. Retrieved February 6, 2024.
- ^ a b c d e f g h i j k l m Mayfield, Max (October 19, 1993). Hurricane Kenneth Preliminary Report (Page Three) (GIF) (Report). National Hurricane Center. Archived from the original on September 7, 2023. Retrieved February 3, 2024.
- ^ a b c Pasch, Richard J. (November 28, 1993). Hurricane Lidia Preliminary Report (Page One) (GIF) (Report). National Hurricane Center. Archived from the original on February 6, 2024. Retrieved February 6, 2024.
- ^ a b c d e f g h i j k l Pasch, Richard J. (November 28, 1993). Hurricane Lidia Preliminary Report (Page Four) (GIF) (Report). National Hurricane Center. Archived from the original on September 7, 2023. Retrieved February 4, 2024.
- ^ a b c d Pasch, Richard J. (November 28, 1993). Hurricane Lidia Preliminary Report (Page Two) (GIF) (Report). National Hurricane Center. Archived from the original on February 6, 2024. Retrieved February 6, 2024.
- ^ a b c d Rappaport, Edward (September 29, 1993). Tropical Depression Fourteen-E Preliminary Report (Page One) (GIF) (Report). National Hurricane Center. Archived from the original on October 7, 2023. Retrieved February 4, 2024.
- ^ a b c d e Avila, Lixion A. (October 29, 1993). Tropical Storm Max Preliminary Report (Page One) (GIF) (Report). National Hurricane Center. Archived from the original on February 6, 2024. Retrieved February 6, 2024.
- ^ a b c d e f g Avila, Lixion A. (October 29, 1993). Tropical Storm Max Preliminary Report (Page Two) (GIF) (Report). National Hurricane Center. Archived from the original on February 4, 2024. Retrieved February 4, 2024.
- ^ a b c d Lawrence, Miles (October 21, 1993). Tropical Storm Norma Preliminary Report (Page One) (GIF) (Report). National Hurricane Center. Archived from the original on February 6, 2024. Retrieved February 6, 2024.
- ^ a b c d e Lawrence, Miles (October 21, 1993). Tropical Storm Norma Preliminary Report (Page Two) (GIF) (Report). National Hurricane Center. Archived from the original on February 4, 2024. Retrieved February 4, 2024.
- ^ a b c Mayfield, Max (October 16, 1993). Tropical Depression Seventeen-E Preliminary Report (GIF) (Report). National Hurricane Center. Archived from the original on January 4, 2022. Retrieved February 4, 2024.
External links
- The National Hurricane Center's storm wallet for 1993
Tropical cyclones of the
1993 Pacific hurricane season | ||
|---|---|---|
| ||