|
| This It is of interest to the following WikiProjects: | |||||||||||||||||||||||
| ||||||||||||||||||||||||


POPULATION GROWTH IS HOW FAST THE RATE OF THE PEOPLE IS GOING UP. IT IS VERY IMPORTANT BECAUSE THATS HOW OUR NUMBERS MULTIPLY AND HOW WE KEEP THE COUNT IF EVERYONE. — Preceding unsigned comment added by 198.174.52.14 ( talk) 22:55, 4 January 2006 (UTC)
Uh, aren't the rate of population growth and the population growth rate very different things? One is a derivative of the other, right? — Preceding unsigned comment added by 128.101.70.245 ( talk) 15:48, 20 January 2006 (UTC)
Future World Population
Maybe this article should include proposed answers to the following questions: How big will world population get? How will the transition from current rapid growth phase to a sustainable stable phase occur? Will this be an easy or difficult transition? -- Huysman talk| contribs 22:02, 4 June 2006 (UTC)
The citation request on this assertion: "It has been proposed by many that population growth, if not controlled, could lead to a situation where demands for resources outstrip their ready availability (i.e., overpopulation).[citation needed]"
is unneeded. It's completely obvious after a moment's thought. In fact, the original statement is too timid. If you have 500 people a day crowded around a well that can supply water for 200 people a day, you've got a problem. This is not a theory, it's simple common sense. So, rather than a citation, the article should be expanded to include a little basic logic about fruit-fly-type scenarios. — Preceding
unsigned comment added by
206.124.154.31 (
talk)
18:37, 27 August 2006 (UTC)
Hi, as an economist on development I may say common sense is not always the best way to proof a statement. I know it is hard to accept but the same happened to me some time ago. Just a couple of references for you and for those who want to think out of the 'imposed' box: 'The Ultimate Resource 2" by Julian Simon, 1996 ( ISBN 0-691-04269-1) and 'The Skeptical Environmentalist: Measuring the Real State of the World' by Bjørn Lomborg [there is an article in Wikipedia]. —Preceding unsigned comment added by 212.145.140.211 ( talk) 08:02, 13 September 2007 (UTC)
It is not common sense, but is a property of the math of exponential growth. The Wheat_and_chessboard_problem is a favorite example of how difficult it is to understand exponential growth. I do agree, though, that no citation is needed. It should be easy to see that at current growth rates the population will be unsustainable in a relatively short number of years (on almost any other human time scale). Gah4 ( talk) 21:19, 11 June 2008 (UTC)
I noticed "natural increase" redirects to this page. It should have its own page because it does not include migration. So really, a country's population growth and natural increase can be quite different, such as in Canada, where more of the population growth is actually from immigration. 69.158.163.223 20:50, 21 January 2007 (UTC)
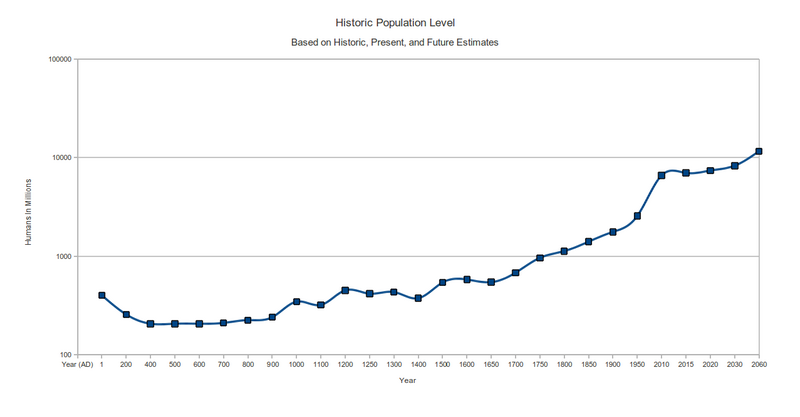
The first graph should be logarithmic. — Omegatron 21:25, 8 April 2007 (UTC)
- Now that the graph is logarithmic, I think it is a bad idea. (a) Common readers of wikipedia, including those such as high school students and even most adults, do not understand logarithmic graphics properly. (b) for most people this gives the impression of gradual and almost stable growth, whereas the non-logarithmic version would make such an impression impossible. Use of a logarithmic graph is almost a misleading use of the information in this case, such as would be used by those attempting to downplay the fact and affect of human population growth. -- GGG65 ( talk) 18:13, 12 August 2009 (UTC)
- I disagree that a logarithmic scale is inappropriate. I don't know where the old graph is now, but the differences in population growth in diffeent continents would be hard to discern in a non-log graph. Perhaps your concerncould be addressed better by simply swapping the position of the two graphs, placing the non-logarithmic graph first. That would convey the message of geometric growth. Will Beback talk 20:20, 12 August 2009 (UTC)
- It seems to be extremely difficult to really understand exponential growth. Anything that will help people understand it should be done. In the Dilbert comic strip some months ago, there was one where one of Dilbert's coworkers was going to a seminar where he would be told how to turn $100 into $1,000,000. At the seminar, he is told to invest the $100 at 10% interest for 97 years. I went to my calculator to check it out, and yes it works. (Now that banks are paying 1% if we are lucky.) I suppose having both graphs is best. People have to learn to use logarithmic graphs, and still understand the results of exponential growth. Gah4 ( talk) 20:53, 12 August 2009 (UTC)
- The use of a Logarithmic graph in this case is not merely extremely unhelpful, it is deceptive, and its placement at the top of the article seems to serve an intention to mislead. The shallow curve of the line creates an impression of gradual growth, whereas actual population growth in the period from 1950 to the present was unprecedentedly dramatic. Logarithmic graphs are useful and appropriate in technical analyses, in which one who is well-aquainted with a particular subject (a specialist) would presume an exponential increase in a set of statistics, Thus is most certainly not the case with an encyclopedia article on world population growth; The objective here is to represent the information on the subject in the clearest terms possible for the average person, If you feel thatthe role of Wikipedia is to popularise specialist terms in by using them in non-specialist articles, please take a look at What Wikipedia is not, specifically Wikipedia is not a manual, guidebook, textbook, or scientific journal. This graph should be removed, and replaced with a non-logarythmic one immediately.
WaynaQhapaq ( talk) 22:47, 18 November 2009 (UTC)
- Thinking about this again, a log graph isn't so useful. What would be useful is a graph of the growth constant, which is the derivative of the log graph. The use for a log graph is to identify exponential growth, but we already know that. The question left is how fast it is growing exponentially. Another possibility, though I don't think is as good, is a graph of doubling time, reciprocal of growth rate. This would be in addition to the non-log exponential growth graph. Gah4 ( talk) 00:29, 7 June 2019 (UTC)
The second graph ( http://upload.wikimedia.org/wikipedia/commons/thumb/4/44/Growth.png/800px-Growth.png) draws a "smoothed" line through the data. Though this may look nice, it misleads the reader in that it shows the population dropping between 2010 and 2015. Such a drop conflicts with later graphs that show always-positive growth rates during this time period. This graph should be redrawn with straight lines between data points or no lines at all. JDHeinzmann ( talk) 03:26, 27 October 2010 (UTC)
- I have removed that graph. The x-axis tic marks are not evenly-spaced in time. The y-axis values near 1 AD don't agree with the linear graph. Spiel496 ( talk) 18:44, 16 November 2010 (UTC)
The real question is, Where will population be in 50 or 100 years? The first plot shown gives us no idea what that will be. It shows everything running up along the right hand side of the plot and bunched up in the upper right corner. You need scales that will allow for orders of magnitude changes in the numbers, i.e., log-log scales. An exponential function will plot out as linear on a logarithmic scale. Virgil H. Soule ( talk) 22:35, 13 September 2013 (UTC)
"However, the world's fastest growing race are Hispanic/Latino origin, who make up 44% of the world's population growth per year..."
What exactly is the purpose of this statement? Considering that "race" itself is a dubious concept, and that "Hispanic/Latino race" a completely unrecognized one in serious scholarship, the statement seem to have been inserted by a US anti-immigrant nativist. I am removing it.
199.115.9.254 20:44, 10 April 2007 (UTC)
We supposedly ""Evolved"" around a 100 000 years ago ........... look at the graph and be logical . If we evolved 100 000 years ago our population would be absolutley ginormous . Working it back the human population has been growing only a few thousand years. Look at the graph or do the logarithmic calculations quickly (ok granted your calculations won't be perfect but they'll give you a ball park figure) Certianly doesn't look like a hundred thousand years to me. Rather supports a flood 4400 years ago. ( Paladin) — Preceding undated comment added 02:42, 15 April 2007 (UTC)
- ....I was under the impression that Wikipedia was NOT the place for religious debates. While I am Christian myself, this is most certainly NOT the place to say that one does not believe in evolution and force your beliefs on others. Besides, it's perfectly possible to be Christian and believe in evolution. Oh, and, no, the population would NOT be "absolutely ginormous". It is only in recent years that we have been able to lower the death rate from fairly common diseases and, for the most part, eliminate epidemics of life-threatening sicknesses, oh, and we've learned quite a bit about nutrition. And consider the lives that wars have taken, too. Stars in the Night Sky 19:15, 15 April 2007 (UTC)
- Hi , I was merley making a personal observation which as far as I understand im allowed to do (I wasn't under the impression that I have to believe in evolution to comment on wikipedia). Neither was I forcing my "beliefs" on anyone . As it happens im not even a "short day creationist" ! However looking at the evidence im beginning to lean that way . I also know you can be a Christian and believe in evolution , as I used to ! I used to go with theistic evolution however after looking at the arguments and looking at evolution I decided that it was fatally flawed, so I no longer believe in it . Also on the points you made the function is exponetial . Also I don't think they had such great sanitation or medical science 1000 years ago , however even looking at that graph, that is when it begins to rise rapidly. Granted it has sored in that last few years proably significantly because of the reasons you mentioned . However I feel the populaiton should atleast be significantly higher a long time before that point (its not even readable !) if homosapiens "emerged" 100 000 years ago (In my opinion). Look at rats etc. and how they multiply , we have a great advantage over them , in the fact that we are to perceive when we run out of food and space and can move. God bless you, Paladin 14:23, 17 April 2007 (UTC)
- Article talk pages exist solely to disuss the article, not the topic. If you guys would like to discuss this topic there are numerous forums, chat rooms, and other venues. - Will Beback · † · 18:13, 17 April 2007 (UTC)
"... Rather supports a flood 4400 years ago."
- I suppose so, but it is a big leap without any supporting evidence. A higher death rate in early populations would also account for the difference. There are many variables in the human growth curve to consider. Gah4 ( talk) 16:04, 3 May 2008 (UTC)
There isn't a single thing in here about the causes of population growth, or the effects. There is a very small piece on the causes and effects of the shrinking population in some areas, but not a thing about the causes and effects of actual population growth. There's nothing about how there's a theory that it's affecting global warming, or anything else. Stars in the Night Sky 19:15, 15 April 2007 (UTC)
- Well, population growth comes from people having too many kids. Global warming isn't really caused by population growth, but by out excessive use of natural resources. However, the only solution to global warming and running out of cheap energy sources is population control. Time for the world, especially the US, to work on slowing the growth rate. Gah4 ( talk) 10:35, 23 October 2008 (UTC)
- That's because there's currently no explanation for it, as far as I can tell. Wikipedia has a no-original-research policy, and so I can't say anything about it on the actual article; but, to answer your burning curiosity, it's a matter of economics, which I can only cover crudely in brief. If you look at the Green Revolution, you'll notice an increase in rice production from 2 tonnes per hectare to 6 tonnes per hectare. This means the same land can support more people; counter to the incorrect Land Value Tax theory, this is a matter of labor: the same or fewer people can support proportionally more people. Let's say your fertile land supports 1000 people with the work of 10, and the next chunk of land is rocky and has half the yield with twice the labor invested; if you add 1000 more people to your population, you need 40 of them--not 10--to work the rocky soil to make enough food. Keep scaling out like this and you get the root of scarcity: more labor needed to produce the necessary goods to meet demand, until every one laborer is producing less than the supply required to feed one laborer. As you pass the point of linear growth (2x as much production requires 2x as much labor), goods become expensive, and people become more poor, limiting population. This is, of course, well-past modern economic theory, and so should in no way be merged into any Wikipedia article. -- John Moser ( talk) 15:12, 18 September 2015 (UTC)
I think population growth was okay in the past, but now it seems to be turning out bad because if the population grows forever, we would all run out of room to survive. China itself is rather crowded, that's why the law says in China, you may only have one baby. 66.191.115.61 21:26, 14 August 2007 (UTC)Cbsteffen
how does the population have to do with the death rate or birth rate i just don't get it. —Preceding unsigned comment added by Willie92 ( talk • contribs) 01:32, 2 October 2007 (UTC)
the question is that if you implment such a law in say europe that already suffers from ethnic population decline while the thirdworld will brush it off , what will happen? the fact is india and the third world are responsible for most of the population growth since they can't reach transition and no one but people of such origin are responsible . china should make their one child policy softer as well since it will explode in their faces when people reach out of working age with no ss. 79.176.49.28 ( talk) —Preceding undated comment added 15:01, 1 April 2010 (UTC).
- The projection of under 9bn for 2050 is probably outdated because I have seen the projection of 10 billion for 2050, by some organisation in Washington.
- Consequences do not arise from population growth alone, but from the interaction between population growth and economic circumstance.
- Leaving environmental factors outside on this occasion, population growth that exceeds economic opportunities for the people who are in a particular area leads to idleness/unemployment, dissatisfaction, group formation and then the groups fight each other in the conflict over livelihoods, leading to internal wars and then wider wars between the allies of the various groups.
- It is not normally allowed to speak of excess population. However, in mathematical terms all those who cannot find work or another livelihood are idle excess population. The possibilities for adapting economic growth to population growth haven proven elusive, as the experience since the financial crisis of 2008 demonstrates. The interaction between population growth and the economy is only ever seen as numbers need to grow to take care of old people. But that these growing numbers need livelihoods and nobody has devised a successful strategy to create enough livelihoods, needs to be talked about more often, because population growth is not just a mathematical issue. 58.174.193.15 ( talk) 06:15, 11 September 2015 (UTC)
Existing sentence:
- When population growth can exceed the carrying capacity of an area or environment the results end with overpopulation.
It's not the growth that can exceed the carrying capacity, it's the population itself. I'm not sure how to edit it, though. — Arthur Rubin (talk) 22:45, 9 April 2008 (UTC)
- How about: Overpopulation is population exceeding carrying capacity. It may be caused by growth in population or by reduction in capacity. ·:· Will Beback ·:· 09:43, 10 April 2008 (UTC)
I added the word 'unit' to the first paragraph, but not (yet) to the equation. The equation as written is, in general, not correct. If the growth rate is measured as growth per year (as is usual), the time period in the equation given must be one year. Given: , and the population at two time points, and , , , and finally . For sufficiently small , the equation given near the top of the page is correct, but in general it is not. I am not ready to change it yet, anyone else want to comment? Gah4 ( talk) 21:43, 11 June 2008 (UTC)


The equation is non-sense as it is now:
- .

The dimension of (per capita) growth rate should have time in the denominator, as it is a rate. According to the equation, growth rate is dimensionless. Better is

OpenScience ( talk) 19:31, 19 January 2010 (UTC)
Yours is the first comment on the equation since I added the (for sufficiently small...).
I wanted to make it

and was waiting for someone else to comment on it. I thought it would come in days or weeks, though. Otherwise, I believe that in some sense the time period is implied, and so not stated, usually one year. Gah4 ( talk) 10:47, 13 May 2010 (UTC)
- The article mentions the calculations for growth rate and ratio, but never plugs in the current data. Apparently the growth ratio is about 1% per year. What are the long-term implications of such a growth rate? The article basically stops at the year 2050. While the rate beyond 2050 is not easy to accurately project, certain mathematical truths should be mentioned. For instance, with a 1% growth rate, the world population doubles every 70 years (from 100 x ln2). That means if the world population in 2010 is 8 billion, then in 2080 it would be 16 billion, and in 2150, it would be 32 billion. In 2220, it would be 64 billion. Obviously, the growth rate of 1% cannot be maintained for 200 more years, as the world population would be 8 times what it is today, and our resources are already seriously tapped. While we don't know what the population will be, we DO KNOW that the growth rate WILL HAVE TO drop to nearly zero within in the next 200 years.
- The world population graph done is SVG leaves a lot to be desired, for a couple of reasons: a) Aesthetically it is not very pleasing as charts go. It lacks good labels and color. b) The range of the last 12,000 years is not statistically significant. All the important information is in the last two thousand years ... growth before 0 BCE was minimal. Lumping all the data at the very end of the chart compresses it to the point where it is hard to extrapolate any accurate figure for any year in the last two thousand years. The graph should be modified to include a tear or torn edge at about 8000 BCE, then come back in with the data at around 2000 BCE. Aaron hoffmeyer ( talk) 22:52, 6 October 2008 (UTC)
Just responding to the notice about Tone or Style, as a person who googled for this specific topic, what I was looking for was "World population" and the estimates over the centuries. I think this article at the moment mentions "carrying capacity" / overpopulation too early; and this article should discuss theories on causes of population effect instead of "overpopulation" that already has its own article title. All best. :) 122.106.228.67 ( talk) 22:47, 1 January 2009 (UTC)
The formula makes no sense at all to me. Compare with this:

Am I wrong with this? If not, then the formula given in the article simply states that Population growth ratio is the same as its rate, which is certainly not the case. —Preceding unsigned comment added by 222.6.194.168 ( talk) 13:05, 20 November 2009 (UTC)
What do you think it should be? Did you notice the next paragraph which I wrote over a year ago? For a sufficiently small time period, or small growth rate, it is close enough. Yours is the first comment related to the formula since I added the (sufficiently small time period) modification, and the following paragraph. Gah4 ( talk) 05:19, 10 December 2009 (UTC)
The growth rate formula should be of the form . Also, as stated above by 222.6.194.168, the formula "growth ratio = 100%*growth rate" is meaningless to me. What is intended by this statement? Spiel496 ( talk) 07:01, 8 November 2010 (UTC)

- As I noted some years ago, but only added "for sufficiently small time period" to the equation, that is not correct. You really want: . In the limit it equals the formula you show, but not in general. As it seems that someone now removed my addition, I am close to changing the formula. Gah4 ( talk) 00:27, 27 September 2011 (UTC)


- The Red-Blue plot shows population growth rate to be a roughly linear function of time. How is this reflected in the growth rate formulas? What is the basis for the initial assumption that population growth is exponential? Virgil H. Soule ( talk) 22:54, 13 September 2013 (UTC)
Article tends to emphasizes the short term, which causes the "wealthy" countries to appear least responsible for population growth. Note that the U.S. Population Growth over last 100 years = 1.22% per year average or 336% total growth. The World Population Growth over last 100 years = 1.38 % per year average or 394% total. Not much of a difference. Despite what perpetual growth and religious people want to believe, we have a population problem nearly everywhere. 108.74.220.143 ( talk) 21:16, 3 January 2012 (UTC)
Hello, the book Introduction to Geography by Getis & Getis talks about population momentum. This article does not mention this momentum effect that increases population well into the future despite slowing of growth to the replacement level. This effect should be mentioned in the article, because without it people will think that decline to the replacement will be okay and all problems are solved. -- 212.226.66.147 ( talk) 07:52, 15 October 2012 (UTC)
In the table in the section "1960s to 2010 table of population growth" Australia's population is indicated "23,215,635[37] (2010)" - which is garbage. On the indicated source it is indicated per 26/03/2013, 12:00 hrs. it is indicated as 22,960,198. The maintainer of the table will please revise the issue. Thank you. 121.216.246.119 ( talk) 01:09, 26 March 2013 (UTC)
I am slowly beginning to understand what the author is trying to accomplish with the mathematical description. The question is: given a set of population data spanning a certain time period, how is Population Growth Rate or PGR computed? The first equation given is actually a simple difference equation based on the Malthusian exponential model of population growth.
The fundamental equation for Malthusian population change is given by , where is the population, , is the growth rate, and is time. This is a differential equation that can be solved by separating variables and integrating.


where is a constant tying the equation to a particular historical era.


An approximate value for is obtained by computing an incremental difference between two time points baased on the form of the original differential equation, i.e.,
- .

The validity of the approximation will depend on time increment between data points especially if is changing with time (as in the Red-Blue graph). The convoluted math in that initial section is wrong and should be deleted. If the logarithmic form is justified, it deserves a better exposition than is given. Virgil H. Soule ( talk) 00:35, 25 September 2013 (UTC)
From the Malthus Model:

At some arbitrary time point,

At another point nearby,

From this,
- .

The logarithmic form is therefore correct for small increments in time. Virgil H. Soule ( talk) 16:34, 3 October 2013 (UTC)
To account for the linear growth rate trend shown in the Red-Blue graph, the Malthus model must modified as follows:

Where is population, is time, is the population change rate at some reference time, , and is the slope of the rate curve. Integrating and applying limits:


Where is population at the reference time, .


Referring to the Red-Blue graph,


The time at which is


The maximum population will occur in 2010 + 70 or 2080 and
- maximum .

Virgil H. Soule ( talk) 17:30, 26 September 2013 (UTC)
Living matter remains remains fairly constant, I once read, but human population growth progressively transforms more and more of that into human flesh.t I don't know enough about the subject to do a proper search for a reference, much less if any other editor would think it pertinent. — Pawyilee ( talk) 10:31, 19 October 2013 (UTC)
"For example, since the US population was 2 million in 1927, and 5 million in 1987, the growth rate, using the above formula, is (5-2)/2, or 1.5." This sentence is in the article. But US population in 1927 was nearer 150 million, rather than 2 million. Shouldn't this blatant error be fixed?Doug1943 18:47, 6 May 2014 (UTC) — Preceding unsigned comment added by Doug1943 ( talk • contribs)
Regarding this revert: the content removed from the lede was non-neutrally presented and poorly sourced. Some of these issues are hopefully obvious, but one example is that lone source was the CIA factbook entry for Barbados cited for information on Chad. Regardless, the source makes no reference to the country's population change being itself noteworthy, or caused by anything noteworthy. It also does not use any scare-mongering or editorialize on vaguely Malthusian fears of "straining resources". Please do not restore this again.
Population growth is complicated, but if this specific "fear" somehow belongs in the lede of this article, instead of at human overpopulation where it logically belongs, it would need to be a neutral summary of specific, reliable sources, not WP:SYNTH based on context-free factoids. Grayfell ( talk) 07:48, 28 January 2020 (UTC)
- Nedelman, Michael (9 November 2018). "Fertility rates cut in half since 1950 -- but the population is still growing". CNN. Retrieved 2018-11-17.
Can we use this a citation in the article, rather than have it in external links?-- Buzles ( talk) 07:51, 23 December 2020 (UTC)
- "BBC News - Birth rate 'harms poverty goals'". Richard Black. BBC News.
Also this one. Can't it be used as a citation? -- Buzles ( talk) 07:54, 23 December 2020 (UTC)
![]() This article is or was the subject of a Wiki Education Foundation-supported course assignment. Further details are available
on the course page. Student editor(s):
JadenGordon1.
This article is or was the subject of a Wiki Education Foundation-supported course assignment. Further details are available
on the course page. Student editor(s):
JadenGordon1.
Above undated message substituted from Template:Dashboard.wikiedu.org assignment by PrimeBOT ( talk) 06:58, 17 January 2022 (UTC)
Population growth (annual %). World Bank says peak was 1971 instead 19.01.2022 Wikipedia´s UN Re. source 1968/69 & has more sources including United Nations Population Division. World Population Prospects: 2019 Revision 14:35, 19 January 2022 (UTC)
https://ourworldindata.org/grapher/population-growth-rates?tab=chart&time=1950..2030&country=~OWID_WRL ″Data published by United Nations, Department of Economic and Social Affairs, Population Division (2019). World Population Prospects: The 2019 Revision, DVD Edition.″ Link https://population.un.org/wpp2019/Download/Standard/Interpolated/
vs
https://data.worldbank.org/indicator/sp.pop.grow ″Population growth (annual %) Derived from total population. Population source: ( 1 ) United Nations Population Division. World Population Prospects: 2019 Revision, ( 2 ) Census reports and other statistical publications from national statistical offices, ( 3 ) Eurostat: Demographic Statistics, ( 4 ) United Nations Statistical Division. Population and Vital Statistics Report ( various years ), ( 5 ) U.S. Census Bureau: International Database, and ( 6 ) Secretariat of the Pacific Community: Statistics and Demography Programme.″ License : CC BY-4.0
Or is the UN 2019 Revision alone all of that and national sources being distracting noises because of the reasoning "a unitary, global organization can coordinate those data better"?
I assume the more legitimate sources the better for World Bank. Charles.enb.cdefgh ( talk)
Adding: Introduction shows "peak of 2.2% per year in 1963." [Roser, Max; Ritchie, Hannah; Ortiz-Ospina, Esteban (2013-05-09). "World Population Growth". Our World in Data.](Data sources: US Census Bureau & Projections: U. N. Pop. Divi. {Medium Variant 2015 Revision} & https://ourworldindata.org/world-population-growth#how-has-the-world-population-growth-rate-changed too even through theres´s a Population Division (2019). Why? Cren182 ( talk) 09:19, 04 April 2022 (UTC)
- C-Class vital articles
- Wikipedia level-5 vital articles
- Wikipedia vital articles in Biology and health sciences
- C-Class level-5 vital articles
- Wikipedia level-5 vital articles in Biology and health sciences
- C-Class vital articles in Biology and health sciences
- C-Class Ecology articles
- High-importance Ecology articles
- WikiProject Ecology articles
- C-Class Environment articles
- High-importance Environment articles
- Sustainability task force articles
|
| This It is of interest to the following WikiProjects: | |||||||||||||||||||||||
| ||||||||||||||||||||||||
POPULATION GROWTH IS HOW FAST THE RATE OF THE PEOPLE IS GOING UP. IT IS VERY IMPORTANT BECAUSE THATS HOW OUR NUMBERS MULTIPLY AND HOW WE KEEP THE COUNT IF EVERYONE. — Preceding unsigned comment added by 198.174.52.14 ( talk) 22:55, 4 January 2006 (UTC)
Uh, aren't the rate of population growth and the population growth rate very different things? One is a derivative of the other, right? — Preceding unsigned comment added by 128.101.70.245 ( talk) 15:48, 20 January 2006 (UTC)
Future World Population
Maybe this article should include proposed answers to the following questions: How big will world population get? How will the transition from current rapid growth phase to a sustainable stable phase occur? Will this be an easy or difficult transition? -- Huysman talk| contribs 22:02, 4 June 2006 (UTC)
The citation request on this assertion: "It has been proposed by many that population growth, if not controlled, could lead to a situation where demands for resources outstrip their ready availability (i.e., overpopulation).[citation needed]"
is unneeded. It's completely obvious after a moment's thought. In fact, the original statement is too timid. If you have 500 people a day crowded around a well that can supply water for 200 people a day, you've got a problem. This is not a theory, it's simple common sense. So, rather than a citation, the article should be expanded to include a little basic logic about fruit-fly-type scenarios. — Preceding
unsigned comment added by
206.124.154.31 (
talk)
18:37, 27 August 2006 (UTC)
Hi, as an economist on development I may say common sense is not always the best way to proof a statement. I know it is hard to accept but the same happened to me some time ago. Just a couple of references for you and for those who want to think out of the 'imposed' box: 'The Ultimate Resource 2" by Julian Simon, 1996 ( ISBN 0-691-04269-1) and 'The Skeptical Environmentalist: Measuring the Real State of the World' by Bjørn Lomborg [there is an article in Wikipedia]. —Preceding unsigned comment added by 212.145.140.211 ( talk) 08:02, 13 September 2007 (UTC)
It is not common sense, but is a property of the math of exponential growth. The Wheat_and_chessboard_problem is a favorite example of how difficult it is to understand exponential growth. I do agree, though, that no citation is needed. It should be easy to see that at current growth rates the population will be unsustainable in a relatively short number of years (on almost any other human time scale). Gah4 ( talk) 21:19, 11 June 2008 (UTC)
I noticed "natural increase" redirects to this page. It should have its own page because it does not include migration. So really, a country's population growth and natural increase can be quite different, such as in Canada, where more of the population growth is actually from immigration. 69.158.163.223 20:50, 21 January 2007 (UTC)
The first graph should be logarithmic. — Omegatron 21:25, 8 April 2007 (UTC)
- Now that the graph is logarithmic, I think it is a bad idea. (a) Common readers of wikipedia, including those such as high school students and even most adults, do not understand logarithmic graphics properly. (b) for most people this gives the impression of gradual and almost stable growth, whereas the non-logarithmic version would make such an impression impossible. Use of a logarithmic graph is almost a misleading use of the information in this case, such as would be used by those attempting to downplay the fact and affect of human population growth. -- GGG65 ( talk) 18:13, 12 August 2009 (UTC)
- I disagree that a logarithmic scale is inappropriate. I don't know where the old graph is now, but the differences in population growth in diffeent continents would be hard to discern in a non-log graph. Perhaps your concerncould be addressed better by simply swapping the position of the two graphs, placing the non-logarithmic graph first. That would convey the message of geometric growth. Will Beback talk 20:20, 12 August 2009 (UTC)
- It seems to be extremely difficult to really understand exponential growth. Anything that will help people understand it should be done. In the Dilbert comic strip some months ago, there was one where one of Dilbert's coworkers was going to a seminar where he would be told how to turn $100 into $1,000,000. At the seminar, he is told to invest the $100 at 10% interest for 97 years. I went to my calculator to check it out, and yes it works. (Now that banks are paying 1% if we are lucky.) I suppose having both graphs is best. People have to learn to use logarithmic graphs, and still understand the results of exponential growth. Gah4 ( talk) 20:53, 12 August 2009 (UTC)
- The use of a Logarithmic graph in this case is not merely extremely unhelpful, it is deceptive, and its placement at the top of the article seems to serve an intention to mislead. The shallow curve of the line creates an impression of gradual growth, whereas actual population growth in the period from 1950 to the present was unprecedentedly dramatic. Logarithmic graphs are useful and appropriate in technical analyses, in which one who is well-aquainted with a particular subject (a specialist) would presume an exponential increase in a set of statistics, Thus is most certainly not the case with an encyclopedia article on world population growth; The objective here is to represent the information on the subject in the clearest terms possible for the average person, If you feel thatthe role of Wikipedia is to popularise specialist terms in by using them in non-specialist articles, please take a look at What Wikipedia is not, specifically Wikipedia is not a manual, guidebook, textbook, or scientific journal. This graph should be removed, and replaced with a non-logarythmic one immediately.
WaynaQhapaq ( talk) 22:47, 18 November 2009 (UTC)
- Thinking about this again, a log graph isn't so useful. What would be useful is a graph of the growth constant, which is the derivative of the log graph. The use for a log graph is to identify exponential growth, but we already know that. The question left is how fast it is growing exponentially. Another possibility, though I don't think is as good, is a graph of doubling time, reciprocal of growth rate. This would be in addition to the non-log exponential growth graph. Gah4 ( talk) 00:29, 7 June 2019 (UTC)
The second graph ( http://upload.wikimedia.org/wikipedia/commons/thumb/4/44/Growth.png/800px-Growth.png) draws a "smoothed" line through the data. Though this may look nice, it misleads the reader in that it shows the population dropping between 2010 and 2015. Such a drop conflicts with later graphs that show always-positive growth rates during this time period. This graph should be redrawn with straight lines between data points or no lines at all. JDHeinzmann ( talk) 03:26, 27 October 2010 (UTC)
- I have removed that graph. The x-axis tic marks are not evenly-spaced in time. The y-axis values near 1 AD don't agree with the linear graph. Spiel496 ( talk) 18:44, 16 November 2010 (UTC)
The real question is, Where will population be in 50 or 100 years? The first plot shown gives us no idea what that will be. It shows everything running up along the right hand side of the plot and bunched up in the upper right corner. You need scales that will allow for orders of magnitude changes in the numbers, i.e., log-log scales. An exponential function will plot out as linear on a logarithmic scale. Virgil H. Soule ( talk) 22:35, 13 September 2013 (UTC)
"However, the world's fastest growing race are Hispanic/Latino origin, who make up 44% of the world's population growth per year..."
What exactly is the purpose of this statement? Considering that "race" itself is a dubious concept, and that "Hispanic/Latino race" a completely unrecognized one in serious scholarship, the statement seem to have been inserted by a US anti-immigrant nativist. I am removing it.
199.115.9.254 20:44, 10 April 2007 (UTC)
We supposedly ""Evolved"" around a 100 000 years ago ........... look at the graph and be logical . If we evolved 100 000 years ago our population would be absolutley ginormous . Working it back the human population has been growing only a few thousand years. Look at the graph or do the logarithmic calculations quickly (ok granted your calculations won't be perfect but they'll give you a ball park figure) Certianly doesn't look like a hundred thousand years to me. Rather supports a flood 4400 years ago. ( Paladin) — Preceding undated comment added 02:42, 15 April 2007 (UTC)
- ....I was under the impression that Wikipedia was NOT the place for religious debates. While I am Christian myself, this is most certainly NOT the place to say that one does not believe in evolution and force your beliefs on others. Besides, it's perfectly possible to be Christian and believe in evolution. Oh, and, no, the population would NOT be "absolutely ginormous". It is only in recent years that we have been able to lower the death rate from fairly common diseases and, for the most part, eliminate epidemics of life-threatening sicknesses, oh, and we've learned quite a bit about nutrition. And consider the lives that wars have taken, too. Stars in the Night Sky 19:15, 15 April 2007 (UTC)
- Hi , I was merley making a personal observation which as far as I understand im allowed to do (I wasn't under the impression that I have to believe in evolution to comment on wikipedia). Neither was I forcing my "beliefs" on anyone . As it happens im not even a "short day creationist" ! However looking at the evidence im beginning to lean that way . I also know you can be a Christian and believe in evolution , as I used to ! I used to go with theistic evolution however after looking at the arguments and looking at evolution I decided that it was fatally flawed, so I no longer believe in it . Also on the points you made the function is exponetial . Also I don't think they had such great sanitation or medical science 1000 years ago , however even looking at that graph, that is when it begins to rise rapidly. Granted it has sored in that last few years proably significantly because of the reasons you mentioned . However I feel the populaiton should atleast be significantly higher a long time before that point (its not even readable !) if homosapiens "emerged" 100 000 years ago (In my opinion). Look at rats etc. and how they multiply , we have a great advantage over them , in the fact that we are to perceive when we run out of food and space and can move. God bless you, Paladin 14:23, 17 April 2007 (UTC)
- Article talk pages exist solely to disuss the article, not the topic. If you guys would like to discuss this topic there are numerous forums, chat rooms, and other venues. - Will Beback · † · 18:13, 17 April 2007 (UTC)
"... Rather supports a flood 4400 years ago."
- I suppose so, but it is a big leap without any supporting evidence. A higher death rate in early populations would also account for the difference. There are many variables in the human growth curve to consider. Gah4 ( talk) 16:04, 3 May 2008 (UTC)
There isn't a single thing in here about the causes of population growth, or the effects. There is a very small piece on the causes and effects of the shrinking population in some areas, but not a thing about the causes and effects of actual population growth. There's nothing about how there's a theory that it's affecting global warming, or anything else. Stars in the Night Sky 19:15, 15 April 2007 (UTC)
- Well, population growth comes from people having too many kids. Global warming isn't really caused by population growth, but by out excessive use of natural resources. However, the only solution to global warming and running out of cheap energy sources is population control. Time for the world, especially the US, to work on slowing the growth rate. Gah4 ( talk) 10:35, 23 October 2008 (UTC)
- That's because there's currently no explanation for it, as far as I can tell. Wikipedia has a no-original-research policy, and so I can't say anything about it on the actual article; but, to answer your burning curiosity, it's a matter of economics, which I can only cover crudely in brief. If you look at the Green Revolution, you'll notice an increase in rice production from 2 tonnes per hectare to 6 tonnes per hectare. This means the same land can support more people; counter to the incorrect Land Value Tax theory, this is a matter of labor: the same or fewer people can support proportionally more people. Let's say your fertile land supports 1000 people with the work of 10, and the next chunk of land is rocky and has half the yield with twice the labor invested; if you add 1000 more people to your population, you need 40 of them--not 10--to work the rocky soil to make enough food. Keep scaling out like this and you get the root of scarcity: more labor needed to produce the necessary goods to meet demand, until every one laborer is producing less than the supply required to feed one laborer. As you pass the point of linear growth (2x as much production requires 2x as much labor), goods become expensive, and people become more poor, limiting population. This is, of course, well-past modern economic theory, and so should in no way be merged into any Wikipedia article. -- John Moser ( talk) 15:12, 18 September 2015 (UTC)
I think population growth was okay in the past, but now it seems to be turning out bad because if the population grows forever, we would all run out of room to survive. China itself is rather crowded, that's why the law says in China, you may only have one baby. 66.191.115.61 21:26, 14 August 2007 (UTC)Cbsteffen
how does the population have to do with the death rate or birth rate i just don't get it. —Preceding unsigned comment added by Willie92 ( talk • contribs) 01:32, 2 October 2007 (UTC)
the question is that if you implment such a law in say europe that already suffers from ethnic population decline while the thirdworld will brush it off , what will happen? the fact is india and the third world are responsible for most of the population growth since they can't reach transition and no one but people of such origin are responsible . china should make their one child policy softer as well since it will explode in their faces when people reach out of working age with no ss. 79.176.49.28 ( talk) —Preceding undated comment added 15:01, 1 April 2010 (UTC).
- The projection of under 9bn for 2050 is probably outdated because I have seen the projection of 10 billion for 2050, by some organisation in Washington.
- Consequences do not arise from population growth alone, but from the interaction between population growth and economic circumstance.
- Leaving environmental factors outside on this occasion, population growth that exceeds economic opportunities for the people who are in a particular area leads to idleness/unemployment, dissatisfaction, group formation and then the groups fight each other in the conflict over livelihoods, leading to internal wars and then wider wars between the allies of the various groups.
- It is not normally allowed to speak of excess population. However, in mathematical terms all those who cannot find work or another livelihood are idle excess population. The possibilities for adapting economic growth to population growth haven proven elusive, as the experience since the financial crisis of 2008 demonstrates. The interaction between population growth and the economy is only ever seen as numbers need to grow to take care of old people. But that these growing numbers need livelihoods and nobody has devised a successful strategy to create enough livelihoods, needs to be talked about more often, because population growth is not just a mathematical issue. 58.174.193.15 ( talk) 06:15, 11 September 2015 (UTC)
Existing sentence:
- When population growth can exceed the carrying capacity of an area or environment the results end with overpopulation.
It's not the growth that can exceed the carrying capacity, it's the population itself. I'm not sure how to edit it, though. — Arthur Rubin (talk) 22:45, 9 April 2008 (UTC)
- How about: Overpopulation is population exceeding carrying capacity. It may be caused by growth in population or by reduction in capacity. ·:· Will Beback ·:· 09:43, 10 April 2008 (UTC)
I added the word 'unit' to the first paragraph, but not (yet) to the equation. The equation as written is, in general, not correct. If the growth rate is measured as growth per year (as is usual), the time period in the equation given must be one year. Given: , and the population at two time points, and , , , and finally . For sufficiently small , the equation given near the top of the page is correct, but in general it is not. I am not ready to change it yet, anyone else want to comment? Gah4 ( talk) 21:43, 11 June 2008 (UTC)
The equation is non-sense as it is now:
- .
The dimension of (per capita) growth rate should have time in the denominator, as it is a rate. According to the equation, growth rate is dimensionless. Better is
OpenScience ( talk) 19:31, 19 January 2010 (UTC)
Yours is the first comment on the equation since I added the (for sufficiently small...).
I wanted to make it
and was waiting for someone else to comment on it. I thought it would come in days or weeks, though. Otherwise, I believe that in some sense the time period is implied, and so not stated, usually one year. Gah4 ( talk) 10:47, 13 May 2010 (UTC)
- The article mentions the calculations for growth rate and ratio, but never plugs in the current data. Apparently the growth ratio is about 1% per year. What are the long-term implications of such a growth rate? The article basically stops at the year 2050. While the rate beyond 2050 is not easy to accurately project, certain mathematical truths should be mentioned. For instance, with a 1% growth rate, the world population doubles every 70 years (from 100 x ln2). That means if the world population in 2010 is 8 billion, then in 2080 it would be 16 billion, and in 2150, it would be 32 billion. In 2220, it would be 64 billion. Obviously, the growth rate of 1% cannot be maintained for 200 more years, as the world population would be 8 times what it is today, and our resources are already seriously tapped. While we don't know what the population will be, we DO KNOW that the growth rate WILL HAVE TO drop to nearly zero within in the next 200 years.
- The world population graph done is SVG leaves a lot to be desired, for a couple of reasons: a) Aesthetically it is not very pleasing as charts go. It lacks good labels and color. b) The range of the last 12,000 years is not statistically significant. All the important information is in the last two thousand years ... growth before 0 BCE was minimal. Lumping all the data at the very end of the chart compresses it to the point where it is hard to extrapolate any accurate figure for any year in the last two thousand years. The graph should be modified to include a tear or torn edge at about 8000 BCE, then come back in with the data at around 2000 BCE. Aaron hoffmeyer ( talk) 22:52, 6 October 2008 (UTC)
Just responding to the notice about Tone or Style, as a person who googled for this specific topic, what I was looking for was "World population" and the estimates over the centuries. I think this article at the moment mentions "carrying capacity" / overpopulation too early; and this article should discuss theories on causes of population effect instead of "overpopulation" that already has its own article title. All best. :) 122.106.228.67 ( talk) 22:47, 1 January 2009 (UTC)
The formula makes no sense at all to me. Compare with this:
Am I wrong with this? If not, then the formula given in the article simply states that Population growth ratio is the same as its rate, which is certainly not the case. —Preceding unsigned comment added by 222.6.194.168 ( talk) 13:05, 20 November 2009 (UTC)
What do you think it should be? Did you notice the next paragraph which I wrote over a year ago? For a sufficiently small time period, or small growth rate, it is close enough. Yours is the first comment related to the formula since I added the (sufficiently small time period) modification, and the following paragraph. Gah4 ( talk) 05:19, 10 December 2009 (UTC)
The growth rate formula should be of the form . Also, as stated above by 222.6.194.168, the formula "growth ratio = 100%*growth rate" is meaningless to me. What is intended by this statement? Spiel496 ( talk) 07:01, 8 November 2010 (UTC)
- As I noted some years ago, but only added "for sufficiently small time period" to the equation, that is not correct. You really want: . In the limit it equals the formula you show, but not in general. As it seems that someone now removed my addition, I am close to changing the formula. Gah4 ( talk) 00:27, 27 September 2011 (UTC)
- The Red-Blue plot shows population growth rate to be a roughly linear function of time. How is this reflected in the growth rate formulas? What is the basis for the initial assumption that population growth is exponential? Virgil H. Soule ( talk) 22:54, 13 September 2013 (UTC)
Article tends to emphasizes the short term, which causes the "wealthy" countries to appear least responsible for population growth. Note that the U.S. Population Growth over last 100 years = 1.22% per year average or 336% total growth. The World Population Growth over last 100 years = 1.38 % per year average or 394% total. Not much of a difference. Despite what perpetual growth and religious people want to believe, we have a population problem nearly everywhere. 108.74.220.143 ( talk) 21:16, 3 January 2012 (UTC)
Hello, the book Introduction to Geography by Getis & Getis talks about population momentum. This article does not mention this momentum effect that increases population well into the future despite slowing of growth to the replacement level. This effect should be mentioned in the article, because without it people will think that decline to the replacement will be okay and all problems are solved. -- 212.226.66.147 ( talk) 07:52, 15 October 2012 (UTC)
In the table in the section "1960s to 2010 table of population growth" Australia's population is indicated "23,215,635[37] (2010)" - which is garbage. On the indicated source it is indicated per 26/03/2013, 12:00 hrs. it is indicated as 22,960,198. The maintainer of the table will please revise the issue. Thank you. 121.216.246.119 ( talk) 01:09, 26 March 2013 (UTC)
I am slowly beginning to understand what the author is trying to accomplish with the mathematical description. The question is: given a set of population data spanning a certain time period, how is Population Growth Rate or PGR computed? The first equation given is actually a simple difference equation based on the Malthusian exponential model of population growth.
The fundamental equation for Malthusian population change is given by , where is the population, , is the growth rate, and is time. This is a differential equation that can be solved by separating variables and integrating.
where is a constant tying the equation to a particular historical era.
An approximate value for is obtained by computing an incremental difference between two time points baased on the form of the original differential equation, i.e.,
- .
The validity of the approximation will depend on time increment between data points especially if is changing with time (as in the Red-Blue graph). The convoluted math in that initial section is wrong and should be deleted. If the logarithmic form is justified, it deserves a better exposition than is given. Virgil H. Soule ( talk) 00:35, 25 September 2013 (UTC)
From the Malthus Model:
At some arbitrary time point,
At another point nearby,
From this,
- .
The logarithmic form is therefore correct for small increments in time. Virgil H. Soule ( talk) 16:34, 3 October 2013 (UTC)
To account for the linear growth rate trend shown in the Red-Blue graph, the Malthus model must modified as follows:
Where is population, is time, is the population change rate at some reference time, , and is the slope of the rate curve. Integrating and applying limits:
Where is population at the reference time, .
Referring to the Red-Blue graph,
The time at which is
The maximum population will occur in 2010 + 70 or 2080 and
- maximum .
Virgil H. Soule ( talk) 17:30, 26 September 2013 (UTC)
Living matter remains remains fairly constant, I once read, but human population growth progressively transforms more and more of that into human flesh.t I don't know enough about the subject to do a proper search for a reference, much less if any other editor would think it pertinent. — Pawyilee ( talk) 10:31, 19 October 2013 (UTC)
"For example, since the US population was 2 million in 1927, and 5 million in 1987, the growth rate, using the above formula, is (5-2)/2, or 1.5." This sentence is in the article. But US population in 1927 was nearer 150 million, rather than 2 million. Shouldn't this blatant error be fixed?Doug1943 18:47, 6 May 2014 (UTC) — Preceding unsigned comment added by Doug1943 ( talk • contribs)
Regarding this revert: the content removed from the lede was non-neutrally presented and poorly sourced. Some of these issues are hopefully obvious, but one example is that lone source was the CIA factbook entry for Barbados cited for information on Chad. Regardless, the source makes no reference to the country's population change being itself noteworthy, or caused by anything noteworthy. It also does not use any scare-mongering or editorialize on vaguely Malthusian fears of "straining resources". Please do not restore this again.
Population growth is complicated, but if this specific "fear" somehow belongs in the lede of this article, instead of at human overpopulation where it logically belongs, it would need to be a neutral summary of specific, reliable sources, not WP:SYNTH based on context-free factoids. Grayfell ( talk) 07:48, 28 January 2020 (UTC)
- Nedelman, Michael (9 November 2018). "Fertility rates cut in half since 1950 -- but the population is still growing". CNN. Retrieved 2018-11-17.
Can we use this a citation in the article, rather than have it in external links?-- Buzles ( talk) 07:51, 23 December 2020 (UTC)
- "BBC News - Birth rate 'harms poverty goals'". Richard Black. BBC News.
Also this one. Can't it be used as a citation? -- Buzles ( talk) 07:54, 23 December 2020 (UTC)
![]() This article is or was the subject of a Wiki Education Foundation-supported course assignment. Further details are available
on the course page. Student editor(s):
JadenGordon1.
This article is or was the subject of a Wiki Education Foundation-supported course assignment. Further details are available
on the course page. Student editor(s):
JadenGordon1.
Above undated message substituted from Template:Dashboard.wikiedu.org assignment by PrimeBOT ( talk) 06:58, 17 January 2022 (UTC)
Population growth (annual %). World Bank says peak was 1971 instead 19.01.2022 Wikipedia´s UN Re. source 1968/69 & has more sources including United Nations Population Division. World Population Prospects: 2019 Revision 14:35, 19 January 2022 (UTC)
https://ourworldindata.org/grapher/population-growth-rates?tab=chart&time=1950..2030&country=~OWID_WRL ″Data published by United Nations, Department of Economic and Social Affairs, Population Division (2019). World Population Prospects: The 2019 Revision, DVD Edition.″ Link https://population.un.org/wpp2019/Download/Standard/Interpolated/
vs
https://data.worldbank.org/indicator/sp.pop.grow ″Population growth (annual %) Derived from total population. Population source: ( 1 ) United Nations Population Division. World Population Prospects: 2019 Revision, ( 2 ) Census reports and other statistical publications from national statistical offices, ( 3 ) Eurostat: Demographic Statistics, ( 4 ) United Nations Statistical Division. Population and Vital Statistics Report ( various years ), ( 5 ) U.S. Census Bureau: International Database, and ( 6 ) Secretariat of the Pacific Community: Statistics and Demography Programme.″ License : CC BY-4.0
Or is the UN 2019 Revision alone all of that and national sources being distracting noises because of the reasoning "a unitary, global organization can coordinate those data better"?
I assume the more legitimate sources the better for World Bank. Charles.enb.cdefgh ( talk)
Adding: Introduction shows "peak of 2.2% per year in 1963." [Roser, Max; Ritchie, Hannah; Ortiz-Ospina, Esteban (2013-05-09). "World Population Growth". Our World in Data.](Data sources: US Census Bureau & Projections: U. N. Pop. Divi. {Medium Variant 2015 Revision} & https://ourworldindata.org/world-population-growth#how-has-the-world-population-growth-rate-changed too even through theres´s a Population Division (2019). Why? Cren182 ( talk) 09:19, 04 April 2022 (UTC)
- C-Class vital articles
- Wikipedia level-5 vital articles
- Wikipedia vital articles in Biology and health sciences
- C-Class level-5 vital articles
- Wikipedia level-5 vital articles in Biology and health sciences
- C-Class vital articles in Biology and health sciences
- C-Class Ecology articles
- High-importance Ecology articles
- WikiProject Ecology articles
- C-Class Environment articles
- High-importance Environment articles
- Sustainability task force articles