| This article is rated List-class on Wikipedia's
content assessment scale. It is of interest to the following WikiProjects: | |||||||||||||||
| |||||||||||||||

There's no reason for the percentage shown to go up to 50% when no party breaks 30% support. Also, it's quite hard to see some of the lines on the chart, as the chart is quite zoomed out. Alex of Canada ( talk) 01:40, 8 January 2018 (UTC)
- http://www.pollofpolls.no/?cmd=Maling&gallupid=3459
- http://www.pollofpolls.no/?cmd=Maling&gallupid=3521
- http://www.pollofpolls.no/?cmd=Maling&gallupid=3614
Mélencron ( talk) 19:45, 2 October 2018 (UTC)
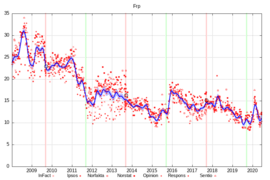
I've made a set of plots that cover the whole pollofpolls dataset from 2008 to the present. They're on Wikimedia Commons and are automatically regenerated every day by a bot. Here's what they look like:
-
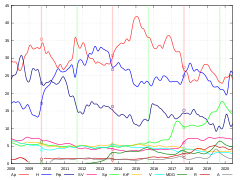 Monthly averages.
 -
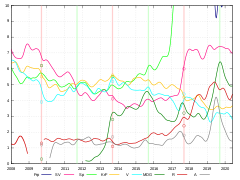 Monthly zoom on smaller parties.
 -
 All polls.
 -
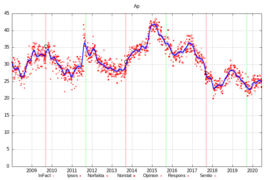 Ap by polling agency.
 -
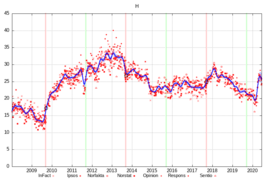 H by polling agency.
 -
 Frp by polling agency.
 -
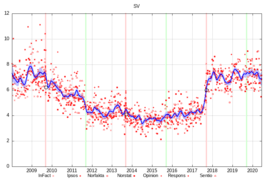 SV by polling agency.
 -
 Sp by polling agency.
 -
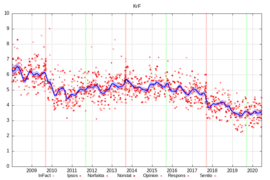 KrF by polling agency.
 -
 V by polling agency.
 -
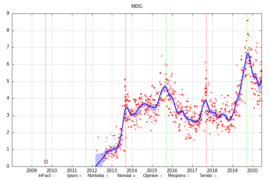 MDG by polling agency.
 -
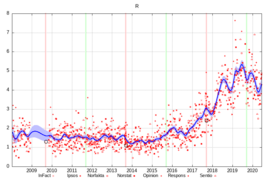 R by polling agency.
 -
 Others by polling agency.


The individual party plots use different symbols for each polling agency, which can be useful, as some polling agencies are outliers at times. The vertical red lines indicate parliamentary elections, while the vertical green lines indicate municipal elections. The solid curves are an approximating spline fit to the data, and the shared area around the curve represents the curve's uncertainty.
I think having these plots on wikipedia makes sense, but I'm not sure exactly which article to put them in. They would fit best in a general "Opinion polling for Norwegian parliamentary elections" article, but we don't have one that general, and I'm not sure if they cover too long a time period for articles on specific elections like this one. Amaurea ( talk) 19:29, 7 April 2019 (UTC)
Is it really necessary to have the total percentage of each block in every table? How real are these "blocks"? I'm not Norwegian but as far as I know, R and Sp wouldn't really go into a coalition. Likewise, FrP left the H-V-KrF coalition in the previous legislature. I'd be inclined to remove these columns. Thoughts? Spaastm ( talk) 22:32, 28 September 2021 (UTC)
- I tend to agree. Looking back, the blocks rarely fit with the composition of the governement coalitions nor, it seem, with the one to come. What's the point, then?--
Aréat (
talk)
22:56, 28 September 2021 (UTC)
- Aréat, I believe the idea of having blocks for Norwegian polls came from the fact that the Danish page has them, but as far as I know in Denmark the blocks are more clearly defined. If it were entirely up to me, I would delete the columns here. Shall we have a vote? Spaastm ( talk) 23:31, 2 October 2021 (UTC)
| This article is rated List-class on Wikipedia's
content assessment scale. It is of interest to the following WikiProjects: | |||||||||||||||
| |||||||||||||||
There's no reason for the percentage shown to go up to 50% when no party breaks 30% support. Also, it's quite hard to see some of the lines on the chart, as the chart is quite zoomed out. Alex of Canada ( talk) 01:40, 8 January 2018 (UTC)
- http://www.pollofpolls.no/?cmd=Maling&gallupid=3459
- http://www.pollofpolls.no/?cmd=Maling&gallupid=3521
- http://www.pollofpolls.no/?cmd=Maling&gallupid=3614
Mélencron ( talk) 19:45, 2 October 2018 (UTC)
I've made a set of plots that cover the whole pollofpolls dataset from 2008 to the present. They're on Wikimedia Commons and are automatically regenerated every day by a bot. Here's what they look like:
-
Monthly averages.
-
Monthly zoom on smaller parties.
-
All polls.
-
Ap by polling agency.
-
H by polling agency.
-
Frp by polling agency.
-
SV by polling agency.
-
Sp by polling agency.
-
KrF by polling agency.
-
V by polling agency.
-
MDG by polling agency.
-
R by polling agency.
-
Others by polling agency.
The individual party plots use different symbols for each polling agency, which can be useful, as some polling agencies are outliers at times. The vertical red lines indicate parliamentary elections, while the vertical green lines indicate municipal elections. The solid curves are an approximating spline fit to the data, and the shared area around the curve represents the curve's uncertainty.
I think having these plots on wikipedia makes sense, but I'm not sure exactly which article to put them in. They would fit best in a general "Opinion polling for Norwegian parliamentary elections" article, but we don't have one that general, and I'm not sure if they cover too long a time period for articles on specific elections like this one. Amaurea ( talk) 19:29, 7 April 2019 (UTC)
Is it really necessary to have the total percentage of each block in every table? How real are these "blocks"? I'm not Norwegian but as far as I know, R and Sp wouldn't really go into a coalition. Likewise, FrP left the H-V-KrF coalition in the previous legislature. I'd be inclined to remove these columns. Thoughts? Spaastm ( talk) 22:32, 28 September 2021 (UTC)
- I tend to agree. Looking back, the blocks rarely fit with the composition of the governement coalitions nor, it seem, with the one to come. What's the point, then?--
Aréat (
talk)
22:56, 28 September 2021 (UTC)
- Aréat, I believe the idea of having blocks for Norwegian polls came from the fact that the Danish page has them, but as far as I know in Denmark the blocks are more clearly defined. If it were entirely up to me, I would delete the columns here. Shall we have a vote? Spaastm ( talk) 23:31, 2 October 2021 (UTC)