| This is an archive of past discussions. Do not edit the contents of this page. If you wish to start a new discussion or revive an old one, please do so on the current talk page. |
| Archive 1 | Archive 2 | Archive 3 | Archive 4 |
Kurtosis Clarity
Is there a way to make clear that the kurtosis is 3 but the excess kurtosis (listed in table) is 0? Some readers may find this confusing, as it isn't explicitly labeled.
- Well, it looks clunky, but I changed it. PAR 01:48, 15 November 2006 (UTC)
huh?-summer
what? PAR 00:42, 14 December 2006 (UTC)
I am not a matemathician or a statistician but in fact I came to this discussion page exactly to understand this. Kurtosis is indicated as 3 in many other sources, including http://www.wolframalpha.com/input/?i=normal+distribution , and the 0 value in this page is confusing for me -- Mantees de Tara ( talk) 20:37, 25 December 2009 (UTC)
- Normal distribution has a kurtosis of 3, and an excess kurtosis of 0. The bar on the right is with "kurtosis: 0" is imprecise and potentially confusing imho. Mgunn ( talk) 01:10, 13 May 2010 (UTC)
- Many sources (including the Wikipedia) define the kurtosis as the ratio of fourth cumulant to the square of the second cumulant. This is the same as fourth central moment divided by the square of variance and minus three. Those sources do not use term “excess kurtosis” at all. The confusion would probably disappear if you follow the link “kurtosis” in the infobox to read what that term actually means. // stpasha » 02:56, 13 May 2010 (UTC)
A totally useless article for the majority of people
I consider myself a pretty smart guy. I have a career in IT management, a degree, and 3 technical certifications. Granted, I am certainly not brilliant, nor am I an expert in statistics. However, I was interested in learning about the normal curve. I have a only a fair understanding of standard deviation (compared with the average person who has no idea what SD is) but wanted to really "get it" and wanted to know why the normal curve is so fundamental. Basically, I wanted to learn. So I googled "normal curve". As always, Wiki comes up first. But sadly, as (not always, but usually), the article is hardly co-herent. This article to me was written by the PhD for the PhD. it is not condusive to learning...it is condusive to impressing. It reminds me of a graduate student trying to impress a professor "look Dr. Stat, look at my super complex work". This article has defeated the purpose of wiki to me, which is to educate people. Now I will go back to Google and search for another article on the normal curve that was written for the average person who wants to learn, rather than the stat grad. Wiki is chronic for this. Either articles are meant as a politically biased rant (so much bias here), or written for a "niche" community (like this article). But so few of them are actually written to introduce, explain, and heighten learning. I read 2 paragraphs of this article, and that was more than enough. You might think I'm just too stupid to understand, and thats fine. But when I make contributions to articles that are about internet protocols and networking, I make sure that the layperson is kept in mind. This was not done here. What is so hard...seriously...about just introducing a topic and providing a nice explanation for people who do not have statistical degrees?—The preceding unsigned comment was added by 24.18.108.5 ( talk) 19:57, 1 May 2007 (UTC).
- I completely agree with you! The normal distribution is a simple concept. The current editors have completely destroyed the article by trying to present it as complex as possible! If you want to understand the normal distribution forget the wikipedia article and read my next three sentence. The normal distribution is the outcome distribution of a random process. For example the number of heads that you get when you toss a random coin many times. 1) toss a random coin 10 times 2) write down the number of heads 3) repeat the previous two steps 100 times 4) plot the number of heads for the 100 trials. The End !!-- 92.41.17.172 ( talk) 13:29, 28 August 2008 (UTC)
- I think it was written to be understood by people who do not already know what the normal distribution is, and it succeeds in being comprehensible to mathematicians who don't know what the normal distribution is, and also to anyone who's had undergraduate mathematics and does not know what the normal distribution is.
- Granted, some material at the beginning could be made comprehensible to a broader audience, but why do those who write complaints like this always go so very far beyond what they can reasonably complain about, saying that it can be understood only by PhD's or only by people who already know the material?
- And why do they always make these abusive suggestions about the motives of the aauthors of the article, saying it was intended to IMPRESS people, when an intention to impress people would (as in the present case) clearly have been written so differently?
- I am happy to listen to suggestions that articles should be made comprehensible to a broader audience, if those suggestions are written politely (instead) and stick to that topic instead of these condescending abusive paranoid rants about the motives of the authors. Michael Hardy 01:00, 2 May 2007 (UTC)
- Another reply.
- I agree with you that many mathematics articles do not do a good enough job of keeping things simple. Sometimes I even think that people go out of their way to make things complicated. So, I empathize with you.
- My advice to you is that after you do your research, ir would really be awesome if you came here and shared with us some paragraphs that really made you "get it". The best person to improve an article that "is written by PhDs" is you! One thing to keep in mind though is that an encyclopaedia has to function as a reference first and foremost. It's not really a tutorial, which is what you're looking for. Maybe in a few years the wikibooks on statistics will be better developed. As a reference, I think this page works well. (For example, suppose that you want to add two normal distributions, then the formula is right there for you.)
- Perhaps if you're struggling with the introduction, it occurred to me that you might not know what a probability distribution is in the first place. You might want to go to probability theory or probability distribution to get the basics first. One of the nice things about wikipedia is that information is separated into pages, but it means that you have to click around to familiarize with the background as it's not included in the main articles. MisterSheik 01:15, 2 May 2007 (UTC)
MisterSheik, do you have ANY evidence for your suspicion that anyone has ever gone out of their way to make things complicated? Can you point to ONE instance?
I've seen complaints like this on talk pages before. Often they say something to the general effect that:
- The article ought to be written in such a way as to be comprehensible to high-school students and is written in such a way that only those who've had advance undergraduate courses can understand it.
Often they are right to say that. And in most cases I'd sympathize if they stopped there. But all too often they don't stop there and they go on to attribute evil motives to the authors of the article. They say:
- The article is written to be understood ONLY by those who ALREADY know the materials;
- The authors are just trying to IMPRESS people with what they know rather than to communicate.
Should I continue to sympathize when they say things like that? Can't they suggest improvements in the article, or even say there are vast amounts of material missing from the article that should be there in order to broaden the potential audience, without ALSO saying the reason those improvements haven't been made already is that those who have contributed to the article must have evil motives? Michael Hardy 01:51, 2 May 2007 (UTC)
Hi Michael. I think that the user's complaint was definitely worded rudely, and so I understand your indignation. It's not like he's paying for some service, but he's looking for information and then complaining that it isn't tailored for him. So, rudeness aside.
I'm going to go through some pages, and you can tell me what you think. (Apologies in advance to the contributors of this work.) Look at this version of mixture model: [1]. Two meanings? They're the same meaning.
But, what about this? [2] versus now pointwise mutual information.
There's a lot of this wordiness going on as well: [3], [4]], [5], [6], [7], [8] and [9].
And equations for their own sake: [10] and [11] (looks like useful information at first, but it's just an expansion of conditional entropy.)
Maybe all of the examples aren't perfect, but some are indefensible.
I like to see things explained succinctly, but making the material instructional instead of a making it function as a good reference is a bad idea, I think. And that's one of the things I told the person: find the wikibook.
But I still haven't answered your point about
- The article is written to be understood ONLY by those who ALREADY know the materials;
- The authors are just trying to IMPRESS people with what they know rather than to communicate.
Maybe it's not happening intentionally, or even consciously, but how do people produce some of the examples above without first snapping into some kind of mode where they are trying to speak "like a professor does"?
MisterSheik 03:33, 2 May 2007 (UTC)
- I'm afraid I don't understand your point. You've shown examples of articles that are either incomplete or in some cases inefficiently expressed, but how is any of this even the least bit relevant to the questions you were addressing? I said I'd seen it claimed that some articles are written to be understood only by those who already know the material; you have not cited anything that looks like an example. I said I'd seen it claimed that some articles were written as if the author was trying to impress someone. Your examples don't look like that. You say "maybe it's not happening intentionally", but you seem to act as if the articles you cite are places where it's happening. I don't see it. What in the world do you mean by speaking like a professor, unless that means speaking in a way intended to convey information? Are you suggesting that professors typically speak in a manner intended simply to impress people? Or that professors speak in a manner that communicates only to those who already know the material? Maybe you can mention some such cases, but you're actually acting as if that's typical.
- Could you please try to answer the questions I asked? Do you know any cases of Wikipedia articles where the author deliberately tried to make things complicated? You said you did. Can you cite ONE? Michael Hardy 21:57, 3 May 2007 (UTC)
-
- PS: In mixture models: No, they're not the same thing. Both involve "mixtures", i.e. weighted averages, but they're not the same thing. Michael Hardy 21:57, 3 May 2007 (UTC)
Hi Michael, it's fine to say that these ideas are inefficiently expressed, but why are they inefficiently expressed? I think it's because writers are subconsciously aiming to make things difficult in order to achieve a certain tone: the one that they associate with "a professor". In other words, I think that people are imagining a target tone rather than directly trying to convey information succinctly. ps they are both examples of a "mixture model", which has one definition ;) MisterSheik 23:00, 3 May 2007 (UTC)
- Well I think it's because they just haven't worked on the article enough. If you're going to make claims about their subconscious motivations, you have a heavy burden of proof, and you haven't carried it, so I'm not convinced, to say the least. Are you going to make assertions about what you believe, or are you going to try to convince me? And is that relevant to this article? Is there anything in this article that looks as if someone's trying to make things difficult for the reader, consciously or otherwise? It looks as if it's not written for an audience of intelligent high-school students, and possibly that could be changed with more work, but it is written for mathematicians and others who don't know what the normal distribution is. And you speak of what they associate with "a professor". You know what you associate with a professor; how would you know what others associate with a professor? The simple fact is, it's harder to write for high-school students than for professionals. Don't you know that? It takes more work, and the additional work has not been done, yet. Are you saying people did not do that additional work because they're trying (subconsciously, maybe?) to make things difficult for the reader? What makes you think that? Be specific. When people try to feign sounding like a professor, they typically misuse words in ways that look stupid to those who actually know the material. "An angry Martin Luther nailed 95 theocrats to a church door." That sort of thing. Using words in the wrong way and unintentionally sounding childish. That's not happening in this article. It's also not happening in the ones you cited. Some parts of those are clumsily written; some parts are hard to understand because there's not enough explanation there. This article is generally well-written, and that would be impossible if someone were trying to fake sounding like a professor.
- You're shooting your mouth off a lot, telling us about people's subconscious motivations, as if we're supposed to think you know about those, and it's really not proper to do that unless you're going to at least attempt to give us some reason to think you're right about this. Michael Hardy 23:45, 3 May 2007 (UTC)
Whoa. I'm not "shooting my mouth off". I made it really clear that it was my impression that sometimes I think that authors make things difficult to understand. How is that "improper". I'm just sharing my opinions about the motivations of authors unknown. No one is attacking you. I don't have a "heavy burden of proof", because they're just my opinions and you're entitled to disagree. I showed you some examples of what convinced me and asked you what you thought. Ask yourself if you're getting a bit too worked up over nothing here?
(On the other hand, when you use rhetoric like "Don't you know that?", I can't see that you're kidding, and so it sounds like you are shooting your mouth off.)
Regarding this article, I think its fine. I guess the "overview" section could be renamed "importance" since it's not an overview at all. And, the material could be reorganized a little bit since occurrence and importance have similar information, but maybe not.
You make a really good point about people feigning sounding like a professor, and we have both seen that kind of thing. That's not what I meant though. I was trying to get at professionals or academics who know the material going out of their way to word things awkwardly. Let's take one example: "A typical examplar is the following:" Are we supposed to believe that someone actually uses that kind of language day-to-day? Someone is trying to impress the reader with his vocabulary, or achieve an air of formality, or what? Whatever it is, it's bad writing that, due to its unnaturalness, seems intentional (to me). I'm not saying someone is intentionally trying to trip up the reader. I'm saying that someone is trying to achieve something other than inform the reader in the most succinct way. I was trying to illustrate with my examples "undue care" for the presentation of information. MisterSheik 00:12, 4 May 2007 (UTC)
- I didn't think you were attacking me, but I did think you were asking me to believe something far-fetched without giving reasons. If you're talking about wordiness, I think it often takes longer to express things more simply. Michael Hardy 00:21, 4 May 2007 (UTC)
- yeh i agree this is excessively far too technichal for those who have no or little understanding. I've worked in Quality assurance for 12 years and used normal distributions alot and don't see much mention of six sigma, cp, cpk, ppm, USL, UWL, LSL, LWL, inter quartile ranges, gauge R&R etc etc this article does appear geared towards mathematic graduates and not very useful to many using it in the "real world". I did learn quite a bit of the maths while achieving my green belt in six sigma, but once putting it in practice don't really need to know alot of it and alot of this article has gone straight over my head lol. In the real world theres plenty of software that will automatically calculate the data for you and produce the graphs providing you understand the correct inputs and variables ie Minitab. More and more in the manufacturing industry these stats are not only used by quality engineers like myself but general operators are expected to understand what a curve should be looking like, std dev/mean targets, good/bad cpk levels etc i'm talking people with little or no qualifications. this article will be of no use whatsoever to them imho.
Basically a normal distribution is a curve which shows the distribution of data for something measurable. You will have a target mean (average) to aim for to ensure your distribution is maintained within the tolerance levels (LSL/USL) and have warning levels (LWL/UWL) which indicate when the process is going out of control and action needs to be taken to bring it back in control, limiting any rejects outside the LSL/USL (OK that bit is control charts rather than normal distribution but still related). Cp is a measure of the process variation about the mean (the higher the better towards 3), with cpk a measure of the process variation about a target mean. A Cp of 2 would be ok, but if the mean of the data is 20 when the target mean is 40 then thats not so good as it shows you have a controllable process but its all out of spec likely due to some incorrect setting. PPM part per million indicating how parts you are producing out of spec per million parts produced. —Preceding unsigned comment added by 77.102.17.0 ( talk) 01:00, 5 December 2009 (UTC)
Very important topic
{{
Technical}}
Lead to article is excellent, and the first few sections are readable, but topic is essential to a basic understanding of many fields of study and therefore a special effort should be made to improve the accessibility of the remaining sections. 69.140.159.215 ( talk) 13:00, 12 January 2008 (UTC)
- Do the remaining sections need to be more accessible? I think they are largely technical or esoteric in nature so most people dont actually need to be able to understand them. If it is required then I would argue that further education in maths is required rather than making the sections more accessible.
- I think accessibility needs to be compared to clarity. If they are clear (albeit to a university educated individual) then it is sufficient. schroding79 ( talk) 00:30, 25 June 2008 (UTC)
An Easy Way to Help Make Article More Comprehensible
Correct me if i am wrong but an easy way to make it easier for people highchool through Ph.D level would be to leave as is but work though easy examples in the beginning. —Preceding unsigned comment added by 69.145.154.29 ( talk) 23:29, 10 May 2008 (UTC)
I was never comfortable calling this distribution a "normal" distribution, too much baggage comes with the word "normal". However, what I think what might help more people get a handle on this probability distribution, is to try and describe how the word "normal" got associated with it. Fortran ( talk) 01:39, 6 April 2009 (UTC)
Along time since i learnt the history but think "normal" refers to the actual shape, as the bell shape for a normal collection of data will be a nice even bell shape curve, aka normal. Whereas if its skewed in some way due to some unknown variable then you are not achieving the target of a normal distribution curve? —Preceding unsigned comment added by 77.102.17.0 ( talk) 01:22, 5 December 2009 (UTC)
The Normal distribution is called the "Normal" distribution because several hundred years ago many people who were studying distributions noticed that in a large number of cases, the distributions looked similar. Thus if the distribution looked like most others, it was called "Normal." What Fortran is saying is that we now know the reason why many distributions all looked "Normal" (the Central Limit Theorem), and discussing how sampling and the CLT can lead to having a Normal distribution can be enlightening. —Preceding unsigned comment added by 141.211.66.134 ( talk) 16:33, 10 March 2010 (UTC)
Progress towards GA quality
Given the suggestion on the edit descriptions list that this article might be pushed towards GA status, it would be good if readers/editors would set down some areas for improvement. Any more suggestions as to what is needed? Melcombe ( talk) 09:10, 22 September 2009 (UTC)
(above comment split to allow addition of general discussion of changes needed for article) Melcombe ( talk) 08:58, 25 September 2009 (UTC)
Pictures
Graphs should be improved too — the curves should be more thicker so that they are better visible; and also the labels violate MOS, as certain numbers are typeset in italics.
 Done. …
stpasha »
21:23, 5 October 2009 (UTC)
Done. …
stpasha »
21:23, 5 October 2009 (UTC)
Short sections
No section should consist of just a single test — they should be either expanded, or merged with some other sections.
- Done I merged all short sections with similar topics. …
stpasha »
21:23, 5 October 2009 (UTC)
Too technical
The "too technical" tag shown on this talk page, but which might be missed; Melcombe 09:10, 22 September 2009 (UTC)
- The {{technical}} tag was placed by
User:Velho on 10th of August, 2008.
Back then the article indeed looked a little bit more technical. So it may be appropriate to remove the tag now (or maybe not) …
stpasha »
16:35, 22 September 2009 (UTC)
- Done. The article now has formula-free lead section, and easy-going introduction section; so I have removed the {{technical}} tag. The rest of the article is of course quite mathematical, but the math is unavoidable. …
stpasha »
19:16, 3 October 2009 (UTC)
Heights of US adult males
I removed the following paragraph from the lead, since the lead is already too long, and it'll be expanded even more to include references to multivariate normal and complex normal distributions, and Gaussian stochastic processes.
The normal distribution can be used to describe, at least approximately, any variable that tends to cluster around the mean. For example, the heights of adult males in the United States are roughly normally distributed, with a mean of about 70 inches. Most men have a height close to the mean, though a small number of outliers have a height significantly above or below the mean. A histogram of male heights will appear similar to a bell curve, with the correspondence becoming closer if more data are used.
The example can still be used somewhere later in the article, although we don’t have a conceivable “introduction” section before we go into hard math. … stpasha » 21:35, 23 September 2009 (UTC)
- It should obviously be put back. there is no need to include references to multivariate normal and complex normal distributions, and Gaussian stochastic processes in the lead.
Melcombe (
talk)
14:41, 24 September 2009 (UTC)
- Not obvious to me though. The
WP:LEAD states that the lead should generally be no longer than 3−4 paragraphs. Also the article is titled “Normal distribution”, not “Univariate normal distribution”. Since it focuses mainly on the scalar case, it must provide clear directions as to where to find the information on multivariate Gaussian distribution, since it is not obvious. In general use, the term “normal distribution” is not restricted to univariate case, for example we say that a vector is distributed normally with 0 mean and variance matrix σ²In, we don’t say it’s distributed “multivariate normally”. Some authors even generalize normal distribution to ∞-dimensional Hilbert spaces, this definition could be reflected at least somewhere, maybe in the “multivariate” article. …
stpasha »
18:09, 24 September 2009 (UTC)
- Removing the only generally understandable material from the lead on the ground that there is no room for it is unhelpful to the purpose of WP. The lead is meant to be generally understandable. The maths clearly needed to be split off, and I have done so. Generalisations and connected topics can be dealt with in 3 ways: in the main article text, in the "see also" section or in specific template that would appear at the very head of the article.
Melcombe (
talk)
09:04, 25 September 2009 (UTC)
- Done. alright so the paragraph is restored, and disambiguation hatnote established. As there are no further objections, I'm closing this subdiscussion. …
stpasha »
21:07, 5 October 2009 (UTC)
- Removing the only generally understandable material from the lead on the ground that there is no room for it is unhelpful to the purpose of WP. The lead is meant to be generally understandable. The maths clearly needed to be split off, and I have done so. Generalisations and connected topics can be dealt with in 3 ways: in the main article text, in the "see also" section or in specific template that would appear at the very head of the article.
Melcombe (
talk)
09:04, 25 September 2009 (UTC)
- Not obvious to me though. The
WP:LEAD states that the lead should generally be no longer than 3−4 paragraphs. Also the article is titled “Normal distribution”, not “Univariate normal distribution”. Since it focuses mainly on the scalar case, it must provide clear directions as to where to find the information on multivariate Gaussian distribution, since it is not obvious. In general use, the term “normal distribution” is not restricted to univariate case, for example we say that a vector is distributed normally with 0 mean and variance matrix σ²In, we don’t say it’s distributed “multivariate normally”. Some authors even generalize normal distribution to ∞-dimensional Hilbert spaces, this definition could be reflected at least somewhere, maybe in the “multivariate” article. …
stpasha »
18:09, 24 September 2009 (UTC)
- It should obviously be put back. there is no need to include references to multivariate normal and complex normal distributions, and Gaussian stochastic processes in the lead.
Melcombe (
talk)
14:41, 24 September 2009 (UTC)
Exponential function
I think we should use only one notation for the exponential function. As you know, there is exp(x) and e^x. I skimmed through the article and found that exp(x) is more common. Tomeasy T C 06:51, 25 September 2009 (UTC)
- In mathematics ex is a standard notation, whereas exp(x) is an accepted substitute in cases when the expression x is itself complicated. Exponential functions with other bases, such as 2x or 10x do not have analogous “inline” notation. This is why primary notation for exponent function should remain ex. However there is no reason why we cannot intermix different notations in the same article, it is not a violation of MoS, and mathematicians do that all the time. … stpasha » 22:49, 25 September 2009 (UTC)
- Done. I have replaced all the occurences of exp(…) with the shorter e… notation. …
stpasha »
21:03, 5 October 2009 (UTC)
repeated pictures
The two images shown in the infobox are repeated further down. I think we should remove them. Any thoughts? Tomeasy T C 22:33, 25 September 2009 (UTC)
- They should probably appear at least once. The sections on the pdf and the cdf seem like appropriate places for them.
Michael Hardy (
talk)
22:38, 25 September 2009 (UTC)
- Of course, they should appear once, but not twice. Tomeasy T C 22:55, 25 September 2009 (UTC)
- Done. …
stpasha »
20:06, 27 September 2009 (UTC)
Probability density function
This subsection is largely a repetition of the section Definition. I would like to include the additional content of the subsection into the section, and remove the subsection. What do you think? Tomeasy T C 22:36, 25 September 2009 (UTC)
- Both sections should remain. We want to introduce the topic slowly before descending into hard math. Section “definition” is intended to describe the normal distribution in easy terms, whereas “probability density function” can be more complicated. It is also possible that we will include into “definition” section something about the cdf, although that is not very easy to do while maintaining the goal of keeping this section as simple as possible. … stpasha » 20:05, 27 September 2009 (UTC)
- Done. both sections remain, although now they have distinctly different content. …
stpasha »
19:51, 3 October 2009 (UTC)
Purpose of the constant (1/sqr(2pi))
The article states the formula for a normal curve is as follows: But what is the origin/purpose of the constant: ? Might be useful to include that info. -- Steerpike ( talk) 20:32, 26 September 2009 (UTC)


- Done. …
stpasha »
19:59, 27 September 2009 (UTC)
Should History section come before Definition?
I think it should. For example because it has less formulas in it :) … stpasha » 21:08, 27 September 2009 (UTC)
- Done. …
stpasha »
16:45, 2 October 2009 (UTC)
Complex normal
- There has been a suggestion during previous peer-review that info about complex Gaussian r.v. was included here. Although I'm not sure what a complex Gaussian is… if (X,Y) are jointly normal then we can say that Z=X+iY is complex Gaussian, but then the variance of such random variable is a 3-component quantity, so I'm not sure how it is supposed to be described in the language of complex variables? Well if anybody knows a good book on this topic, let me know.
- ...
stpasha »
talk »
16:35, 22 September 2009 (UTC)
- As in the article, the usual definition of complex normal has X,Y independent and equal variance. The book by Brillinger BR (1975) Time Series: Data Analysis ang Theory, Holt Rinehart & Winston ISBN 0-03-076975-2 .. has a very brief section on the complex multivariate normal distribution. The reason for dealing with this special case relates to Fourier analyses of time series. The variance of a complex rv is defined via a product of conjugates and so is real. You might see also [12] for some that is online and in sophisticated maths. An online search leads to at least one paper that deals with the unrestricted case but it is not publically accessible. Melcombe ( talk) 17:13, 22 September 2009 (UTC)
- I've checked this Andersen et al. book, and they indeed define complex normal distribution as symmetric one. However I feel that such definition is not entirely adequate, since it does not give rise to the Central limit theorem for complex r.v's. In particular, if {zt} are zero-mean complex random variables, then we would like to say that the sum T−1/2∑zt converges in distribution to a complex normal distribution; in this case the limiting distribution need not be symmetric if E[Re[z]Im[z]]≠0.
- There is a paper by van der Bos (1995) “The multivariate complex normal distribution — a generalization”, and then also another article by Picinbono (1996) which consider a generic form of complex normal distribution. However this all probably merits its own separate article
Complex normal distribution, just as we have separate
Multivariate normal distribution already. ...
stpasha »
16:57, 23 September 2009 (UTC)
- It doesn't matter what you think is adequate. The fact is that all the literature takes "complex normal distribution" (when not given general some form of "generalised" tag) to mean the equal-variance, uncorrelated normal case and articles here are meant to reflect that. In addition, moving away from the standard usage would conflict with the need to define the complex Wishart distribution in the standard way for that. Melcombe ( talk) 14:41, 24 September 2009 (UTC)
- The theory of complex Gaussian distribution was developed by Goodman (1963), and he defines “A complex Gaussian random variable is a complex random variable whose real and imaginary parts are bivariate Gaussian distributed.” Later on he admits that “In the present paper the phrase ‘multivariate complex Gaussian distribution’ is restricted to that special case”, and proceeds to describe the circular Gaussian because it is easier and can be expressed in terms of Wishart distribution.
- Van den Bos (1995) however writes: “Since its introduction, the multivariate complex normal distribution employed in the literature has been a special case: the covariance matrix associated with it satisfies the number of restrictions … The reason given in [Wooding 1956] for these restrictions is closely connected with the particular application studied. … These developments have probably convinced later authors that this specialized complex normal distribution is the most general one.”
- The article on complex normal distribution must reflect both the restricted circular distribution, and the unrestricted generic case. … stpasha » 18:09, 24 September 2009 (UTC)
- Again, it doesn't matter that various people have said various things. If the general usage is to use a term in a particular way, WP needs to reflect that. It doesn't matter what you think is mathematically nice. Melcombe ( talk) 09:11, 25 September 2009 (UTC)
- This is quite heated debate over a non-existent (yet) article :) Now I'm obviously not an expert on the subject, having learned about the topic only a couple of days ago, but it seems to me that since we are writing an encyclopedia then we have to present both points of view and both definitions. The alternative would be to make two distinct articles “ circular complex gaussian distribution” and “ general complex gaussian distribution”, which eventually someone will merge anyways. … stpasha » 22:57, 25 September 2009 (UTC)
- Done. The subsection has been moved out to the
Complex normal distribution article. …
stpasha »
20:35, 13 October 2009 (UTC)
Notation suggestion
I propose to uniformly replace symbol φ (the pdf of the standard normal distribution) with ϕ (in LaTeX: \phi, in HTML: ϕ). The main reason for this change is to differentiate somehow standard normal distributions from characteristic functions, which are also denoted with φ. … stpasha » 21:35, 7 October 2009 (UTC)
- Done. Since there seems to be no objections, I'm going to perform this change. …
stpasha »
20:27, 11 October 2009 (UTC)
Estimation
This section in the article seems to be too biased towards the unbiasedness of estimation. At the same time it misses some important info about the t-statistic and construction of confidence intervals. Also the “maximum likelihood estimation” section is bloated — the detailed derivation is already present in the maximum likelihood article and probably doesn’t need to be repeated here. … stpasha » 02:07, 29 November 2009 (UTC)
- Done. …
stpasha »
09:11, 3 December 2009 (UTC)
History section
The history section could be expanded. For once, it doesn't mention the important contributions of Maxwell, when he discovered that gas particles, being constantly subjected to bombardment from the other gas particles, will have their velocities distributed as 3d multivariate Gaussian rv's. I believe this discovery to be important because it demonstrated that normal distribution occurs not only as a mathematical approximation in games of chance or as a convenient tool in least squares analysis, but also exists in nature. … stpasha » 21:52, 5 October 2009 (UTC)
- Done. //
stpasha »
04:49, 5 March 2010 (UTC)
sum of ... factors ?
any variable that is the sum of a large number of independent factors
A sum of factors?? Am I getting this very wrong, or is this sentence indeed ill phrased. I would say a sum of summands or a product of factors, but still I would not really understand what this sentence tries to say. Please someone who understands the content, judge whether the wording sum of ... factors is correct. Tomeasy T C 22:25, 25 September 2009 (UTC)
- "Factor" is the wrong word; I've changed it to "terms". Michael Hardy ( talk) 22:36, 25 September 2009 (UTC)
- Thanks that solves the first issue I had with this sentence. Now it says:
- any variable that is the sum of a large number of independent terms is likely to be normally distributed.
- I find the combination of the words any and likely highly illogical. If it is just likely, then how can it be for any variable? Tomeasy T C 08:33, 26 September 2009 (UTC)
OK, I see the logical flaw has been erased by somebody. Now that semantically the statement is correct, let's focus on the content. Any variable that is the sum of a large number of independent terms is distributed approximately normally. Really, is that so? I would guess most variables are not distributed at all, because they depend on independent but deterministic terms. I see that variable is linked to random variable. The qualifier random is key here to ensure the statement is not ridiculous. Therefore, the text must show this. Tomeasy T C 07:06, 2 October 2009 (UTC)
- Yeah, there is also the fact that it is a misinterpretation of the CLT which regards the mean, not the entire distribution. O18 ( talk) 16:03, 2 October 2009 (UTC)
- The CLT pertains either to the mean or to the sum. Trivially if either of those is normally distributed then so is the other. How do you find something about "the entire distribution" (whatever that means) in the statement that the sum is normally distributed? Michael Hardy ( talk) 21:02, 8 October 2009 (UTC)
- Moreover, the qualifier random needs to be applied to the terms that are summed up, rather than the sum (i.e., the variable that was introduced previously without being needed). i made the corresponding change. Tomeasy T C 20:30, 2 October 2009 (UTC)
Yes, sum of factors. The word “factor” here should be understood as “An element or cause that contributes to a result (from Latin facere: one who acts)” (Collins). Of course it is so much unfortunate that this can be confused with the mathematical “factor” which is one of the terms in a product...
Another problem is the following: a typical layperson does not see the world in terms of random variables. For an everyman, the phenomenon is recognized as “random” if it recurs often and has pronouncedly different results each time: such as weather, or lottery, or coin tosses, etc. Other things such as heights or IQs aren’t really seen as “random” unless you force them to stop and think about it. For this reason, writing “any random variable which is the sum of independent terms” does not convey the important message: that this is not an abstract mathematical theorem but rather an approximation for great many random things encountered in the real life.
We can try the following: By the central limit theorem, any quantity which results from an influence of a large number (at least 10–15) of independent factors, will have approximately normal distribution. … stpasha » 21:02, 5 October 2009 (UTC)
- That makes sense to me. I would slightly reformulate: By the central limit theorem, any quantity that is influenced by a large number (at least 10–15) of independent factors, will have approximately normal distribution.. Note that the last half sentence is still grammatically wrong. Unfortunately, I cannot resolve this issue. Tomeasy T C 20:10, 8 October 2009 (UTC)
Standard normal: merger?
Currently there is a separate article standard normal random variable (stub), whereas standard normal distribution redirects to the current article. I suggest that the first article be merged with the current, probably within the “Standardizing normal random variables” subsection. … stpasha » 10:12, 9 October 2009 (UTC)
- Done. //
stpasha »
23:57, 8 March 2010 (UTC)
Tests of normality
Some action is needed for the redlinks shown under "tests of normality" ... either creating new articles, expanding existing ones that can be linked to, or providing direct citations; Melcombe 09:10, 22 September 2009 (UTC)
- Done. //
stpasha »
05:54, 19 March 2010 (UTC)
See also
There seems a need to reduce the number of articles under "see also", preferably by saying something about them in the main text (if not already there}; Melcombe 09:10, 22 September 2009 (UTC)
- External links should be trimmed down to a bare minimum, as per
WP:EL. ...
stpasha
16:35, 22 September 2009 (UTC)
- Done. External links were removed, and "see also" section shortened to only three entries. //
stpasha »
20:55, 21 March 2010 (UTC)
References
More inline citations, restructuring of notes/references to more convenient form. I guess most detailed results will be findable in Johnson&Kotz so perhaps we could aim to provide page or section numbered pointers to this source. Melcombe 09:10, 22 September 2009 (UTC)
- Johnson&Kotz turned out to be pretty useless, mainly talking about the numerical approximations and which laws are derived from normal. Also their formula for entropy is wrong. We need to find some other reference, preferably the one which actually derives the results. // stpasha » 19:42, 20 May 2010 (UTC)
Kurtosis again
The use of the field "kurtosis" in the table seems not to be consistent across distributions. In some it seems to be the "normal" kurtosis and in some the excess kurtosis (-3). This is really problematic. I think it should either be named "excess kurtosis" in the table, or there should be two fields, one for each. Personally, I think one field should enough, and probably it should be the excess kurtosis, since this is usually more useful. However, it should be made clear, at least to people changing the page, that this is the excess kurtosis and not the other. If there is just one field, which is named "kurtosis" there will always be some who think, its the normal one and change it (see e.g. for the lognormal distribution, change from 21:13, 1 December 2009). Maybe it would be enough to change the template, so that it says "excess_kurtosis=..." instead of "kurtosis=...". Any other thoughts on this? Ezander ( talk) 15:45, 22 February 2010 (UTC)
- Excess kurtosis definitely seems more useful. It has a nice additivity property: The excess kurtosis of i.i.d. random variables with equal variances is just the sum of their separate excess kurtoses. Michael Hardy ( talk) 18:50, 22 February 2010 (UTC)
Financial variables
There is a discussion on the WikiProject Statistics talk page about the financial variables section of this article. Regardless of the merits of the recent additions, and whether they are OR, the issues raised are more about difficulties with estimating the marginal distribution of a dependent, non-stationary sequence, and less about normality per se. This content is too detailed and not sufficiently relevant to be included here. Skbkekas ( talk) 16:26, 15 March 2010 (UTC)
- The content was removed from the article several days ago. // stpasha » 20:57, 21 March 2010 (UTC)
by W.J.Youden
| “ |
THE NORMAL LAW OF ERROR STANDS OUT IN THE EXPERIENCE OF MANKIND AS ONE OF THE BROADEST GENERALIZATIONS OF NATURAL PHILOSOPHY ♦ IT SERVES AS THE GUIDING INSTRUMENT IN RESEARCHES IN THE PHYSICAL AND SOCIAL SCIENCES AND IN MEDICINE AGRICULTURE AND ENGINEERING ♦ IT IS AN INDISPENSABLE TOOL FOR THE ANALYSIS AND THE INTERPRETATION OF THE BASIC DATA OBTAINED BY OBSERVATION AND EXPERIMENT ♦ |
” |
// stpasha » 23:58, 21 March 2010 (UTC)
Scores
This article says:
-
- Many scores are derived from the normal distribution, including percentile ranks ("percentiles" or "quantiles"), normal curve equivalents, stanines, z-scores, and T-scores. Additionally, a number of behavioral statistical procedures are based on the assumption that scores are normally distributed; for example, t-tests and ANOVAs (see below). Bell curve grading assigns relative grades based on a normal distribution of scores.
In what sense can it be said that z-scores and percentiles "are derived from the normal distribution"? Michael Hardy ( talk) 16:16, 27 April 2010 (UTC)
- I believe it has something to do with the “laws” such that three sigma rule or six sigma rule, which are used by practitioners regardless of whether the underlying distribution is normal or not (most often this distribution is simply unknown). But you're right, this entire section is rather strange; maybe it should be moved to the applications... // stpasha » 01:15, 28 April 2010 (UTC)
Notation
The article presently has "Commonly the letter N is written in calligraphic font (typed as \mathcal{N} in LaTeX)." without a citation. All the sources I have use a non-script font and I have never seen it in a script font: it is certainly not common. WP:MSM says " it is good to use standard notation if you can" so why use something unnecessarily complicated, particulrly as there is no citation for this notation. Melcombe ( talk) 13:49, 18 May 2010 (UTC)
- Among those books that I currently have, the ones using the script N are:
- Le Cam, L., Lo Yang, G. (2000) Asymptotics in statistics: some basic concepts, 2nd ed. New York: Springer-Verlag.
- Ibragimov I.A., Has’minskii, R.Z. (1981) Statistical estimation: asymptotic theory. New York: Springer-Verlag.
- Other books use: either Normal(μ, σ²), or n(μ, σ²), or N(μ, σ²). // stpasha » 16:55, 18 May 2010 (UTC)
generating a gaussian dataset
I would like to generate a set of numbers (x,y) with a known mean and CV; that is, I wish to generate a set of numbers that have a gaussian distribution, where I can set the mean and CV in advance. Thanks PS: maybe it doesn't go here, but a section on curve fitting software might help (please - no"r", if you know R, you already know a lot; stuff like IgorPro or Kaleidagraph etc, or excel thanks —Preceding unsigned comment added by 108.7.0.214 ( talk) 17:34, 22 June 2010 (UTC)
- You might want to look at multivariate normal and then learn R ;) 018 ( talk) 18:03, 22 June 2010 (UTC)
OK, let's start by assuming the covariance matrix is

so that ρ is the correlation. To be continued.... Michael Hardy ( talk) 18:23, 22 June 2010 (UTC)
- ...before I go on, let me request a clarification. When you take a large random sample from a distribution with mean μ, then on average the mean of the sample will be μ, but each time you take a large random sample, the mean differs somewhat from exactly μ. Is that what you want to do or do you want the sample average to be exactly the specified value? And similarly for the variances and correlation? I can give you an algorithm for either of those. Michael Hardy ( talk) 18:57, 22 June 2010 (UTC)
- By 'CV', do you mean coefficient of variation, or covariance? If you mean coefficient of variation, do you want x and y to be correlated, or not? Qwfp ( talk) 19:22, 22 June 2010 (UTC)
Normal distribution entropy.
By definition the entropy of the Normal distribution is not negative value. But what if σ → 0 in the finite formula of entropy? Thanks. Aleksey. —Preceding unsigned comment added by Kharevsky ( talk • contribs) 08:06, 5 July 2010 (UTC)
bell curve
this article, under Definition, and the one on Gaussian function contain conflicting information on the meaning of constants a and c for the "bell curve."
— Preceding unsigned comment added by 68.37.143.246 ( talk) 01:52, 7 July 2010 (UTC)
Implementation section
Isn't this section a little much of a "how to" for Wikipedia? 018 ( talk) 17:22, 9 July 2010 (UTC)
Great, comprehensive page on the normal distribution, almost perfect. However, the detailed section on 'Gaussian' random number generators (which is also extremely informative) really does not belong in this top-level entry. —Preceding unsigned comment added by 129.125.178.72 ( talk) 16:04, 3 August 2010 (UTC)
Product of Gaussians
I was missing a reference to the product of two gaussians. This could also go into the page for the gaussian function (there is a short mention of it, no mentioning of the resulting properties), but is is also relevant here. —Preceding unsigned comment added by 134.102.219.52 ( talk) 12:34, 7 September 2010 (UTC)
Gaussian Distribution is not necessarily normal?
In the opening sentence the article states that the normal distribution is also known as a Gaussian distribution. I would argue however that the normal distribution is a special case of the Gaussian distribution, i.e. one that has an integral of 1, hence why it is called normal. The Gaussian distribution is in my opinion any general distribution described by the Gaussian function
If there aren't any objections I will edit the article to reflect this schroding79 ( talk) 00:08, 25 June 2008 (UTC)
- Huh? For something to be a probability distribution, it has to integrate to 1. As far as I am familiar, the common usage of the Gaussian distribution refers to it as a probability distribution. This also seems to be the definition used in the top few google searches I did for gaussian distribution. I concede that it possible that 'gaussian distribution' can be used in broader contexts (while the normal may not?), but I don't think this is the normal (ahem) way it is understood. So the opening sentence should remain, though a note (or footnote?) might be added later on, if you can find a good reference to back it up.-- Fangz ( talk) 00:37, 25 June 2008 (UTC)
Yes, the gaussian distribution is normal in shape. The standard normal distribution integrates to 1, whereas a frequency distribution which is normal or gaussian in shape does not necessarily integrate to 1. One aspect of interest to readers which is missing from the Wiki page about the Normal Distribution is the relationship between frequency distributions and probability distributions. Perhaps an introductory paragraph linking to Wiki pages about frequency distributions would be a good idea. It would help put this article into context. Lindy Louise ( talk) 09:58, 29 September 2010 (UTC)
- There is no such thing as “Gaussian distribution is normal in shape”, the gaussian and the normal are just two synonymous names for the same distribution. A frequency distribution is merely a histogram of the random variable, it also always integrates to one. // stpasha » 17:38, 29 September 2010 (UTC)
I disagree and am curious to know why you think a frequency distribution "also always integrates to one". A frequency distribution does not always integrate to one. A probability distribution always integrates to one. This is why we normalise the normal distribution to get the standard normal distribution: the standard normal distribution integrates to one and therefore can be used as a probability distribution. This is basic stuff but is often omitted from the more esoteric textbooks. Lindy Louise ( talk) 13:18, 30 September 2010 (UTC)
- Lindy Louise, you are right that a frequency plot sums/integrates to N (the number of units), but any and all probability distributions sums/integrates to one. This is not a special property of the standard normal. The integral of probability distribution over any range shows the probability that a random value drawn from the population will take on that value. If the integral (over all possible values) were anything other than one, the probability of drawing something when you drew something would be less or greater than one. 018 ( talk) 15:13, 30 September 2010 (UTC)
- The article frequency distribution explicitly defines this in a way that does not add to 1, but rather to the sample size. Thus frequency distribution and "probability distribution" are different. However, both "normal distribution" and "Gaussian distribution" are, in the univariate context anyway, used with identical meanings, and either can said to represent either the probability distributions or the frequency distributions of observed data, where in the latter case there is naturally a scaling by the sample size in the interpretation of "represent". Melcombe ( talk) 16:16, 30 September 2010 (UTC)
I never said the standard normal distribution was the only probability distribution that integrated to one -- obviously any probability distribution function integrates to one. Neither did I say that gaussian and normal distributions are different. I agree with Melcombe. Lindy Louise ( talk) 17:16, 30 September 2010 (UTC)
- I'm confused by your meaning then when you write, "This is why we normalise the normal distribution to get the standard normal distribution: the standard normal distribution integrates to one and therefore can be used as a probability distribution." But maybe it doesn't matter. Did you want to update the opening paragraph/article? If so, how do you want to update it? 018 ( talk) 18:51, 30 September 2010 (UTC)
Thanks O18 for your comment. I think I'm guilty of being too verbose, but I believe some readers confuse Normal Distribution with Standard Normal Distribution and I wanted to make the distinction. What I should have said is the Normal Distribution cannot be used directly as a Probability Distribution because the area under the Normal curve isn't equal to one. So we deliberately make the area under the Normal curve equal to one by doing some fancy maths: this normal distribution with an area of one is called the Standard Normal Distribution. It can then be used as a Probability Distribution simply because the area is equal to one. (In any probability system the sum of all the probabilities must equal one or, in other words, the area under a proability curve is equal to one.) Still verbose, sorry! Maybe I should have a go at updating the opening paragraph; I'll think about it. I was going to insert a link to Wiki pages about probability distributions and probability density functions but they're too difficult for non-mathematicians to understand, so I haven't. Lindy Louise ( talk) 21:29, 30 September 2010 (UTC)
- Well, I just reread the frequency distribution article, and it says that the table of frequency distributions contains either frequencies or counts of occurrences. Also if you check the frequency article, it says there are absolute and there are relative frequencies. So whether or not the frequency distribution “integrates” to one or to n is your own choice. Also, Lindy, check the definition section: standard normal is a normal distribution with mean zero and variance one. If you want to make a distinction, then the topic you are most likely looking for is called the Gaussian function. Cheers! // stpasha » 05:38, 1 October 2010 (UTC)
If you integrate an absolute-frequency distribution you will not necessarily get unity for your answer. In fact I would think it a freak event if it were to happen! The only way you can be sure of obtaining unity by integration is if you use relative frequencies or probabilities. Hence the need for the Standard Normal Distribution, because we can be sure its integral is unity. The fact that the mean and variance of the Standard Normal Distribution are 0 and 1 is a consequence of the "normalisation" or "standardisation". The mean and variance of a Normal Distribution are not 0 and 1. That's one way of distinguishing between Normal and Standard Normal. Thanks for pointing me in the direction of the Gaussian function, but I am very familiar with the gaussian and normal functions (they're the same). Lindy Louise ( talk) 21:10, 10 December 2011 (UTC)
Error in Fisher Information
Calculating out by hand, the Fisher Information in the top right box seems incorrect and should instead be Khosra ( talk) 21:33, 9 September 2010 (UTC)

- I suggest you redo your calculations. Note that the “Estimation of parameters” section gives that , and — under the efficient estimation, the variance matrix of the parameter must be equal to the inverse of the Fisher information matrix. // stpasha » 08:06, 11 September 2010 (UTC)


- Thanks for the correction. I mistakenly computed rather than . Khosra ( talk) 06:55, 20 September 2010 (UTC)


About the lead
There used to be the time when the article started with “In probability theory, normal distribution is a continuous probability distribution which is often used to describe, at least approximately, any variable that tends to cluster around the mean”. Some people tend to revert the intro back to this sentence from time to time, which is why I think an explanation is due why such sentence is inappropriate in an encyclopedia.
First it must be stated that the distribution is not merely continuous, but absolutely continuous. Absolute continuity implies that the distribution possesses density, whereas simple continuity means very little. Second, about the “any variable that tends to cluster around the mean”. This is not an informative statement. Any unimodal distribution can be said to “cluster around the mean”, and some non-unimodal distributions too. This statement is so loose that it fails to describe anything. Finally, “is often used to describe, at least approximately” is a weasel-phrase. No serious researcher will use normal distribution to describe his data, unless he has good reasons to believe that the data IS actually normally distributed. There is a good quote from Fisher about this, see the Occurrence section. // stpasha » 09:23, 2 October 2010 (UTC)
- When I put that statement there, I had no idea that it had a history of being there. It's just that the former phrase, which I see someone has reverted, is just utterly, absolutely horrible:
- In probability theory and statistics, the normal distribution, or Gaussian distribution, is an absolutely continuous probability distribution whose cumulants of all orders above two are zero.
- Keep in mind, Stpasha, that this sentence may sound fine to you, an expert in statistics, but to the average reader, it simply makes no sense. It is characteristic of a nasty trend in so many technical articles on Wikipedia, which is that they are written by experts for experts. The number of experts in any field is miniscule compared to the number of non-experts, and in any case, an expert in statistics is not likely to go reading the Wikipedia article on the normal distribution to figure out what it is. Imagine if you are an average non-expert, who might conceivably have some idea of what a probability distribution is, but maybe not, and certainly not much more -- reading this sentence you're going to think "What the hell? What does 'absolutely continuous' mean? What are 'cumulants'?" If you read the link to absolutely continuous, it makes no sense to a non-expert. Likewise for cumulants. The lead sentence is an introduction that is supposed to tell the average non-expert what a topic is about. My old lead sentence read essentially “In probability theory, the normal distribution is a continuous probability distribution which is often used to describe, at least approximately, any real-valued random variable that tends to cluster around the mean”. (Note, I added "real valued" and "random".) It tells you
- This is a continuous distribution, used to describe a real number (as opposed to a discrete distribution, a multi-variate distribution, etc.).
- This is a very common distribution, often used as a first approximation in statistics to describe any single-peaked distribution (as opposed e.g. to a multi-peaked distribution).
- Both of these facts may seem so obvious to you as not to even merit mentioning, but they are exactly what a non-expert doesn't know but needs to know. I am not opposed to other formulations of these two facts, but any lead must mention these basic facts. If you disagree with the second fact as I've stated it, figure out some other way to express it that satisfies you, but don't take it out. As for your comment about "no serious researcher ...":
- Beware of the " no true Scotsman" fallacy.
- It doesn't address the essential point, which is "as a first approximation". Plenty of statistical techniques use the normal distribution as an approximation. MCMC often uses a Gaussian as a proposal distribution. Laplace approximation approximates a posterior distribution with a Gaussian centered around the mode. Etc.
- Cumulants and absolute continuity are both advanced topics that are irrelevant to the vast majority of users and hence simply do not belong in the lead. (Note that your average college-level intro statistics course doesn't even mention either of these topics.) As for your comment about "continuous" being meaningless, I respectfully must disagree -- in common (non-expert) statistical parlance, "continuous" is the opposite of "discrete" and means that a distribution is defined by a density function as opposed to a probability mass function. This means quite a lot. If you want to state that the distribution is absolutely continuous, or has no non-zero cumulants except the first two, or any other statement that pleases experts but has no meaning to non-experts, fine -- but not in the lead. Benwing ( talk) 22:21, 2 October 2010 (UTC)
BTW, Stpasha, you might want to check out the pages WP:TECHNICAL and Wikipedia:Lead section#Introductory text, which provide guidelines on how technical articles, and particularly the lead sections, should be written. Benwing ( talk) 23:01, 2 October 2010 (UTC)
- I agree strongly with Benwing. This is one of the top hits in stats and the lead says, "go away--we don't want you, this article is just for mathematicians." I really can't make any sense of stpasha's comments about continuity vs absolute continuity. Remember, when you write something, it is to communicate something to someone else. Do you seriously believe that there exists a person who (a) understands the distinction, and (b) doesn't know that the normal is absolutely continuous? Obviously, this fact belongs way, way down in the article. 018 ( talk) 00:12, 3 October 2010 (UTC)
- I do understand that the cumulants are hard to digest, but it is the only possible way to actually define the distribution without using formulas. In most textbooks they would simply state that a normal distribution is the one with the following pdf:, and provide a formula. When you say that normal distribution “is the distribution that is often used to describe ...”, then this sentence is merely a description, not a definition. It’s like if you were writing an article about tomatoes, you’d start it with “Tomatoes are fruits that are red in color.” There are some guidelines about what the first sentence should look like, see WP:LEAD#First sentence, in particular the “If the subject is amenable to definition ...” part.
- I agree that an average reader will probably not understand what these cumulants are about. But at least the reader will know that there is something here that he doesn't understand. If you write the first sentence the way you do, then the reader will simply learn that normal distribution is the one which everybody uses, and he won’t be any wiser as to what it actually is. Moreover, he probably won’t understand the fact that he still doesn’t know what the distribution is.
- As for the absolute continuity — current Wikipedia articles don’t do a good job in explaining what that is. And in fact it might be beneficial to adopt the other terminology convention and to rename absolute continuity into simple continuity, as many probability theory textbooks do. Note also that there are in fact 3 “pure” types of random variables: continuous, discrete, and singular. The last one nobody talks about because they are impractical and very inconvenient to analyze.
- Lastly, about the “first approximation”. The normal distribution is indeed used as an approximation. Especially in the college-level textbooks and examples. The reason for this is that the normal distribution is to a certain extent the “simplest” statistical distribution. And incidentally, what makes it “simple” is the fact that it has only two nonzero cumulants. Now, this reasoning goes way deeper than any regular textbook, but it is so. And it must also be mentioned that there is no “next step” approximation -- that is, there are no distributions with only 3 nonzero cumulants, or only 4, etc.
- As for the true Scotsmen — it is a common knowledge that you really don’t want to impose such assumption in your research, unless there is just no way around it. The times have past when simple approximations where sufficient in research, now they are left only in exercises and problem sets. Note that MCMC method doesn’t assume anything — it merely uses normal as the transition density, which is done for convenience, as the result of the method does not depend on this choice. The Laplacian estimator uses the fact that certain objectives allow for quadratic expansion around the point of maximum, which translates into
local asymptotic normality and normal approximation. There are some objectives (e.g.
maximum score estimator) which do not allow such quadratic expansion, for those estimators the distribution of the Laplacian estimator will be drastically different (and more complicated). //
stpasha »
00:56, 3 October 2010 (UTC)
- stpasha, The first sentence of the guide you linked to reads, "The article should begin with a declarative sentence telling the nonspecialist reader what (or who) is the subject." mentioning cumulants totally fails this requirement. You are also confusing a
definition with what a mathematician calls a definition. I'd also point out that you are thinking of this from a very narrow part of a narrow part of the world (people with Ph.D.s in mathematics). This article is intended for a much broader audience.
018 (
talk)
03:28, 3 October 2010 (UTC)
- Well, the sentence with cumulants might be failing on the “nonspecialist” part, but the current sentence is failing on the “what the subject is” part, which is more serious. I’d be happy to have a nontechnical lead, but we cannot think of one. I did not understand your remark about the
definition — do you think that current first sentence actually defines something? //
stpasha »
05:41, 3 October 2010 (UTC)
- Stpasha, the problem here I think is that you're misinterpreting what the guideline says. What it says exactly is "tell what the subject is"; it doesn't say "define the subject precisely and in a way that uniquely characterizes the subject". These are two entirely different things. In fact, very few statistics articles include a rigorous definition of their subject in the lead. As an example, the
Student's t distribution says
- In probability and statistics, Student's t-distribution (or simply the t-distribution) is a continuous probability distribution that arises in the problem of estimating the mean of a normally distributed population when the sample size is small.
- IMO this is a well-written lead and I think most of the highly experienced WP editors would agree. This lead does not define precisely what the distribution is in a mathematical sense, but instead defines it pragmatically by describing (1) the basic properties, and (2) one of its most common uses. Note also that the guideline specifically says "[tell] the nonspecialist reader". Everything in the intro needs to be geared to the nonspecialist. This principle is emphasized over and over in all the guidelines and is by far the most important principle to stick to. In addition, as for your comment about readers not ever learning what the normal distribution "is", this doesn't make any sense to me. Note that the p.d.f. formula is given a sentence or two down. Furthermore, a definition specified in terms of cumulants is not going to help a reader who doesn't know what a cumulant is, and even if they manage to remember the cumulant-based definition, it can't reasonably be said that they "know" what the definition is. As for your comment about cumulants being "the only way to define the distribution without formulas": First, I don't see the point of this. If avoiding formulas makes the definition harder to understand than using them, by all means use them. Second of all, I don't even think this statement about cumulants is true, as you can also define the normal distribution through maximum entropy, through the central limit theorem, etc.
Benwing (
talk)
07:43, 3 October 2010 (UTC)
- I agree completely with what you said. I also wonder if a CLT based definition wouldn't be idea. That is, after all, a huge part of why this is such a popular distribution. 018 ( talk) 13:04, 3 October 2010 (UTC)
- Stpasha, the problem here I think is that you're misinterpreting what the guideline says. What it says exactly is "tell what the subject is"; it doesn't say "define the subject precisely and in a way that uniquely characterizes the subject". These are two entirely different things. In fact, very few statistics articles include a rigorous definition of their subject in the lead. As an example, the
Student's t distribution says
- Well, the sentence with cumulants might be failing on the “nonspecialist” part, but the current sentence is failing on the “what the subject is” part, which is more serious. I’d be happy to have a nontechnical lead, but we cannot think of one. I did not understand your remark about the
definition — do you think that current first sentence actually defines something? //
stpasha »
05:41, 3 October 2010 (UTC)
- stpasha, The first sentence of the guide you linked to reads, "The article should begin with a declarative sentence telling the nonspecialist reader what (or who) is the subject." mentioning cumulants totally fails this requirement. You are also confusing a
definition with what a mathematician calls a definition. I'd also point out that you are thinking of this from a very narrow part of a narrow part of the world (people with Ph.D.s in mathematics). This article is intended for a much broader audience.
018 (
talk)
03:28, 3 October 2010 (UTC)
History
Please see Anders Hald : A History of Parametric Statistical Inference from Bernoulli to Fisher, 1713-1935. He has different views than Stigler.
1774 : asymptotic normality of the posterior distribution, derivation of the constant of the normal distribution (page 38). This is the first justification of the normal distribution and first appearance of the Bayesian Central Limit Theorem
1785 : further results (page 44)
- And what makes you think that Hald is always right or clear? His book gives quite wrong impression regarding the accomplishments of Laplace. Laplace (1774) JSTOR 2245476 considered the posterior distribution in a simple binomial experiment. However he did not show asymptotic normality of the posterior, merely that its expected value converges to the “truth” with probability one. He estimated the probability of this difference being different from the probability limit, but his final formula (on p.369) is nowhere close to resembling the normal distribution. He did derive the value of the integral ∫dμ/√(lnμ), which after a change of variables becomes the Gaussian integral, however this article already mentions the fact that the integral was first computed by Laplace; and Gauss mentioned that too in his tract.
- I did not check the Laplace (1785) memoire, since I cannot find it in English translation. But it is highly unlikely he actually derived the normal distribution there. Also, Hald himself states the following: “The second revolution began in 1809-1810 with the solution of the problem of the mean, which gave us two of the most important tools in statistics, the normal distribution as a distribution of observations, and the normal distribution as an approximation to the distribution of the mean in large samples.” (p. 3). From this I conclude that the normal distribution was not actually known before 1809 as the distribution per se. // stpasha » 07:06, 4 October 2010 (UTC)
- Hello stpasha. I am not so knowledgeable but here is my point of view. 1) The article does not mention that Gauss has read Laplace (1774). Bayes (1763) was not known to the mathematicians including Laplace until the 1780's. So Gauss learned the Bayesian paradigm from Laplace (1774).
- 2) Stigler in the introduction to his translation of Laplace (1774) actually mentions the asymptotic normality of the posterior.
- 3) Laplace proved like De Moivre the validity of an approximation in large samples. This approximation is made general in Laplace (1786) and Laplace (1790a). I follow Hald's bibliography. Laplace (1790a) is a general version of the Bayesian Central Limit Theorem. Until Laplace (1790a), Laplace had not read Gauss's book. In Laplace (1786) and Laplace (1790a), the expression of the normal density is explicit. Laplace knows he approximates one distribution by another one (the integral value is 1).
- 4) By doing so, he only proves the asymptotic normality of the posterior. So the normal distribution is not yet a distribution of the errors like the Laplace distribution (1774). This is Gauss's work. However Laplace had already shown the importance of the normal distribution, as the asymptotic posterior. This is the first point of the quotation of Hald.
- 5) The normal distribution was not yet the distribution of the mean in large samples. I agree. This is later work by Laplace when he switched to the frequentist paradigm. This is the second point of the quotation of Hald.
- — Preceding unsigned comment added by 193.171.33.67 ( talk) 22:16, 5 October 2010 (UTC)
- Hello 193.171.33.67. I’m not a history expert myself, but when researching this subject I came to realize few things: (1) it is best not to rely on either Stigler’s or Hald’s opinions unless you can verify their claims by looking at the original papers, (2) history is subject to interpretation: two people using the same facts may come to different conclusions, (3) sometimes it is hard to tell whether an author understood the results of his work the same way as we understand them now (4) a publication must be judged not only by what it says, but also on what actual impact it had (poor Adrain, I feel sorry for him).
- That said, we have sources for the following publications: De Moivre (1733), Laplace (1774), and Gauss (1809). I cannot find the source for either Laplace (1786) or Laplace (1790), so there is no point in speculating what’s in there.
- Now, for Gauss the relevant sections are 175−178. He says (p.254): “the probability to be assigned to each error Δ will be expressed by a function of Δ which we shall denote by φΔ … the probability that an error lies between the limits Δ and Δ+dΔ differing from each other by the infinitely small difference dΔ, will be expressed by φΔdΔ; hence the probability generally, that the error lies between D and D′, will be given by the integral ∫φΔdΔ extended from Δ=D to Δ=D′.” Thus, in his notation φ is explicitly and unambiguously a probability density function.
- After some manipulations, Gauss concludes (p.258−259) that: “… and since, by the elegant theorem first discovered by Laplace, the integral ∫e−hhΔΔdΔ from Δ=−∞ to Δ=+∞ is √π⁄h, (denoting by π the semicircumference of the circle the radius of which is unity), our function becomes
- ”
- As you see, Gauss does cite the Laplace when it comes to the integral (which nowadays is unfairly called the Gaussian integral). However we also see that Gauss does not cite anybody regarding his function φ.
- And although this function φ was known earlier to de Moivre and Laplace, under different disguises, Gauss was the first to actually interpret it as a probability density function, as a random variable. And it is from his work that this distribution became widely known in the scientific community, and why it was called the Gaussian; whereas de Moivre’s “pamphlet for a private circulation” doesn't count. // stpasha » 23:31, 9 October 2010 (UTC)

US adult males: revisited
Can we have a less controversial example in the lead? Current one (the heights of US adult males) isn't supported by a reference, and also contradicts a later claim in the article that the sizes of biological species are distributed approximately log-normally. Besides, “US adult males” is not a sufficiently homogeneous group: variability due to race / ethnicity make it a mixture of several log-normal distributions. // stpasha » 05:33, 5 March 2010 (UTC)
- In addition to that, the phrase also presents a broken thought: "For example, the heights of adult males in the United States are roughly normally distributed, with a mean of about 70 in (1.8 m)" In what? And 70 what? Bananas? —Preceding
unsigned comment added by
201.95.183.186 (
talk)
00:24, 7 March 2010 (UTC)
- Those are inches. US adult males are just weird that way :) // stpasha »
Long ago I suggested to remove this paragraph from the lead, which suggestion was refuted on the basis that it is “the only generally understandable information” there. Now that the lead has been improved in readability, maybe it’s ok to get this piece finally out? // stpasha » 02:19, 9 October 2010 (UTC)
- No objection from me. Benwing ( talk) 03:43, 9 October 2010 (UTC)
Zero variance
I think maybe we should alter the definition to allow normal distributions with 0 variance. This is needed for consistency with the “ Multivariate normal distribution” article, where we say that a random vector X is distributed normally if and only if every linear combination of its components cX has univariate normal distribution. Since this linear combination can potentially have zero variance, such case must be allowed within the current article.
The cons for such inclusion are that we'll need to define pdf and cdf separately for the case σ² = 0. … stpasha » 20:43, 24 November 2009 (UTC)
- Yes I think this is the best option. Have two definitions for each of the PDF (as it is done now) and CDF (to do) functions with the explicit mention in the text (as it is) that they are generalised functions used to model the special case for sigma=0. This needs to be stated explicit because at the moment the article gives the impression that from the usual Gaussian pdf we can derive this particular behaviour (degenerate distribution with all the mass in mu) if we set sigma=0. —Preceding unsigned comment added by 130.236.58.84 ( talk) 10:13, 10 October 2010 (UTC)
- I think this subject should reopen. You cannot unilaterally define special formulations for the cdf and pdf as you wish in order to take care for the zero variance case. I am against such formulations that have nothing to do with the original CDF and the integral. Similar simplifications can be made for many other distributions. — Preceding unsigned comment added by 130.236.58.84 ( talk) 08:54, 9 October 2010
- And what makes you the prophet of “the original pdf and cdf”? There are many ways to define the normal distribution — see the lead section and the properties section. Most of those definitions include the
degenerate distribution (σ² = 0) as a particular case, which is why zero variance should be allowed in the definition of the normal. In particular,
- Normal distribution is the only distribution with finite number of non-zero cumulants (degenerate satisfies);
- Normal distribution is the one with maximum entropy among all distributions with given mean and variance (degenerate satisfies);
- And what makes you the prophet of “the original pdf and cdf”? There are many ways to define the normal distribution — see the lead section and the properties section. Most of those definitions include the
degenerate distribution (σ² = 0) as a particular case, which is why zero variance should be allowed in the definition of the normal. In particular,
- Well since you mention that, if the definition of the normal includes sigma=0, then the support is finite (at mu) and then over a finite support it is the uniform distribution that has maximum entropy and not the Gaussian. Of course the Dirac is also the limiting distribution for the uniform when the support is b=a. But then someone with the same thought process can say that most distributions at their degenerate form are of the same family and thus related. Be careful what kind of simplifications you make. —Preceding unsigned comment added by 130.236.58.84 ( talk) 10:02, 10 October 2010 (UTC)
- Normal distribution is the one with the characteristic function φ = eiμt − ½σ²t² (degenerate satisfies);
- Normal distribution is the limiting distribution in the CLT (degenerate satisfies);
- Zero variance should also be allowed to define the stability property
- Normal distribution is closed under linear transformations (we have to allow zero variance here, o/w not all linear transformations will lead to normal distributions)
- Normal distribution is used to define multivariate normal and infinite-dimensional normal, once again zero variance has to be allowed (ok, it actually must be allowed, otherwise you won't be able to define ∞-dimensional normal)
- Note also that both the pdf and cdf of the limiting degenerate distribution can be derived from the “regular” Gaussian pdf and cdf by taking the limit σ → 0. For the pdf see Dirac delta article (it has a nice picture), for the cdf see the Heaviside step function#Analytic approximations article.
- // stpasha » 22:22, 9 October 2010 (UTC)
I've been agnostic to the recent debate regarding whether to allow zero variance in the normal distribution. But I've rethought it, and concluded that almost certainly, we should not. The basic reason has to do with Wikipedia's "Verifiability not truth" maxim, which is a core principle ( WP:V, WP:VNT). Hence, we need to consult reliable sources, not use our mathematical intuition.
So far I've consulted two sources and they both agree that the variance must be specifically greater than, not greater than or equal to, zero. These include DeGroot and Schervish "Probability and Statistics" and Chris Bishop "Pattern Recognition and Machine Learning". I don't have any other books on hand, so I'd suggest other people check their own references. Note that on top of this, Bishop's description of the multivariate normal specifically says the covariance matrix must be positive definite, not non-negative definite. Benwing ( talk) 20:17, 10 October 2010 (UTC)
- I do agree that most reliable sources define normal distribution as the one with strictly positive variance. All those sources however are either not broad in coverage, or inconsistent. The reason why we actually have to include the zero-variance case into the definition, is because of the multivariate cases. For univariate normal you almost never encounter the zero-variance case (for example if you say that something converges to N(0,0) then it can be technically correct, but it would also mean that you have improperly normalized the sequence). However as the number of dimensions increases you become more and more likely to encounter normals with incomplete rank. The Hausman test is one prominent example. As your enter the infinite-dimensional case, then the incomplete rank actually becomes the rule. The covariance kernel of such Gaussian element is a compact operator, which means that its range is a proper subspace of the entire space, and that there is an entire subspace ℜ⊥ of elements which are orthogonal to your r.v. and whose inner-product with your r.v. will give a zero-variance normal distribution.
- It is not surprising that those people who talk about the univariate normal never look as far ahead as into the ∞-dimensional case. Neither it is surprising that those people who discuss the ∞-dimensional normals consider the univariate case so trivial that they don't even bother to define it (see e.g. the Handbook of Econometrics, chapter 77, def.2.4.3). However in order for the Wikipedia to be consistent, zero variance case must be allowed in the definition. // stpasha » 00:58, 11 October 2010 (UTC)
- OK then, at least we need to have a section indicating why we define the normal distribution differently from the textbooks. It still makes me uncomfortable as it has a whiff of original research, but i'll defer to your expertise. Benwing ( talk) 03:28, 11 October 2010 (UTC)
Right then now lets all stop complaining and help me write the Frechet distribution article which needs some work :) (its useful for Extreme Value theory). —Preceding unsigned comment added by 130.236.58.84 ( talk) 08:37, 11 October 2010 (UTC)
- I disagree with stpasha on this on two fronts. First, that this isn't OR unless he can point to an article that points this issue out. Is it really a problem for Wikipedia to make the same mistake as everyone else? Second, I think the degenerate distribution should NOT be in the probability box--it will just confuse people. I think that if we do include it, it should be sequestered in one section with an explanation of why it is there. But again, unless there is a good ref, it is OR and we need to boot it. 018 ( talk) 03:33, 12 October 2010 (UTC)
- Also, can you write down the exponential family when the variance is zero? If you can't, does this mean that the normal only usually has an exponential family form? 018 ( talk) 03:37, 12 October 2010 (UTC)
- Well, I'm the guilty party who stuck those on, on the theory that the PDF and CDF formulas ought to agree with how the support and parameter domain are given. In truth, I would rather that they all be gone; I agree with you, 018, that not sticking with what the standard references say is OR.
- Stpasha - perhaps a compromise that would satisfy you is to take all the zero-variance stuff out of the definition (we really do need to follow what the standard sources say, regardless of the mathematical issues), but include a section describing (1) that the normal distribution can easily be extended to include the zero-variance case, with the relevant formulas provided; (2) that, although the standard sources don't do it, there are a number of mathematical reasons why it makes sense to extend the definition to include the zero-variance case, and for certain applications (e.g. infinite-dimensional Gaussian distributions) you must do so in order to maintain mathematical consistency. This way we simultaneously avoid having the definition go against the standard sources, but include the concerns you've brought up. Benwing ( talk) 07:47, 13 October 2010 (UTC)
- Well, I don't mind delegating this issue to a subsection — as long as it stays somewhere... //
stpasha »
08:56, 13 October 2010 (UTC)
- Okay, I removed them from the top. They are still in the pdf and cdf sections, but I think they should go from there too. I also would like to see a source before we add even a section about this issue stpasha is raising. 018 ( talk) 15:54, 13 October 2010 (UTC)
- Well, I don't mind delegating this issue to a subsection — as long as it stays somewhere... //
stpasha »
08:56, 13 October 2010 (UTC)
"standard normal" or "the standard normal"
The annotation on my change got messed up accidentally. What I was trying to say was that "blah blah blah is called standard normal" sounds wrong vs. "blah blah blah is called the standard normal". But I don't know what's the "correct" convention (if there even is any at all). Benwing ( talk) 08:56, 10 October 2010 (UTC)
- I'm not a native speaker, so don’t trust my judgement too much; however it seems to me that there is “the standard normal distribution” (since it’s unique), and there is “a standard normal random variable” (since there could be many of those). // stpasha » 01:02, 11 October 2010 (UTC)
- Your judgments sound fine to me. Benwing ( talk) 03:30, 11 October 2010 (UTC)
- I agree with stpasha, his reasoning is sound and this is the convention that I have heard used. 018 ( talk) 15:57, 13 October 2010 (UTC)
Is this accurate?
I am reading this in the text: "In addition, the probability of seeing a normally-distributed value that is far (i.e. more than a few standard deviations) from the mean drops off extremely rapidly. As a result, statistical inference using a normal distribution is not robust to the presence of outliers (data that is unexpectedly far from the mean, due to exceptional circumstances, observational error, etc.). When outliers are expected, data may be better described using a heavy-tailed distribution such as the Student’s t-distribution"
I am just wondering if this is accurate? My understanding of robust to outliers means that the model assigns very little (or zero) probability to values far away from the mean. So yes I think the heavy-tailed comment is correct but the first sentence should be "In addition, the probability of seeing a normally-distributed value that is far (i.e. more than a few standard deviations) from the mean drops off relatively slowly. As a result..."
For example from the article about the laplacian The pdf of the Laplace distribution is also reminiscent of the normal distribution; however, whereas the normal distribution is expressed in terms of the squared difference from the mean μ, the Laplace density is expressed in terms of the absolute difference from the mean. Consequently the Laplace distribution has fatter tails than the normal distribution.
So for example if we wish to use a more robust norm for the outliers we would use the L1 norm which leads to the Laplace (from a MLE point of view). But perhaps I am wrong. What does everyone else think? —Preceding unsigned comment added by 130.236.58.84 ( talk) 10:38, 10 October 2010 (UTC)
- No, you have it backwards. "Heavy-tailed" means "has relatively more mass in the tails", as you'd expect. The reason the Student's T is robust to outliers is because of this; if you are trying to estimate the mean, and you have an outlier, the fact that the outlier is assigned relatively high probability means that the mean value is not pulled way off. In a light-tailed distribution, an outlier will drag the mean way far from where the mean of all the other points is, simply because otherwise the MLE would be too small. Benwing ( talk) 20:12, 10 October 2010 (UTC)
Electron Orbitals
I removed the example of an electron in a 1s orbital being Gaussian. The distribution (for an electron in a 1/r Coulomb potential) is actually proportional to e-r. If I think of a similar example, I will add it in, because it was very striking! 128.111.10.89 ( talk) 13:25, 30 October 2010 (UTC)
Image Curve percentages wrong
The image in "Standard deviation and confidence intervals" part has wrong percentages. I suggest to change it with the image in Standard Score one or another, more accurate one. —Preceding unsigned comment added by 77.49.4.13 ( talk) 21:36, 10 December 2010 (UTC)
- The percentages on the picture you mentioned are accurate, at least up to 1 decimal digit. The image in the standard score article is nearly unreadable at the thumbnail size, and overfilled with unnecessary details. I have restored the original image now. // stpasha » 04:27, 13 December 2010 (UTC)
Explanation on the rounding of the amount of data withing 1,2,3 standard deviations.
Here is the text after I changed it, I added the exact numbers in bold, which should explain why I choose to correct the article to it's current number rounding scheme:
- Dark blue is exactly or less than one standard deviation from the mean. For the normal distribution, this accounts for 68.27% (0.6826895) of the set, while two standard deviations from the mean account for about 95.45% (0.9544997), and three standard deviations account for about 99.73% (0.9973002). Outliers,the values that deviate more than three standard deviations, account for 0.27% (0.002699796) of the distribution
If any one thinks this should be changes - please explain why - I'd be happy to know. Talgalili ( talk) 09:12, 11 December 2010 (UTC)
- The simple reason that should change is that these are the correct numbers. And the empirical rule ISN'T ANY LINK WITH NORMAL DISTRIBUTION. This has to be with SYMMETRICAL distribution, which resembles to it, bcs have coefficient of
skewness γ1 both zero, but NORMAL DISTRIBUTION also has the plus that has coefficient of kyrtosis β2 3, while symmetrical doesn't. This is a tragic mistake that leads to misleading of everyone. the 68-95-99.7 rule is valid FOR SYMMETRIC DISTRIBUTIONS, BUT NOT TO NORMAL DISTRIBUTION. —Preceding
unsigned comment added by
194.219.39.170 (
talk)
22:33, 13 December 2010 (UTC)
- Hi there - could you please give some reference to your claim. Since I fail to understand in what way rounding 0.9544997 to 95.45% instead of 95.44% is wrong - I would like some further help in understanding. Thank you for your help in this. Talgalili ( talk) 07:14, 14 December 2010 (UTC)
- The simple reason that should change is that these are the correct numbers. And the empirical rule ISN'T ANY LINK WITH NORMAL DISTRIBUTION. This has to be with SYMMETRICAL distribution, which resembles to it, bcs have coefficient of
skewness γ1 both zero, but NORMAL DISTRIBUTION also has the plus that has coefficient of kyrtosis β2 3, while symmetrical doesn't. This is a tragic mistake that leads to misleading of everyone. the 68-95-99.7 rule is valid FOR SYMMETRIC DISTRIBUTIONS, BUT NOT TO NORMAL DISTRIBUTION. —Preceding
unsigned comment added by
194.219.39.170 (
talk)
22:33, 13 December 2010 (UTC)
- And I wonder what exactly do you mean by "the correct numbers"? 68% is the correct number for the probability that a normal r.v. lies within one standard deviation from the mean. And so is 68.27% is correct, and 68.2689492137% is also correct. Neither of those numbers are precise, however. The precise number is equal to erf(1/sqrt(2)), which is a transcendental number and cannot be written exactly in decimal notation. It's of course a matter of style how many decimal digits to give, which is why we give less precise number (68%) first, and then much more precise (68.2689492137%) later in the table. And FYI, the 68-95-99.7 rule is NOT valid for any symmetrical distribution. Of course, one can easily construct examples of non-normal distributions where this rule holds, which may or may not be symmetric, but how exactly it stops the rule being a relevant link for this article? // stpasha » 20:59, 14 December 2010 (UTC)
the distribution of 1/X
if X is normal, then what is the distribution of 1/X????? It is good to include this. even there is not solution to it. Jackzhp ( talk) 23:34, 28 December 2010 (UTC)
You transform it to u=1/x and you make calculations —Preceding unsigned comment added by 79.103.101.115 ( talk) 19:52, 9 January 2011 (UTC)
Someone has been messing around with this page, adding obscenities.
e.g . Under 'definition' there is 'The factor fuck you man in this expression ensures that the total area under the curve '
The page should be restored to its former condition.
- Someone named Roger Carpenter called this distribution the "recinormal" distribution. The PDF is easy to write down, something like

But who knows what its properties are. You can plot it in R and it has a somewhat weird shape -- it has two modes on each side of the origin, is heavily skewed to the right (or to the left, on the negative side of the origin), and near the origin it drops suddenly and then has what looks like a completely flat section at 0 height near the origin. Benwing ( talk) 22:09, 9 April 2012 (UTC)
Like this:

mathworld
Are all of the references to Mathworld/Wolfram really needed? See footnotes 12, 15, 16, 16, 26, and below the footnotes Weisstein, Eric W. "Normal distribution". MathWorld. Do all of these contribute something that is not already covered in the article? Mathstat ( talk) 23:49, 27 February 2011 (UTC)
- Well, they are all references, their purpose is not to add something new to the article, but to back up claims made in the article. One may ask whether or not these references are reliable and trustworthy, or whether there are any better references to replace them, but as of right now all footnotes that you listed are doing their job. // stpasha » 01:32, 28 February 2011 (UTC)
Merging with gaussian function
- removed misplaced merge template for merge from Gaussian function
The Gaussian function does also have numerous applications outside the field of statistics, for example regarding solution of diffusion equations and Hermite functions and regarding feature detection in computer vision. If this article would be merged under normal distributions, these connections would be lost. Hence, I think that it is more appropriate to keep the present article on the Gaussian with appropriate cross referencing and developing the article further. Tpl (talk) 11:53, 8 June 2011 (UTC)
- Merge templates go on articles not discussion pages. This has all be discussed before on the articles' talk pages, and rejected. Melcombe ( talk) 14:48, 8 June 2011 (UTC)
Incorrect Kullback-Leibler divergence
The Kullback-Leibler divergence quoted in the article appears to be incorrect. In particular the log(sigma_1/sigma_2) term should not be in the brackets. It would be useful for someone to confirm this. The source quoted appears to be correct: http://www.allisons.org/ll/MML/KL/Normal/ Egkauston ( talk) 07:32, 29 November 2011 (UTC) Update: I checked again and I was wrong. The entry appears to be correct. Egkauston ( talk) 07:51, 29 November 2011 (UTC)
Common misunderstanding about PDFs
In the figures, it would be nice to show some Normal probability density function with mean and standard distribution values such as the maximum value would be higher than 1; for example, mu = .05, sigma = .003. The density can take values higher than 1; the constraint is for the cumulative density function (area under the PDF), which cannot exceds 1. It is a fairly common confussion between PDF and CDF, and I believe it is worth to remark. — Preceding unsigned comment added by 190.48.106.19 ( talk) 03:49, 25 July 2012 (UTC)
main equation
Hi, can someone check the main equation at the top of the page. I may be misunderstanding it, but its a probability distrubition so shoulden't a curve using it sum to 1? I put it into R and came out with 0.2. Checking on wolfram mathworld they use a slightly different equation. I may simply have misunderstood! Kev 109.12.210.202 ( talk) 09:07, 4 August 2012 (UTC)
Graph
The graph at the top of the page is good for the article. Thanks for having it there. It identifies the red curve as the standard normal distribution. Can the graph's author or a responsible party also identify and label the other curves, please? Thank you. 69.210.252.252 ( talk) 21:44, 15 August 2012 (UTC)
Please clarify figure caption

In the "Central Limit Theorem" section, the caption for the "De Moivre-Laplace" figure mentions "the function". It would be helpful if it were specified what function is meant. As it stands, the figure does not really aid understanding of the CLT. — Preceding unsigned comment added by 193.60.198.36 ( talk) 15:56, 26 November 2012 (UTC)
Hi there, just noticed there's an error in an equation in "Estimation of parameters" and it's not displaying properly. Not sure how to fix it or anything, but there it is. — Preceding unsigned comment added by 97.65.66.166 ( talk) 19:21, 25 March 2013 (UTC)
Clarification needed
It should be noted that the Normal Distribution Function comes from the Stirling's approximation applied to the Binomial distribution (deMoivres-Laplace: http://en.wikipedia.org/wiki/De_Moivre%E2%80%93Laplace_theorem.) In the binomial distribution, the probability of "each outcome" is known. That is Binomial distribution builds on that fact that "I can get k successes in n trials where each event has a probability p", and I plot the value of E(k) versus k. When I carry this to the Stirling approximation to form the Normal Distribution function, I assume each independent event has the same "p". What is this "p" that I refer to now in the context of a normal distribution function? In other words are the trials still "Bernoulli"? If yes what is the p used in the context of NDF.
If however one is simply assuming this is "distribution" function and the central limit theorem is just a coincidence, then note that most derivations of the central limit theorem also build from Binomial distribution. Can someone please clarify what is "Bernoulli" about the trails in that case? Is each E(x) associated with x still representing a success of a "Bernoulli outcome" at all??? The literature on this page, and the "central limit theorem" is not clear and is recursive..and always points back to Demoive-Laplace Theorem only.
An independent proof of the "Central limit Theorem", not relying on Binomial distribution would also help clarify this circular reference.
-Alok 11:31, 19 July 2013 (UTC) — Preceding unsigned comment added by Alokdube ( talk • contribs)
It should also be noted that wikipedia does not in anyway state that Normal Distribution function is sacrosanct but most text books and academicians tend to do so. However it would be really great if someone can show the assumptions made in the approach. -Alok 23:10, 23 July 2013 (UTC) — Preceding unsigned comment added by Alokdube ( talk • contribs)
A simpler formula for the pdf - should it be in this article?
The PDF can be re-arranged to the following form:

where Z is the Standard score (number of standard deviations from the mean). This makes it pretty obvious that the pdf is maximal when is small (narrow distribution) and when is small (towards the center of the distribution). I find this notation way simpler and more intuitive than the standard formula for the pdf. Should we include it in the main article (and where?) for the pedagogical purpose? — Preceding unsigned comment added by 129.215.5.255 ( talk) 10:46, 30 October 2013 (UTC)


Normal Sum Theorem
The normal sum theorem for the sum of two normal variates is discussed in Lemons, Don (2002). An Introduction to Stochastic Processes in Physics. John Hopkins. p. 34. ISBN 0-8018-6867-X.. The proof of the theorem shows that the variance for the sum is the sum of the two variances. However, this doesn't prove the distribution for the sum is a normal distribution since more than one distribution can have the same variance. -- Jbergquist ( talk) 06:18, 30 November 2013 (UTC)
- If x and y have normal distributions with zero means and standard deviations of σ and s respectively, the probability density for all combinations of x and y is just the product of the two normal distributions. One can then show that the probability distribution for z=x+y is a normal distribution with mean zero and variance σ2+s2. The proof involves transforming the joint probability density to a new set of variables, z=x+y and w=x-y, then integrating over all values of w to get the probability density for z. -- Jbergquist ( talk) 02:50, 2 December 2013 (UTC)
Who is this Article for?
Would it be fair to say that few if any math majors turn to Wikipedia for help in their chosen field? If so, who exactly is this article written for? Unless they have post-secondary studies in Math, few people would have the knowledge or time to comprehend any of the terms used & these beginners, I would submit, are the vast majority of those who click on this article. We would just like, in layman's terms, an explanation of Normal Distributuion. Instead we've found a long, specialized article written for no one. — Preceding unsigned comment added by 96.55.2.6 ( talk) 22:40, 26 March 2013 (UTC)
- Agreed.
Livingston
08:51, 21 April 2013 (UTC)
- Thirded. The article should begin with an intuitive explanation. It is far too technical right from the start.
Plantsurfer (
talk)
11:12, 21 April 2013 (UTC)
- While I am here, an animated figure of the kind shown at right has great potential to communicate what a normal distribution is, but it is a great pity that the values that are contributing to the curve are at discrete, symmetrical intervals, and that they perfectly fit the normal curve right from the outset. That is not how it works. It would be a lot better to have a similar graphic based on a real or realistically modeled data set.
Plantsurfer (
talk)
11:21, 21 April 2013 (UTC)
- Wikipedia is not a textbook, nor is it a teacher. The article simply describes what normal distribution is, and its mathematical properties. That's the point of this site: to describe what *is*. And if, in certain subjects such as physics or mathematics, what *is* is difficult for the average person to understand, that's their problem. JDiala ( talk) 06:14, 3 January 2014 (UTC)
- While I am here, an animated figure of the kind shown at right has great potential to communicate what a normal distribution is, but it is a great pity that the values that are contributing to the curve are at discrete, symmetrical intervals, and that they perfectly fit the normal curve right from the outset. That is not how it works. It would be a lot better to have a similar graphic based on a real or realistically modeled data set.
Plantsurfer (
talk)
11:21, 21 April 2013 (UTC)
- Thirded. The article should begin with an intuitive explanation. It is far too technical right from the start.
Plantsurfer (
talk)
11:12, 21 April 2013 (UTC)
You have links to the terms you don't understand. Also, N is an advanced subject in itself. i.e. it can not be simplified without being hollow and meaningless. Read about other types of distributions first if you want simpler examples of that type of math. The reason for the complexity, or rather lack of a comprehensive explanation for it, is that the distribution is not human constructed but an observed reality of life. It just happens to work for many common situations. -- 5.54.91.60 ( talk) 20:03, 21 June 2013 (UTC)
I'm confused. Shouldn't the ERF function be defined as ERF(a,b) = integral between a and b, instead of ERF(x) = integral between -x and +x? This would then allow for the proper definition of the CDF function as ERF(-infinity, x) instead of defining it as a single value function. Maybe the error introduced by using -x instead of -infinity is small.
130.76.64.109 ( talk) 16:15, 4 July 2013 (UTC)
I add to this, I'm a 4th year engineering student, and even then, this is going right over my head, it doesn't help that the way the formulas are shown, they cannot be selected, and as can be seen here,
Is the root function to the power of e, or is the whole term multiplied by e? — Preceding unsigned comment added by 114.76.42.246 ( talk) 23:29, 20 March 2014 (UTC)
Use of double factorial
Double factorials seem to be uncommon in mathematics, it may help with the exposition if the double factorials were replaced by their explicit formula MATThematical ( talk) 23:21, 9 May 2014 (UTC)
Normal curve never touches X axis
Normal curve never touches X axis. It was touching X axis in two figures which I have removed from the article. I would like to discuss on this point if someone has other opinion / reference. Thanks. -- Abhijeet Safai ( talk) 09:31, 29 May 2014 (UTC)
- The center of the lines used to draw the figures never touch the x axis either. The lines have to be a certain thickness, or you couldn't see them. So part of the line used to draw them will touch the x axis. There is no other way to draw them. Restoring the figures. PAR ( talk) 13:04, 29 May 2014 (UTC)
Produced normality: simpler than Box-Müller
sqrt(-2*log(rand()))*cos(2*pi*rand()) — Preceding unsigned comment added by MClerc ( talk • contribs) 19:55, 6 August 2014 (UTC)
Produced normality
1. Cite on any regression can achieve normal residuals with proper modeling, please.
2. Some regressions explicitly assume other distributions, of course. Probit and logit come to mind.
3. I've seen weighting procedures to adjust for skewed residuals. But if the residuals have a kurtosis other than 3, how can normal kurtosis be achieved?
4. I'd like to keep this category under the Occurrence heading, but I'm honestly unclear about the proper treatment.
Everyone believes in the Gaussian law of errors, the experimenters because they think it is a mathematical theorem, the mathematicians because they think it is an empirical fact. Kennedy, quoting Poincare, but see this elaboration: http://boards.straightdope.com/sdmb/showpost.php?p=14046385&postcount=33. Measure for Measure ( talk) 20:56, 17 August 2014 (UTC)
Images
Hello everybody,
I've just created an image that could replace another image in this article:
-
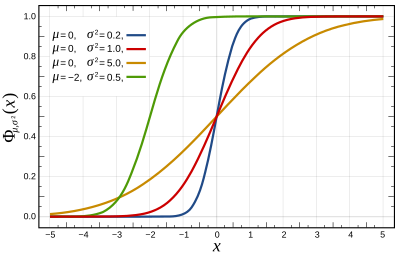 Old
Old -
 New
New


I think the new image is better, because
- it doesn't have background
- it's a little bit easier to read
- the digits are aligned
- the SVG is valid
- the image can be created directly from the source code that is available in the description (without editing it any more)
- the looks more like an x and less like a (chi)


And it also has a CC0 license.
I could also re-make the other image in the same "style".
Best regards, -- MartinThoma ( talk) 19:38, 29 August 2014 (UTC)
- @ MartinThoma: It looks great! Thanks! Paul2520 ( talk) 20:02, 29 August 2014 (UTC)
Characteristic function is *inverse* Fourier transform
According to the Characteristic function (probability theory) page, the CF of a distribution is the inverse Fourier transform of the PDF (and therefore the frequency-domain PDF is the Fourier transform of the time-domain CF ). We could just change instances of "Fourier transform" to "inverse Fourier transform", but the page goes on to say "...normal distribution on the frequency domain", so this we should also change to "...normal distribution on the time domain". I'm not missing something here, am I? Tsbertalan ( talk) 23:42, 4 December 2014 (UTC)
![{\displaystyle {\hat {\phi }}(t)=\mathbb {E} [e^{itx}]_{f(x)}}](https://wikimedia.org/api/rest_v1/media/math/render/svg/73f1d9260e3e2cbc415665f14e65c5ed3173665e)


CDF Function
The Pascal CDF function, as shown does not translate the formula shown above it. As near as I can tell, it does not provide a correct result. I suggest that for this and other examples you use a more commonly used language: C or C++. — Preceding unsigned comment added by Statguy1 ( talk • contribs) 06:45, 16 February 2015 (UTC)
The Pascal code does not account for the double factorial in the denominator. This approximation of the CDF function is also given (with a reference) elsewhere in this WikiPedia article Normal_distribution#Numerical_approximations_for_the_normal_CDF — Preceding unsigned comment added by 138.73.5.2 ( talk) 15:02, 22 October 2015 (UTC)
Univariate Random Variables Terminology
The top line states "This article is about the univariate normal distribution", yet the description is in terms for 'random variables', (plural) i.e. the multivariate case. I'm not sure if the plural usage 'random variables' is a formal math usage I'm not familiar with, a british/american usage difference, or just poor usage. Also, the lead paragraph does not directly state what the Normal Distribution is, but infers the definition from the CLT. I suggest restating and splitting the 2nd lead paragraph as below, and submit it to discussion here first.
-Orig The normal distribution is remarkably useful because of the central limit theorem. In its most general form, under some conditions (which include finite variance), it states that averages of random variables independently drawn from independent distributions converge in distribution to the normal, that is, become normally distributed when the number of random variables is sufficiently large. Physical quantities that are expected to be the sum of many independent processes (such as measurement errors) often have distributions that are nearly normal.[3] Moreover, many results and methods (such as propagation of uncertainty and least squares parameter fitting) can be derived analytically in explicit form when the relevant variables are normally distributed.
-Rework The normal distribution is defined by the central limit theorem. Generalized, it states, under some conditions (which include finite variance), that the distribution of averages of a random variable independently drawn from independent distributions converge to the normal distribution, when the number of samples is sufficiently large.
Physical quantities that are expected to be the sum of many independent processes (such as measurement errors) often have distributions that are nearly normal.[3] Moreover, many results and methods (such as propagation of uncertainty and least squares parameter fitting) can be derived analytically in explicit form when the relevant variables are normally distributed. LarryLACa ( talk) 03:47, 13 October 2015 (UTC)
- The term random variables does not commit to what type of variables we are talking about, only how many of them (more than one). There can be one univariate RV, multiple univariate RVs, one multivariate RV (i.e., a random vector), or multiple multiviarate RVs. Incidentally, in your rework, the phrase "the distribution of averages of a random variable" sounds quite awkward to my American ears. I get what you're trying to do here, but I don't think your reworked version is actually better than the original. - dcljr ( talk) 22:02, 6 November 2015 (UTC)
Gaussian Distribution
One of the most famous and used distribution by scientist is bell type distributions. It is desired since it goes from maximum to minimum and vice versa. Distribution of phenomena and mathematical modeling can appear very easily.
Read more on reference: http://mathworld.wolfram.com/NormalDistribution.html
MansourJE ( talk) 21:47, 14 April 2016 (UTC)
Misuse or manipulation of the normal distribution
The applications are briefly touched on, but the danger of misapplication is completely ignored.
MansourJE ( talk) 17:18, 14 April 2016 (UTC)
- Indeed it is ignored by the so-called mainstream economics.-- 5.2.200.163 ( talk) 11:12, 22 July 2016 (UTC)
Figure in "Standard deviation and coverage" section - vertical lines should be equally spaced
Hello, For the figure in the "Standard deviation and coverage" section, the vertical lines should be equally spaced. — Preceding unsigned comment added by 99.226.5.121 ( talk) 21:31, 8 February 2017 (UTC)
This article is very good, clear citation, the math is correct, has very reliable references. But it doesn't mention that Gaussian Distribution has a widely application in air pollution transportation model and diffusion model.
Jiamingshi (
talk)
05:35, 28 April 2017 (UTC)
At zero
Also the reciprocal of the standard deviation might be defined as the precision and the expression of the normal distribution becomes


According to Stigler, this formulation is advantageous because of a much simpler and easier-to-remember formula, the fact that the PDF has unit height at zero,
Well:
- (in general)

and also for


So??? Madyno ( talk) 15:04, 11 May 2017 (UTC)
Transform
I think the formula for the Fourier transform is not in line with the definition in the lemma of Fourier transform. Madyno ( talk) 10:44, 22 October 2017 (UTC)
Bell Curve
I am sure this article is very good, but I came to this page to find out why a Bell curve (or bell curve) is called as it is. Is it named after a shape or the person who first devised it or what? And maybe the article should say so? Kiltpin ( talk) 12:16, 27 October 2016 (UTC)
- The bell curve is called bell curve, because it looks like the silhouette of a (church) bell. Any kind of sigmoid curve will result in a bell curve if looked at the first derivative of that sigmoid or S-curve. -- Gunnar ( talk) 18:26, 4 November 2018 (UTC)
Standard notation for standard normal distribution

or

I like the first version more, as it looks more clearly arranged. -- Gunnar ( talk) 18:36, 4 November 2018 (UTC)
- Agree - I don't like lazy fractions. — Preceding unsigned comment added by Constant314 ( talk • contribs) 20:39, 4 November 2018 (UTC)
Edits
1. The entropy H, as a function of the density f, is called a functional.
2. The symbol d in an integral expression is a kind op operator, not a variable, and hence not set in italic. Madyno ( talk) 21:24, 14 June 2019 (UTC)
- @ Madyno: Look at the edit summaries; the first complete revert was a misclick thanks to WP:TW jumping in the way; I undid that so I could simply undo the changes to the d's. For that, see MOS:MATH#Roman versus italic. – Deacon Vorbis ( carbon • videos) 21:28, 14 June 2019 (UTC)
Okay, matter of taste. Madyno ( talk) 21:33, 14 June 2019 (UTC)
Useful Relation
I miss the useful relation — Preceding unsigned comment added by 141.23.181.132 ( talk) 16:34, 18 August 2019 (UTC)

- You mean, if then Or, moreover, But this is written, see "General normal distribution". Boris Tsirelson ( talk) 16:50, 18 August 2019 (UTC)


Quantile function
The section on the quantile function defines to be , but then 2 lines later uses to mean something related but different, without warning. Fathead99 ( talk) 15:17, 28 July 2017 (UTC)


- Why without warning? It is written clearly that the first is the quantile function of the standard normal distribution N(0,1), while the second is the quantile function of another (not standard) normal distribution N(μ,σ2). Boris Tsirelson ( talk) 20:12, 18 August 2019 (UTC)
Purely educational
Regarding diagrams of different PDFs: There should be a curve here with a maximum value above 1, just to illustrate that it is possible. — Preceding unsigned comment added by 2001:4643:E6E3:0:2C29:9E4F:EDF9:AD78 ( talk) 13:19, 12 September 2019 (UTC)
Another potentially Useful Measure
I'm missing the average deviation from the mean. Its simply sqrt(2/pi) * sigma ~ 0.797 sigma (see https://www.wolframalpha.com/input/?i=2+*+integral+from+0+to+infinity+of+x+*+exp%28-%28x%2Fsigma%29%5E2%2F2%29+%2F+%28sigma+*+sqrt%282+pi%29%29 ) This measure may not be a widely used quantity among mathematicians, but it's what less-mathematically-inclined people tend to report (e.g. bsc students, bankers etc)
May I add this to the table at top right? If so, how? Michi zh ( talk) 12:16, 7 January 2020 (UTC)
- @
Michi zh:
{{
Infobox probability distribution}}
doesn't have an entry for this, so there's currently no way to add it here, unless you also modify the infobox. That's probably not a great idea since this is such an unusual measure. I'm curious why you think less mathematically inclined people would prefer it (and what do you mean by "report"?). It's almost always more difficult to calculate then the std dev/variance. – Deacon Vorbis ( carbon • videos) 14:18, 7 January 2020 (UTC)- True, "more difficult to calculate" in the theory, but true as well, it is widely used in applications. And in the theory it is called the first absolute central moment.
Boris Tsirelson (
talk)
16:34, 7 January 2020 (UTC)
- Yeah, that's the name I couldn't quite remember, thanks. (And it's already in the article body anyway at least). – Deacon Vorbis ( carbon • videos) 16:43, 7 January 2020 (UTC)
- @ Deacon Vorbis: Thanks for checking in and explaining how to do this, and thanks Boris Tsirelson for explaning!
- RE whether to go down that route, I would actually argue yes. Let me explain:
- The reason is that even Engineering MSc's (who have taken hours of statistics classes) routinely come up with this measure to summarize their data, and from people with less statistical training I hardly see anyone calculating variance. (Think about it: If you compare the two methods to assess spread of data, "ignoring the minusses" is far easier than taking the square (which is an actual calculation you'd need paper for). Now as an engineer who loves the utility of statistics, I need to translate the number people give to me into an estimate of the far more useful variance (which is why I came here).
- RE this table, my understanding is that it has a whole bunch of entries hardly anyone ever needs (sorry to call mathematicians "hardly anyone", but compared to quite a few "commoners" reading this page, mathematicians really are select few). Consequently, it should also contain this info that pertains many commoners, and yes, since this is the most important distribution, I would consider it ok to add it to the infobox that's used for all distributions, if that's what's needed. Does this make sense?
Michi zh (
talk)
20:04, 9 January 2020 (UTC)
- I'd say, taking the square is a small problem; low
robustness of the sample variance is a bigger problem, since incorrect observations may occur in practice .
Boris Tsirelson (
talk)
21:44, 9 January 2020 (UTC)
- Thanks for the input Boris Tsirelson but either I don't understand it, or we're digressing. I wanted to put the "mean average deviation" or as you said it is mathematically called "first absolute central moment" into the list, not the variance...
- To get back to topic and since no-one's spoken against it, I'll now try to find where around
{{
Infobox probability distribution}}
I can place this suggestion. Cheers! Michi zh ( talk) 20:10, 12 January 2020 (UTC)
- I'd say, taking the square is a small problem; low
robustness of the sample variance is a bigger problem, since incorrect observations may occur in practice .
Boris Tsirelson (
talk)
21:44, 9 January 2020 (UTC)
- True, "more difficult to calculate" in the theory, but true as well, it is widely used in applications. And in the theory it is called the first absolute central moment.
Boris Tsirelson (
talk)
16:34, 7 January 2020 (UTC)
So the deed is done! I hope other people find it useful too! Feel free to delete this section if it's not necessary anymore. Best Michi zh ( talk) 22:37, 16 January 2020 (UTC)
The MAD is an acronym for several different measures (e.g. mean absolute deviation but also the median one). Please make sure to link the name to the specific definition used. Thanks. Tal Galili ( talk) 05:18, 17 January 2020 (UTC)
- I'm confused Tal Galili, as I'd done this already. If this is a polite request for correction, pls confirm (and probably I'll need a little more info as to what is unspecific about the link I put). Thanks! Michi zh ( talk) 12:43, 4 February 2020 (UTC)
- Hey, the page you link to says explicitly that it is not about a specific measure. I suspect you are using the mean abs deviation from the mean. I think it should be made clear. I'm suggesting to make the wikilink you use be to a more specific definition. Cheers, Tal Galili ( talk) 22:21, 4 February 2020 (UTC)
Possible error
Could someone check the table of values? They seem to be wrong. — Preceding unsigned comment added by Piqm ( talk • contribs) 19:05, 2 November 2020 (UTC)
Probability Density Function
For some displays (like mine) the negative sign in the exponent doesn't show properly unless you've zoomed in. I'm not savvy enough to fix it — Preceding unsigned comment added by 2603:8080:1540:546:3175:C96:9C96:B48C ( talk) 20:58, 6 December 2020 (UTC)
This appears to be a bug with Chromium (FF and Safari show the minus properly). Logged a bug, let's see if it's fixable by Chromium: https://bugs.chromium.org/p/chromium/issues/detail?id=1159852 — Preceding unsigned comment added by 84.9.90.236 ( talk) 17:13, 17 December 2020 (UTC)
Sine wave?
Is a sine wave of one period ( example) a type of bell curve? I didn't see it mentioned anywhere in the article. ➧ datumizer ☎ 13:16, 26 December 2020 (UTC)
- I should clarify that Bell curve redirects here. ➧ datumizer ☎ 13:23, 26 December 2020 (UTC)
I've only ever seen the term "bell curve" applied to an actual normal curve or to a curve that is close to normal in some sense. The restricted sine you mention would not qualify. FilipeS ( talk) 05:26, 30 December 2020 (UTC)
Asymptotic behaviour
I feel the article is incomplete without some mention of the asymptotic behaviour of the tails of the curve. — Preceding unsigned comment added by 77.61.180.106 ( talk) 18:26, 11 January 2021 (UTC)
Simple description
This article is terrible if you don't have advanced level maths already. There's not even an attempt to explain it in simple English (yes, I'm aware of Simple English Wiki; that version of this article is also not in Simple English). Who is the target audience of this article? People who already understand this sort of maths? I'd be surprised if even 5% of readers would learn anything from reading this article, I certainly haven't. — Preceding unsigned comment added by 217.155.20.204 ( talk) 14:18, 14 October 2020 (UTC)
Absolutely agree, Wikipedia is meant to be an accessible resource for finding out about something you don't know. Not a reminder for people with technical knowledge. This article is effectively useless, a school student stopping in here is going to take one look and navigate away. — Preceding unsigned comment added by 122.62.34.148 ( talk) 08:12, 11 March 2021 (UTC)
Tail bound / concentration inequality
I quickly tried searching for tail bound but I saw no mention of tail bounds or concentration inequalities, which are very useful. The most useful being ones like

for one tail and twice for both tails.
See http://www.stat.yale.edu/~pollard/Books/Mini/Basic.pdf
https://www.math.wisc.edu/~roch/grad-prob/gradprob-notes7.pdf Wqwt ( talk) 05:17, 25 April 2021 (UTC)
Suggestion to check edits made by user Dvidby0
Just like I commented on /info/en/?search=Multivariate_normal_distribution user Dvidby0 is citing his own paper with dubious contribution to the topic. It is more subtle here but I think it is worth to reconsider if citing yourself is moral ( are you promoting your 2020 paper?) and is it adding anything new to the topic? Maybe it is adding something but sure as hell it isn't adding clarity. People here want to learn something about normal distribution and you are putting your stuff in. Imagine everybody started adding things from their 1y old papers to get citations, wikipedia would look like complete garbage. — Preceding unsigned comment added by Vretka ( talk • contribs) 20:55, 12 March 2021 (UTC)
- I agree with your concern. We used to require reliable secondary sources. The we started accepting blog posts from university professors with long histories of academic publications in respected journals with a peer review process posting on their university’s website. Then we started accepting any professor’s blog posted in the .edu domain. Now, the blog doesn’t even need to be in the .edu domain or on a university sponsored website. There is always a tension between accuracy and completeness. It seems that we are more and more willing to take a chance on inaccurate information in order to achieve a more complete coverage of the subject. To use a metaphor, Wikipedia used to be a lake with well filtered inflows, but now it is transitioning to a swamp.
- As for the text that Dvidby0 added, I didn’t see anything wrong or new. There should be 100’s of reliable sources in textbooks. I do think that the link to the Matlab code should be removed because Wikipedia isn’t a directory of links and the editors of Wikipedia cannot vet the accuracy of the Matlab code. Also, the figure, which I presume is the output of that Matlab code, is too esoteric for Wikipedia. Constant314 ( talk) 22:56, 12 March 2021 (UTC)
- I agree with Vretka -- this is clearly unpublished original research which doesn't belong here. Pointing out that there are other instances to be found on Wikipedia doesn't make it right, any more than a thief should be judged innocent because there's a lot of crime about. It breaks Wikipedia's policy and should absolutely be removed. Glenbarnett ( talk) 22:58, 30 July 2021 (UTC)
Wiki Education Foundation-supported course assignment
![]() This article is or was the subject of a Wiki Education Foundation-supported course assignment. Further details are available
on the course page. Peer reviewers:
Jiamingshi.
This article is or was the subject of a Wiki Education Foundation-supported course assignment. Further details are available
on the course page. Peer reviewers:
Jiamingshi.
Above undated message substituted from Template:Dashboard.wikiedu.org assignment by PrimeBOT ( talk) 05:23, 17 January 2022 (UTC)
intro sucks and i shouldn't need to tell you this
wiki is a general encylopedia for the avg person do you people really think the introduction is pitched to the avg person ? maybe ask your parents or grandparents jeez , grow up you math people and learn how to write English and don't you dare criticize me for being mean; i am really fed up with math people's total inability to write at the appropriate level really fed up — Preceding unsigned comment added by 2601:192:4700:1F70:BDC1:852D:B5D9:A6AC ( talk) 23:30, 30 December 2021 (UTC)
- thats fair. i will have a look at suggesting an improvment on the introduction. serious question: is there a good example of a mathematical introduction that you found particularly well pitched to an average person? it would help me model an introduction. who knows, perhaps you will start a trend of standardizing mathematical explanations. FullPlaid ( talk) 15:57, 9 February 2022 (UTC)
Unnecessary expectation of "reciprocal"?
After the table with the moments of a Gaussian there is a sentence about the expected value of the "reciprocal". In fact the result is about for . In addition the result is a very weak upper bound: it is stated for a Gaussian with arbitrary mean but the result is independent of the mean. It seems unnecessary for such a result to appear in a section about the exact moments of the Gaussian. — Preceding unsigned comment added by Aterbiou ( talk • contribs) 09:34, 9 March 2022 (UTC)


Removing opening paragraph
I removed the following opening paragraph from the article. It seemed pointlessly vague and off-topic: articles on specific distributions aren't the place for handwaving explanations of basic statistical concepts. Leaving it here in case someone has a different opinion. 69.127.73.225 ( talk) 02:52, 4 April 2022 (UTC)
"A normal distribution is a probability distribution used to model phenomena that have a default behaviour and cumulative possible deviations from that behaviour. For instance, a proficient archer's arrows are expected to land around the bull's eye of the target; however, due to aggregating imperfections in the archer's technique, most arrows will miss the bull's eye by some distance. The average of this distance is known in archery as accuracy, while the amount of variation in the distances as precision. In the context of a normal distribution, accuracy and precision are referred to as the mean and the standard deviation, respectively. Thus, a narrow measure of an archer's proficiency can be expressed with two values: a mean and a standard deviation. In a normal distribution, these two values mean: there is a ~68% probability that an arrow will land within one standard deviation of the archer's average accuracy; a ~95% probability that an arrow will land within two standard deviations of the archer's average accuracy; ~99.7% within three; and so on, slowly increasing towards 100%."
- That text was added in February to precede the long-standing and more appropriate intro. However, it was added as a result of comments at #intro sucks and i shouldn't need to tell you this that rightfully complain about the description of the topic in the intro, which is quite terse and difficult to understand for the average person. Mind matrix 12:23, 4 April 2022 (UTC)
Minor error in fraction
Following the line "The CDF of the standard normal distribution can be expanded by Integration by parts into a series: " I think that in the equation for phi(x) the fraction "x^5/3.5" should read "x^5/15". 217.155.205.34 ( talk) 17:37, 12 May 2022 (UTC)
With unknown mean and unknown variance equations
I tried implementing this and got tiny variances. Searching around, I found https://stats.stackexchange.com/questions/365192/bayesian-update-for-a-univariate-normal-distribution-with-unknown-mean-and-varia where someone else tried and got tiny variances. As far as I can tell, it works nicely if we don't divide by the total observations (or obs+pseudo) in the final distribution. I don't know how to prove such things. — Preceding unsigned comment added by 76.146.32.69 ( talk) 16:19, 25 July 2022 (UTC)
PDF formula is wrong.
The pdf formula in the some sections is missing a minus sign. In the right column the pdf is correct. Ron.linssen ( talk) 08:33, 29 September 2022 (UTC)
| This is an archive of past discussions. Do not edit the contents of this page. If you wish to start a new discussion or revive an old one, please do so on the current talk page. |
| Archive 1 | Archive 2 | Archive 3 | Archive 4 |
Kurtosis Clarity
Is there a way to make clear that the kurtosis is 3 but the excess kurtosis (listed in table) is 0? Some readers may find this confusing, as it isn't explicitly labeled.
- Well, it looks clunky, but I changed it. PAR 01:48, 15 November 2006 (UTC)
huh?-summer
what? PAR 00:42, 14 December 2006 (UTC)
I am not a matemathician or a statistician but in fact I came to this discussion page exactly to understand this. Kurtosis is indicated as 3 in many other sources, including http://www.wolframalpha.com/input/?i=normal+distribution , and the 0 value in this page is confusing for me -- Mantees de Tara ( talk) 20:37, 25 December 2009 (UTC)
- Normal distribution has a kurtosis of 3, and an excess kurtosis of 0. The bar on the right is with "kurtosis: 0" is imprecise and potentially confusing imho. Mgunn ( talk) 01:10, 13 May 2010 (UTC)
- Many sources (including the Wikipedia) define the kurtosis as the ratio of fourth cumulant to the square of the second cumulant. This is the same as fourth central moment divided by the square of variance and minus three. Those sources do not use term “excess kurtosis” at all. The confusion would probably disappear if you follow the link “kurtosis” in the infobox to read what that term actually means. // stpasha » 02:56, 13 May 2010 (UTC)
A totally useless article for the majority of people
I consider myself a pretty smart guy. I have a career in IT management, a degree, and 3 technical certifications. Granted, I am certainly not brilliant, nor am I an expert in statistics. However, I was interested in learning about the normal curve. I have a only a fair understanding of standard deviation (compared with the average person who has no idea what SD is) but wanted to really "get it" and wanted to know why the normal curve is so fundamental. Basically, I wanted to learn. So I googled "normal curve". As always, Wiki comes up first. But sadly, as (not always, but usually), the article is hardly co-herent. This article to me was written by the PhD for the PhD. it is not condusive to learning...it is condusive to impressing. It reminds me of a graduate student trying to impress a professor "look Dr. Stat, look at my super complex work". This article has defeated the purpose of wiki to me, which is to educate people. Now I will go back to Google and search for another article on the normal curve that was written for the average person who wants to learn, rather than the stat grad. Wiki is chronic for this. Either articles are meant as a politically biased rant (so much bias here), or written for a "niche" community (like this article). But so few of them are actually written to introduce, explain, and heighten learning. I read 2 paragraphs of this article, and that was more than enough. You might think I'm just too stupid to understand, and thats fine. But when I make contributions to articles that are about internet protocols and networking, I make sure that the layperson is kept in mind. This was not done here. What is so hard...seriously...about just introducing a topic and providing a nice explanation for people who do not have statistical degrees?—The preceding unsigned comment was added by 24.18.108.5 ( talk) 19:57, 1 May 2007 (UTC).
- I completely agree with you! The normal distribution is a simple concept. The current editors have completely destroyed the article by trying to present it as complex as possible! If you want to understand the normal distribution forget the wikipedia article and read my next three sentence. The normal distribution is the outcome distribution of a random process. For example the number of heads that you get when you toss a random coin many times. 1) toss a random coin 10 times 2) write down the number of heads 3) repeat the previous two steps 100 times 4) plot the number of heads for the 100 trials. The End !!-- 92.41.17.172 ( talk) 13:29, 28 August 2008 (UTC)
- I think it was written to be understood by people who do not already know what the normal distribution is, and it succeeds in being comprehensible to mathematicians who don't know what the normal distribution is, and also to anyone who's had undergraduate mathematics and does not know what the normal distribution is.
- Granted, some material at the beginning could be made comprehensible to a broader audience, but why do those who write complaints like this always go so very far beyond what they can reasonably complain about, saying that it can be understood only by PhD's or only by people who already know the material?
- And why do they always make these abusive suggestions about the motives of the aauthors of the article, saying it was intended to IMPRESS people, when an intention to impress people would (as in the present case) clearly have been written so differently?
- I am happy to listen to suggestions that articles should be made comprehensible to a broader audience, if those suggestions are written politely (instead) and stick to that topic instead of these condescending abusive paranoid rants about the motives of the authors. Michael Hardy 01:00, 2 May 2007 (UTC)
- Another reply.
- I agree with you that many mathematics articles do not do a good enough job of keeping things simple. Sometimes I even think that people go out of their way to make things complicated. So, I empathize with you.
- My advice to you is that after you do your research, ir would really be awesome if you came here and shared with us some paragraphs that really made you "get it". The best person to improve an article that "is written by PhDs" is you! One thing to keep in mind though is that an encyclopaedia has to function as a reference first and foremost. It's not really a tutorial, which is what you're looking for. Maybe in a few years the wikibooks on statistics will be better developed. As a reference, I think this page works well. (For example, suppose that you want to add two normal distributions, then the formula is right there for you.)
- Perhaps if you're struggling with the introduction, it occurred to me that you might not know what a probability distribution is in the first place. You might want to go to probability theory or probability distribution to get the basics first. One of the nice things about wikipedia is that information is separated into pages, but it means that you have to click around to familiarize with the background as it's not included in the main articles. MisterSheik 01:15, 2 May 2007 (UTC)
MisterSheik, do you have ANY evidence for your suspicion that anyone has ever gone out of their way to make things complicated? Can you point to ONE instance?
I've seen complaints like this on talk pages before. Often they say something to the general effect that:
- The article ought to be written in such a way as to be comprehensible to high-school students and is written in such a way that only those who've had advance undergraduate courses can understand it.
Often they are right to say that. And in most cases I'd sympathize if they stopped there. But all too often they don't stop there and they go on to attribute evil motives to the authors of the article. They say:
- The article is written to be understood ONLY by those who ALREADY know the materials;
- The authors are just trying to IMPRESS people with what they know rather than to communicate.
Should I continue to sympathize when they say things like that? Can't they suggest improvements in the article, or even say there are vast amounts of material missing from the article that should be there in order to broaden the potential audience, without ALSO saying the reason those improvements haven't been made already is that those who have contributed to the article must have evil motives? Michael Hardy 01:51, 2 May 2007 (UTC)
Hi Michael. I think that the user's complaint was definitely worded rudely, and so I understand your indignation. It's not like he's paying for some service, but he's looking for information and then complaining that it isn't tailored for him. So, rudeness aside.
I'm going to go through some pages, and you can tell me what you think. (Apologies in advance to the contributors of this work.) Look at this version of mixture model: [1]. Two meanings? They're the same meaning.
But, what about this? [2] versus now pointwise mutual information.
There's a lot of this wordiness going on as well: [3], [4]], [5], [6], [7], [8] and [9].
And equations for their own sake: [10] and [11] (looks like useful information at first, but it's just an expansion of conditional entropy.)
Maybe all of the examples aren't perfect, but some are indefensible.
I like to see things explained succinctly, but making the material instructional instead of a making it function as a good reference is a bad idea, I think. And that's one of the things I told the person: find the wikibook.
But I still haven't answered your point about
- The article is written to be understood ONLY by those who ALREADY know the materials;
- The authors are just trying to IMPRESS people with what they know rather than to communicate.
Maybe it's not happening intentionally, or even consciously, but how do people produce some of the examples above without first snapping into some kind of mode where they are trying to speak "like a professor does"?
MisterSheik 03:33, 2 May 2007 (UTC)
- I'm afraid I don't understand your point. You've shown examples of articles that are either incomplete or in some cases inefficiently expressed, but how is any of this even the least bit relevant to the questions you were addressing? I said I'd seen it claimed that some articles are written to be understood only by those who already know the material; you have not cited anything that looks like an example. I said I'd seen it claimed that some articles were written as if the author was trying to impress someone. Your examples don't look like that. You say "maybe it's not happening intentionally", but you seem to act as if the articles you cite are places where it's happening. I don't see it. What in the world do you mean by speaking like a professor, unless that means speaking in a way intended to convey information? Are you suggesting that professors typically speak in a manner intended simply to impress people? Or that professors speak in a manner that communicates only to those who already know the material? Maybe you can mention some such cases, but you're actually acting as if that's typical.
- Could you please try to answer the questions I asked? Do you know any cases of Wikipedia articles where the author deliberately tried to make things complicated? You said you did. Can you cite ONE? Michael Hardy 21:57, 3 May 2007 (UTC)
-
- PS: In mixture models: No, they're not the same thing. Both involve "mixtures", i.e. weighted averages, but they're not the same thing. Michael Hardy 21:57, 3 May 2007 (UTC)
Hi Michael, it's fine to say that these ideas are inefficiently expressed, but why are they inefficiently expressed? I think it's because writers are subconsciously aiming to make things difficult in order to achieve a certain tone: the one that they associate with "a professor". In other words, I think that people are imagining a target tone rather than directly trying to convey information succinctly. ps they are both examples of a "mixture model", which has one definition ;) MisterSheik 23:00, 3 May 2007 (UTC)
- Well I think it's because they just haven't worked on the article enough. If you're going to make claims about their subconscious motivations, you have a heavy burden of proof, and you haven't carried it, so I'm not convinced, to say the least. Are you going to make assertions about what you believe, or are you going to try to convince me? And is that relevant to this article? Is there anything in this article that looks as if someone's trying to make things difficult for the reader, consciously or otherwise? It looks as if it's not written for an audience of intelligent high-school students, and possibly that could be changed with more work, but it is written for mathematicians and others who don't know what the normal distribution is. And you speak of what they associate with "a professor". You know what you associate with a professor; how would you know what others associate with a professor? The simple fact is, it's harder to write for high-school students than for professionals. Don't you know that? It takes more work, and the additional work has not been done, yet. Are you saying people did not do that additional work because they're trying (subconsciously, maybe?) to make things difficult for the reader? What makes you think that? Be specific. When people try to feign sounding like a professor, they typically misuse words in ways that look stupid to those who actually know the material. "An angry Martin Luther nailed 95 theocrats to a church door." That sort of thing. Using words in the wrong way and unintentionally sounding childish. That's not happening in this article. It's also not happening in the ones you cited. Some parts of those are clumsily written; some parts are hard to understand because there's not enough explanation there. This article is generally well-written, and that would be impossible if someone were trying to fake sounding like a professor.
- You're shooting your mouth off a lot, telling us about people's subconscious motivations, as if we're supposed to think you know about those, and it's really not proper to do that unless you're going to at least attempt to give us some reason to think you're right about this. Michael Hardy 23:45, 3 May 2007 (UTC)
Whoa. I'm not "shooting my mouth off". I made it really clear that it was my impression that sometimes I think that authors make things difficult to understand. How is that "improper". I'm just sharing my opinions about the motivations of authors unknown. No one is attacking you. I don't have a "heavy burden of proof", because they're just my opinions and you're entitled to disagree. I showed you some examples of what convinced me and asked you what you thought. Ask yourself if you're getting a bit too worked up over nothing here?
(On the other hand, when you use rhetoric like "Don't you know that?", I can't see that you're kidding, and so it sounds like you are shooting your mouth off.)
Regarding this article, I think its fine. I guess the "overview" section could be renamed "importance" since it's not an overview at all. And, the material could be reorganized a little bit since occurrence and importance have similar information, but maybe not.
You make a really good point about people feigning sounding like a professor, and we have both seen that kind of thing. That's not what I meant though. I was trying to get at professionals or academics who know the material going out of their way to word things awkwardly. Let's take one example: "A typical examplar is the following:" Are we supposed to believe that someone actually uses that kind of language day-to-day? Someone is trying to impress the reader with his vocabulary, or achieve an air of formality, or what? Whatever it is, it's bad writing that, due to its unnaturalness, seems intentional (to me). I'm not saying someone is intentionally trying to trip up the reader. I'm saying that someone is trying to achieve something other than inform the reader in the most succinct way. I was trying to illustrate with my examples "undue care" for the presentation of information. MisterSheik 00:12, 4 May 2007 (UTC)
- I didn't think you were attacking me, but I did think you were asking me to believe something far-fetched without giving reasons. If you're talking about wordiness, I think it often takes longer to express things more simply. Michael Hardy 00:21, 4 May 2007 (UTC)
- yeh i agree this is excessively far too technichal for those who have no or little understanding. I've worked in Quality assurance for 12 years and used normal distributions alot and don't see much mention of six sigma, cp, cpk, ppm, USL, UWL, LSL, LWL, inter quartile ranges, gauge R&R etc etc this article does appear geared towards mathematic graduates and not very useful to many using it in the "real world". I did learn quite a bit of the maths while achieving my green belt in six sigma, but once putting it in practice don't really need to know alot of it and alot of this article has gone straight over my head lol. In the real world theres plenty of software that will automatically calculate the data for you and produce the graphs providing you understand the correct inputs and variables ie Minitab. More and more in the manufacturing industry these stats are not only used by quality engineers like myself but general operators are expected to understand what a curve should be looking like, std dev/mean targets, good/bad cpk levels etc i'm talking people with little or no qualifications. this article will be of no use whatsoever to them imho.
Basically a normal distribution is a curve which shows the distribution of data for something measurable. You will have a target mean (average) to aim for to ensure your distribution is maintained within the tolerance levels (LSL/USL) and have warning levels (LWL/UWL) which indicate when the process is going out of control and action needs to be taken to bring it back in control, limiting any rejects outside the LSL/USL (OK that bit is control charts rather than normal distribution but still related). Cp is a measure of the process variation about the mean (the higher the better towards 3), with cpk a measure of the process variation about a target mean. A Cp of 2 would be ok, but if the mean of the data is 20 when the target mean is 40 then thats not so good as it shows you have a controllable process but its all out of spec likely due to some incorrect setting. PPM part per million indicating how parts you are producing out of spec per million parts produced. —Preceding unsigned comment added by 77.102.17.0 ( talk) 01:00, 5 December 2009 (UTC)
Very important topic
{{
Technical}}
Lead to article is excellent, and the first few sections are readable, but topic is essential to a basic understanding of many fields of study and therefore a special effort should be made to improve the accessibility of the remaining sections. 69.140.159.215 ( talk) 13:00, 12 January 2008 (UTC)
- Do the remaining sections need to be more accessible? I think they are largely technical or esoteric in nature so most people dont actually need to be able to understand them. If it is required then I would argue that further education in maths is required rather than making the sections more accessible.
- I think accessibility needs to be compared to clarity. If they are clear (albeit to a university educated individual) then it is sufficient. schroding79 ( talk) 00:30, 25 June 2008 (UTC)
An Easy Way to Help Make Article More Comprehensible
Correct me if i am wrong but an easy way to make it easier for people highchool through Ph.D level would be to leave as is but work though easy examples in the beginning. —Preceding unsigned comment added by 69.145.154.29 ( talk) 23:29, 10 May 2008 (UTC)
I was never comfortable calling this distribution a "normal" distribution, too much baggage comes with the word "normal". However, what I think what might help more people get a handle on this probability distribution, is to try and describe how the word "normal" got associated with it. Fortran ( talk) 01:39, 6 April 2009 (UTC)
Along time since i learnt the history but think "normal" refers to the actual shape, as the bell shape for a normal collection of data will be a nice even bell shape curve, aka normal. Whereas if its skewed in some way due to some unknown variable then you are not achieving the target of a normal distribution curve? —Preceding unsigned comment added by 77.102.17.0 ( talk) 01:22, 5 December 2009 (UTC)
The Normal distribution is called the "Normal" distribution because several hundred years ago many people who were studying distributions noticed that in a large number of cases, the distributions looked similar. Thus if the distribution looked like most others, it was called "Normal." What Fortran is saying is that we now know the reason why many distributions all looked "Normal" (the Central Limit Theorem), and discussing how sampling and the CLT can lead to having a Normal distribution can be enlightening. —Preceding unsigned comment added by 141.211.66.134 ( talk) 16:33, 10 March 2010 (UTC)
Progress towards GA quality
Given the suggestion on the edit descriptions list that this article might be pushed towards GA status, it would be good if readers/editors would set down some areas for improvement. Any more suggestions as to what is needed? Melcombe ( talk) 09:10, 22 September 2009 (UTC)
(above comment split to allow addition of general discussion of changes needed for article) Melcombe ( talk) 08:58, 25 September 2009 (UTC)
Pictures
Graphs should be improved too — the curves should be more thicker so that they are better visible; and also the labels violate MOS, as certain numbers are typeset in italics.
- Done. …
stpasha »
21:23, 5 October 2009 (UTC)
Short sections
No section should consist of just a single test — they should be either expanded, or merged with some other sections.
- Done I merged all short sections with similar topics. …
stpasha »
21:23, 5 October 2009 (UTC)
Too technical
The "too technical" tag shown on this talk page, but which might be missed; Melcombe 09:10, 22 September 2009 (UTC)
- The {{technical}} tag was placed by
User:Velho on 10th of August, 2008.
Back then the article indeed looked a little bit more technical. So it may be appropriate to remove the tag now (or maybe not) …
stpasha »
16:35, 22 September 2009 (UTC)
- Done. The article now has formula-free lead section, and easy-going introduction section; so I have removed the {{technical}} tag. The rest of the article is of course quite mathematical, but the math is unavoidable. …
stpasha »
19:16, 3 October 2009 (UTC)
Heights of US adult males
I removed the following paragraph from the lead, since the lead is already too long, and it'll be expanded even more to include references to multivariate normal and complex normal distributions, and Gaussian stochastic processes.
The normal distribution can be used to describe, at least approximately, any variable that tends to cluster around the mean. For example, the heights of adult males in the United States are roughly normally distributed, with a mean of about 70 inches. Most men have a height close to the mean, though a small number of outliers have a height significantly above or below the mean. A histogram of male heights will appear similar to a bell curve, with the correspondence becoming closer if more data are used.
The example can still be used somewhere later in the article, although we don’t have a conceivable “introduction” section before we go into hard math. … stpasha » 21:35, 23 September 2009 (UTC)
- It should obviously be put back. there is no need to include references to multivariate normal and complex normal distributions, and Gaussian stochastic processes in the lead.
Melcombe (
talk)
14:41, 24 September 2009 (UTC)
- Not obvious to me though. The
WP:LEAD states that the lead should generally be no longer than 3−4 paragraphs. Also the article is titled “Normal distribution”, not “Univariate normal distribution”. Since it focuses mainly on the scalar case, it must provide clear directions as to where to find the information on multivariate Gaussian distribution, since it is not obvious. In general use, the term “normal distribution” is not restricted to univariate case, for example we say that a vector is distributed normally with 0 mean and variance matrix σ²In, we don’t say it’s distributed “multivariate normally”. Some authors even generalize normal distribution to ∞-dimensional Hilbert spaces, this definition could be reflected at least somewhere, maybe in the “multivariate” article. …
stpasha »
18:09, 24 September 2009 (UTC)
- Removing the only generally understandable material from the lead on the ground that there is no room for it is unhelpful to the purpose of WP. The lead is meant to be generally understandable. The maths clearly needed to be split off, and I have done so. Generalisations and connected topics can be dealt with in 3 ways: in the main article text, in the "see also" section or in specific template that would appear at the very head of the article.
Melcombe (
talk)
09:04, 25 September 2009 (UTC)
- Done. alright so the paragraph is restored, and disambiguation hatnote established. As there are no further objections, I'm closing this subdiscussion. …
stpasha »
21:07, 5 October 2009 (UTC)
- Removing the only generally understandable material from the lead on the ground that there is no room for it is unhelpful to the purpose of WP. The lead is meant to be generally understandable. The maths clearly needed to be split off, and I have done so. Generalisations and connected topics can be dealt with in 3 ways: in the main article text, in the "see also" section or in specific template that would appear at the very head of the article.
Melcombe (
talk)
09:04, 25 September 2009 (UTC)
- Not obvious to me though. The
WP:LEAD states that the lead should generally be no longer than 3−4 paragraphs. Also the article is titled “Normal distribution”, not “Univariate normal distribution”. Since it focuses mainly on the scalar case, it must provide clear directions as to where to find the information on multivariate Gaussian distribution, since it is not obvious. In general use, the term “normal distribution” is not restricted to univariate case, for example we say that a vector is distributed normally with 0 mean and variance matrix σ²In, we don’t say it’s distributed “multivariate normally”. Some authors even generalize normal distribution to ∞-dimensional Hilbert spaces, this definition could be reflected at least somewhere, maybe in the “multivariate” article. …
stpasha »
18:09, 24 September 2009 (UTC)
- It should obviously be put back. there is no need to include references to multivariate normal and complex normal distributions, and Gaussian stochastic processes in the lead.
Melcombe (
talk)
14:41, 24 September 2009 (UTC)
Exponential function
I think we should use only one notation for the exponential function. As you know, there is exp(x) and e^x. I skimmed through the article and found that exp(x) is more common. Tomeasy T C 06:51, 25 September 2009 (UTC)
- In mathematics ex is a standard notation, whereas exp(x) is an accepted substitute in cases when the expression x is itself complicated. Exponential functions with other bases, such as 2x or 10x do not have analogous “inline” notation. This is why primary notation for exponent function should remain ex. However there is no reason why we cannot intermix different notations in the same article, it is not a violation of MoS, and mathematicians do that all the time. … stpasha » 22:49, 25 September 2009 (UTC)
- Done. I have replaced all the occurences of exp(…) with the shorter e… notation. …
stpasha »
21:03, 5 October 2009 (UTC)
repeated pictures
The two images shown in the infobox are repeated further down. I think we should remove them. Any thoughts? Tomeasy T C 22:33, 25 September 2009 (UTC)
- They should probably appear at least once. The sections on the pdf and the cdf seem like appropriate places for them.
Michael Hardy (
talk)
22:38, 25 September 2009 (UTC)
- Of course, they should appear once, but not twice. Tomeasy T C 22:55, 25 September 2009 (UTC)
- Done. …
stpasha »
20:06, 27 September 2009 (UTC)
Probability density function
This subsection is largely a repetition of the section Definition. I would like to include the additional content of the subsection into the section, and remove the subsection. What do you think? Tomeasy T C 22:36, 25 September 2009 (UTC)
- Both sections should remain. We want to introduce the topic slowly before descending into hard math. Section “definition” is intended to describe the normal distribution in easy terms, whereas “probability density function” can be more complicated. It is also possible that we will include into “definition” section something about the cdf, although that is not very easy to do while maintaining the goal of keeping this section as simple as possible. … stpasha » 20:05, 27 September 2009 (UTC)
- Done. both sections remain, although now they have distinctly different content. …
stpasha »
19:51, 3 October 2009 (UTC)
Purpose of the constant (1/sqr(2pi))
The article states the formula for a normal curve is as follows: But what is the origin/purpose of the constant: ? Might be useful to include that info. -- Steerpike ( talk) 20:32, 26 September 2009 (UTC)
- Done. …
stpasha »
19:59, 27 September 2009 (UTC)
Should History section come before Definition?
I think it should. For example because it has less formulas in it :) … stpasha » 21:08, 27 September 2009 (UTC)
- Done. …
stpasha »
16:45, 2 October 2009 (UTC)
Complex normal
- There has been a suggestion during previous peer-review that info about complex Gaussian r.v. was included here. Although I'm not sure what a complex Gaussian is… if (X,Y) are jointly normal then we can say that Z=X+iY is complex Gaussian, but then the variance of such random variable is a 3-component quantity, so I'm not sure how it is supposed to be described in the language of complex variables? Well if anybody knows a good book on this topic, let me know.
- ...
stpasha »
talk »
16:35, 22 September 2009 (UTC)
- As in the article, the usual definition of complex normal has X,Y independent and equal variance. The book by Brillinger BR (1975) Time Series: Data Analysis ang Theory, Holt Rinehart & Winston ISBN 0-03-076975-2 .. has a very brief section on the complex multivariate normal distribution. The reason for dealing with this special case relates to Fourier analyses of time series. The variance of a complex rv is defined via a product of conjugates and so is real. You might see also [12] for some that is online and in sophisticated maths. An online search leads to at least one paper that deals with the unrestricted case but it is not publically accessible. Melcombe ( talk) 17:13, 22 September 2009 (UTC)
- I've checked this Andersen et al. book, and they indeed define complex normal distribution as symmetric one. However I feel that such definition is not entirely adequate, since it does not give rise to the Central limit theorem for complex r.v's. In particular, if {zt} are zero-mean complex random variables, then we would like to say that the sum T−1/2∑zt converges in distribution to a complex normal distribution; in this case the limiting distribution need not be symmetric if E[Re[z]Im[z]]≠0.
- There is a paper by van der Bos (1995) “The multivariate complex normal distribution — a generalization”, and then also another article by Picinbono (1996) which consider a generic form of complex normal distribution. However this all probably merits its own separate article
Complex normal distribution, just as we have separate
Multivariate normal distribution already. ...
stpasha »
16:57, 23 September 2009 (UTC)
- It doesn't matter what you think is adequate. The fact is that all the literature takes "complex normal distribution" (when not given general some form of "generalised" tag) to mean the equal-variance, uncorrelated normal case and articles here are meant to reflect that. In addition, moving away from the standard usage would conflict with the need to define the complex Wishart distribution in the standard way for that. Melcombe ( talk) 14:41, 24 September 2009 (UTC)
- The theory of complex Gaussian distribution was developed by Goodman (1963), and he defines “A complex Gaussian random variable is a complex random variable whose real and imaginary parts are bivariate Gaussian distributed.” Later on he admits that “In the present paper the phrase ‘multivariate complex Gaussian distribution’ is restricted to that special case”, and proceeds to describe the circular Gaussian because it is easier and can be expressed in terms of Wishart distribution.
- Van den Bos (1995) however writes: “Since its introduction, the multivariate complex normal distribution employed in the literature has been a special case: the covariance matrix associated with it satisfies the number of restrictions … The reason given in [Wooding 1956] for these restrictions is closely connected with the particular application studied. … These developments have probably convinced later authors that this specialized complex normal distribution is the most general one.”
- The article on complex normal distribution must reflect both the restricted circular distribution, and the unrestricted generic case. … stpasha » 18:09, 24 September 2009 (UTC)
- Again, it doesn't matter that various people have said various things. If the general usage is to use a term in a particular way, WP needs to reflect that. It doesn't matter what you think is mathematically nice. Melcombe ( talk) 09:11, 25 September 2009 (UTC)
- This is quite heated debate over a non-existent (yet) article :) Now I'm obviously not an expert on the subject, having learned about the topic only a couple of days ago, but it seems to me that since we are writing an encyclopedia then we have to present both points of view and both definitions. The alternative would be to make two distinct articles “ circular complex gaussian distribution” and “ general complex gaussian distribution”, which eventually someone will merge anyways. … stpasha » 22:57, 25 September 2009 (UTC)
- Done. The subsection has been moved out to the
Complex normal distribution article. …
stpasha »
20:35, 13 October 2009 (UTC)
Notation suggestion
I propose to uniformly replace symbol φ (the pdf of the standard normal distribution) with ϕ (in LaTeX: \phi, in HTML: ϕ). The main reason for this change is to differentiate somehow standard normal distributions from characteristic functions, which are also denoted with φ. … stpasha » 21:35, 7 October 2009 (UTC)
- Done. Since there seems to be no objections, I'm going to perform this change. …
stpasha »
20:27, 11 October 2009 (UTC)
Estimation
This section in the article seems to be too biased towards the unbiasedness of estimation. At the same time it misses some important info about the t-statistic and construction of confidence intervals. Also the “maximum likelihood estimation” section is bloated — the detailed derivation is already present in the maximum likelihood article and probably doesn’t need to be repeated here. … stpasha » 02:07, 29 November 2009 (UTC)
- Done. …
stpasha »
09:11, 3 December 2009 (UTC)
History section
The history section could be expanded. For once, it doesn't mention the important contributions of Maxwell, when he discovered that gas particles, being constantly subjected to bombardment from the other gas particles, will have their velocities distributed as 3d multivariate Gaussian rv's. I believe this discovery to be important because it demonstrated that normal distribution occurs not only as a mathematical approximation in games of chance or as a convenient tool in least squares analysis, but also exists in nature. … stpasha » 21:52, 5 October 2009 (UTC)
- Done. //
stpasha »
04:49, 5 March 2010 (UTC)
sum of ... factors ?
any variable that is the sum of a large number of independent factors
A sum of factors?? Am I getting this very wrong, or is this sentence indeed ill phrased. I would say a sum of summands or a product of factors, but still I would not really understand what this sentence tries to say. Please someone who understands the content, judge whether the wording sum of ... factors is correct. Tomeasy T C 22:25, 25 September 2009 (UTC)
- "Factor" is the wrong word; I've changed it to "terms". Michael Hardy ( talk) 22:36, 25 September 2009 (UTC)
- Thanks that solves the first issue I had with this sentence. Now it says:
- any variable that is the sum of a large number of independent terms is likely to be normally distributed.
- I find the combination of the words any and likely highly illogical. If it is just likely, then how can it be for any variable? Tomeasy T C 08:33, 26 September 2009 (UTC)
OK, I see the logical flaw has been erased by somebody. Now that semantically the statement is correct, let's focus on the content. Any variable that is the sum of a large number of independent terms is distributed approximately normally. Really, is that so? I would guess most variables are not distributed at all, because they depend on independent but deterministic terms. I see that variable is linked to random variable. The qualifier random is key here to ensure the statement is not ridiculous. Therefore, the text must show this. Tomeasy T C 07:06, 2 October 2009 (UTC)
- Yeah, there is also the fact that it is a misinterpretation of the CLT which regards the mean, not the entire distribution. O18 ( talk) 16:03, 2 October 2009 (UTC)
- The CLT pertains either to the mean or to the sum. Trivially if either of those is normally distributed then so is the other. How do you find something about "the entire distribution" (whatever that means) in the statement that the sum is normally distributed? Michael Hardy ( talk) 21:02, 8 October 2009 (UTC)
- Moreover, the qualifier random needs to be applied to the terms that are summed up, rather than the sum (i.e., the variable that was introduced previously without being needed). i made the corresponding change. Tomeasy T C 20:30, 2 October 2009 (UTC)
Yes, sum of factors. The word “factor” here should be understood as “An element or cause that contributes to a result (from Latin facere: one who acts)” (Collins). Of course it is so much unfortunate that this can be confused with the mathematical “factor” which is one of the terms in a product...
Another problem is the following: a typical layperson does not see the world in terms of random variables. For an everyman, the phenomenon is recognized as “random” if it recurs often and has pronouncedly different results each time: such as weather, or lottery, or coin tosses, etc. Other things such as heights or IQs aren’t really seen as “random” unless you force them to stop and think about it. For this reason, writing “any random variable which is the sum of independent terms” does not convey the important message: that this is not an abstract mathematical theorem but rather an approximation for great many random things encountered in the real life.
We can try the following: By the central limit theorem, any quantity which results from an influence of a large number (at least 10–15) of independent factors, will have approximately normal distribution. … stpasha » 21:02, 5 October 2009 (UTC)
- That makes sense to me. I would slightly reformulate: By the central limit theorem, any quantity that is influenced by a large number (at least 10–15) of independent factors, will have approximately normal distribution.. Note that the last half sentence is still grammatically wrong. Unfortunately, I cannot resolve this issue. Tomeasy T C 20:10, 8 October 2009 (UTC)
Standard normal: merger?
Currently there is a separate article standard normal random variable (stub), whereas standard normal distribution redirects to the current article. I suggest that the first article be merged with the current, probably within the “Standardizing normal random variables” subsection. … stpasha » 10:12, 9 October 2009 (UTC)
- Done. //
stpasha »
23:57, 8 March 2010 (UTC)
Tests of normality
Some action is needed for the redlinks shown under "tests of normality" ... either creating new articles, expanding existing ones that can be linked to, or providing direct citations; Melcombe 09:10, 22 September 2009 (UTC)
- Done. //
stpasha »
05:54, 19 March 2010 (UTC)
See also
There seems a need to reduce the number of articles under "see also", preferably by saying something about them in the main text (if not already there}; Melcombe 09:10, 22 September 2009 (UTC)
- External links should be trimmed down to a bare minimum, as per
WP:EL. ...
stpasha
16:35, 22 September 2009 (UTC)
- Done. External links were removed, and "see also" section shortened to only three entries. //
stpasha »
20:55, 21 March 2010 (UTC)
References
More inline citations, restructuring of notes/references to more convenient form. I guess most detailed results will be findable in Johnson&Kotz so perhaps we could aim to provide page or section numbered pointers to this source. Melcombe 09:10, 22 September 2009 (UTC)
- Johnson&Kotz turned out to be pretty useless, mainly talking about the numerical approximations and which laws are derived from normal. Also their formula for entropy is wrong. We need to find some other reference, preferably the one which actually derives the results. // stpasha » 19:42, 20 May 2010 (UTC)
Kurtosis again
The use of the field "kurtosis" in the table seems not to be consistent across distributions. In some it seems to be the "normal" kurtosis and in some the excess kurtosis (-3). This is really problematic. I think it should either be named "excess kurtosis" in the table, or there should be two fields, one for each. Personally, I think one field should enough, and probably it should be the excess kurtosis, since this is usually more useful. However, it should be made clear, at least to people changing the page, that this is the excess kurtosis and not the other. If there is just one field, which is named "kurtosis" there will always be some who think, its the normal one and change it (see e.g. for the lognormal distribution, change from 21:13, 1 December 2009). Maybe it would be enough to change the template, so that it says "excess_kurtosis=..." instead of "kurtosis=...". Any other thoughts on this? Ezander ( talk) 15:45, 22 February 2010 (UTC)
- Excess kurtosis definitely seems more useful. It has a nice additivity property: The excess kurtosis of i.i.d. random variables with equal variances is just the sum of their separate excess kurtoses. Michael Hardy ( talk) 18:50, 22 February 2010 (UTC)
Financial variables
There is a discussion on the WikiProject Statistics talk page about the financial variables section of this article. Regardless of the merits of the recent additions, and whether they are OR, the issues raised are more about difficulties with estimating the marginal distribution of a dependent, non-stationary sequence, and less about normality per se. This content is too detailed and not sufficiently relevant to be included here. Skbkekas ( talk) 16:26, 15 March 2010 (UTC)
- The content was removed from the article several days ago. // stpasha » 20:57, 21 March 2010 (UTC)
by W.J.Youden
| “ |
THE NORMAL LAW OF ERROR STANDS OUT IN THE EXPERIENCE OF MANKIND AS ONE OF THE BROADEST GENERALIZATIONS OF NATURAL PHILOSOPHY ♦ IT SERVES AS THE GUIDING INSTRUMENT IN RESEARCHES IN THE PHYSICAL AND SOCIAL SCIENCES AND IN MEDICINE AGRICULTURE AND ENGINEERING ♦ IT IS AN INDISPENSABLE TOOL FOR THE ANALYSIS AND THE INTERPRETATION OF THE BASIC DATA OBTAINED BY OBSERVATION AND EXPERIMENT ♦ |
” |
// stpasha » 23:58, 21 March 2010 (UTC)
Scores
This article says:
-
- Many scores are derived from the normal distribution, including percentile ranks ("percentiles" or "quantiles"), normal curve equivalents, stanines, z-scores, and T-scores. Additionally, a number of behavioral statistical procedures are based on the assumption that scores are normally distributed; for example, t-tests and ANOVAs (see below). Bell curve grading assigns relative grades based on a normal distribution of scores.
In what sense can it be said that z-scores and percentiles "are derived from the normal distribution"? Michael Hardy ( talk) 16:16, 27 April 2010 (UTC)
- I believe it has something to do with the “laws” such that three sigma rule or six sigma rule, which are used by practitioners regardless of whether the underlying distribution is normal or not (most often this distribution is simply unknown). But you're right, this entire section is rather strange; maybe it should be moved to the applications... // stpasha » 01:15, 28 April 2010 (UTC)
Notation
The article presently has "Commonly the letter N is written in calligraphic font (typed as \mathcal{N} in LaTeX)." without a citation. All the sources I have use a non-script font and I have never seen it in a script font: it is certainly not common. WP:MSM says " it is good to use standard notation if you can" so why use something unnecessarily complicated, particulrly as there is no citation for this notation. Melcombe ( talk) 13:49, 18 May 2010 (UTC)
- Among those books that I currently have, the ones using the script N are:
- Le Cam, L., Lo Yang, G. (2000) Asymptotics in statistics: some basic concepts, 2nd ed. New York: Springer-Verlag.
- Ibragimov I.A., Has’minskii, R.Z. (1981) Statistical estimation: asymptotic theory. New York: Springer-Verlag.
- Other books use: either Normal(μ, σ²), or n(μ, σ²), or N(μ, σ²). // stpasha » 16:55, 18 May 2010 (UTC)
generating a gaussian dataset
I would like to generate a set of numbers (x,y) with a known mean and CV; that is, I wish to generate a set of numbers that have a gaussian distribution, where I can set the mean and CV in advance. Thanks PS: maybe it doesn't go here, but a section on curve fitting software might help (please - no"r", if you know R, you already know a lot; stuff like IgorPro or Kaleidagraph etc, or excel thanks —Preceding unsigned comment added by 108.7.0.214 ( talk) 17:34, 22 June 2010 (UTC)
- You might want to look at multivariate normal and then learn R ;) 018 ( talk) 18:03, 22 June 2010 (UTC)
OK, let's start by assuming the covariance matrix is
so that ρ is the correlation. To be continued.... Michael Hardy ( talk) 18:23, 22 June 2010 (UTC)
- ...before I go on, let me request a clarification. When you take a large random sample from a distribution with mean μ, then on average the mean of the sample will be μ, but each time you take a large random sample, the mean differs somewhat from exactly μ. Is that what you want to do or do you want the sample average to be exactly the specified value? And similarly for the variances and correlation? I can give you an algorithm for either of those. Michael Hardy ( talk) 18:57, 22 June 2010 (UTC)
- By 'CV', do you mean coefficient of variation, or covariance? If you mean coefficient of variation, do you want x and y to be correlated, or not? Qwfp ( talk) 19:22, 22 June 2010 (UTC)
Normal distribution entropy.
By definition the entropy of the Normal distribution is not negative value. But what if σ → 0 in the finite formula of entropy? Thanks. Aleksey. —Preceding unsigned comment added by Kharevsky ( talk • contribs) 08:06, 5 July 2010 (UTC)
bell curve
this article, under Definition, and the one on Gaussian function contain conflicting information on the meaning of constants a and c for the "bell curve."
— Preceding unsigned comment added by 68.37.143.246 ( talk) 01:52, 7 July 2010 (UTC)
Implementation section
Isn't this section a little much of a "how to" for Wikipedia? 018 ( talk) 17:22, 9 July 2010 (UTC)
Great, comprehensive page on the normal distribution, almost perfect. However, the detailed section on 'Gaussian' random number generators (which is also extremely informative) really does not belong in this top-level entry. —Preceding unsigned comment added by 129.125.178.72 ( talk) 16:04, 3 August 2010 (UTC)
Product of Gaussians
I was missing a reference to the product of two gaussians. This could also go into the page for the gaussian function (there is a short mention of it, no mentioning of the resulting properties), but is is also relevant here. —Preceding unsigned comment added by 134.102.219.52 ( talk) 12:34, 7 September 2010 (UTC)
Gaussian Distribution is not necessarily normal?
In the opening sentence the article states that the normal distribution is also known as a Gaussian distribution. I would argue however that the normal distribution is a special case of the Gaussian distribution, i.e. one that has an integral of 1, hence why it is called normal. The Gaussian distribution is in my opinion any general distribution described by the Gaussian function
If there aren't any objections I will edit the article to reflect this schroding79 ( talk) 00:08, 25 June 2008 (UTC)
- Huh? For something to be a probability distribution, it has to integrate to 1. As far as I am familiar, the common usage of the Gaussian distribution refers to it as a probability distribution. This also seems to be the definition used in the top few google searches I did for gaussian distribution. I concede that it possible that 'gaussian distribution' can be used in broader contexts (while the normal may not?), but I don't think this is the normal (ahem) way it is understood. So the opening sentence should remain, though a note (or footnote?) might be added later on, if you can find a good reference to back it up.-- Fangz ( talk) 00:37, 25 June 2008 (UTC)
Yes, the gaussian distribution is normal in shape. The standard normal distribution integrates to 1, whereas a frequency distribution which is normal or gaussian in shape does not necessarily integrate to 1. One aspect of interest to readers which is missing from the Wiki page about the Normal Distribution is the relationship between frequency distributions and probability distributions. Perhaps an introductory paragraph linking to Wiki pages about frequency distributions would be a good idea. It would help put this article into context. Lindy Louise ( talk) 09:58, 29 September 2010 (UTC)
- There is no such thing as “Gaussian distribution is normal in shape”, the gaussian and the normal are just two synonymous names for the same distribution. A frequency distribution is merely a histogram of the random variable, it also always integrates to one. // stpasha » 17:38, 29 September 2010 (UTC)
I disagree and am curious to know why you think a frequency distribution "also always integrates to one". A frequency distribution does not always integrate to one. A probability distribution always integrates to one. This is why we normalise the normal distribution to get the standard normal distribution: the standard normal distribution integrates to one and therefore can be used as a probability distribution. This is basic stuff but is often omitted from the more esoteric textbooks. Lindy Louise ( talk) 13:18, 30 September 2010 (UTC)
- Lindy Louise, you are right that a frequency plot sums/integrates to N (the number of units), but any and all probability distributions sums/integrates to one. This is not a special property of the standard normal. The integral of probability distribution over any range shows the probability that a random value drawn from the population will take on that value. If the integral (over all possible values) were anything other than one, the probability of drawing something when you drew something would be less or greater than one. 018 ( talk) 15:13, 30 September 2010 (UTC)
- The article frequency distribution explicitly defines this in a way that does not add to 1, but rather to the sample size. Thus frequency distribution and "probability distribution" are different. However, both "normal distribution" and "Gaussian distribution" are, in the univariate context anyway, used with identical meanings, and either can said to represent either the probability distributions or the frequency distributions of observed data, where in the latter case there is naturally a scaling by the sample size in the interpretation of "represent". Melcombe ( talk) 16:16, 30 September 2010 (UTC)
I never said the standard normal distribution was the only probability distribution that integrated to one -- obviously any probability distribution function integrates to one. Neither did I say that gaussian and normal distributions are different. I agree with Melcombe. Lindy Louise ( talk) 17:16, 30 September 2010 (UTC)
- I'm confused by your meaning then when you write, "This is why we normalise the normal distribution to get the standard normal distribution: the standard normal distribution integrates to one and therefore can be used as a probability distribution." But maybe it doesn't matter. Did you want to update the opening paragraph/article? If so, how do you want to update it? 018 ( talk) 18:51, 30 September 2010 (UTC)
Thanks O18 for your comment. I think I'm guilty of being too verbose, but I believe some readers confuse Normal Distribution with Standard Normal Distribution and I wanted to make the distinction. What I should have said is the Normal Distribution cannot be used directly as a Probability Distribution because the area under the Normal curve isn't equal to one. So we deliberately make the area under the Normal curve equal to one by doing some fancy maths: this normal distribution with an area of one is called the Standard Normal Distribution. It can then be used as a Probability Distribution simply because the area is equal to one. (In any probability system the sum of all the probabilities must equal one or, in other words, the area under a proability curve is equal to one.) Still verbose, sorry! Maybe I should have a go at updating the opening paragraph; I'll think about it. I was going to insert a link to Wiki pages about probability distributions and probability density functions but they're too difficult for non-mathematicians to understand, so I haven't. Lindy Louise ( talk) 21:29, 30 September 2010 (UTC)
- Well, I just reread the frequency distribution article, and it says that the table of frequency distributions contains either frequencies or counts of occurrences. Also if you check the frequency article, it says there are absolute and there are relative frequencies. So whether or not the frequency distribution “integrates” to one or to n is your own choice. Also, Lindy, check the definition section: standard normal is a normal distribution with mean zero and variance one. If you want to make a distinction, then the topic you are most likely looking for is called the Gaussian function. Cheers! // stpasha » 05:38, 1 October 2010 (UTC)
If you integrate an absolute-frequency distribution you will not necessarily get unity for your answer. In fact I would think it a freak event if it were to happen! The only way you can be sure of obtaining unity by integration is if you use relative frequencies or probabilities. Hence the need for the Standard Normal Distribution, because we can be sure its integral is unity. The fact that the mean and variance of the Standard Normal Distribution are 0 and 1 is a consequence of the "normalisation" or "standardisation". The mean and variance of a Normal Distribution are not 0 and 1. That's one way of distinguishing between Normal and Standard Normal. Thanks for pointing me in the direction of the Gaussian function, but I am very familiar with the gaussian and normal functions (they're the same). Lindy Louise ( talk) 21:10, 10 December 2011 (UTC)
Error in Fisher Information
Calculating out by hand, the Fisher Information in the top right box seems incorrect and should instead be Khosra ( talk) 21:33, 9 September 2010 (UTC)
- I suggest you redo your calculations. Note that the “Estimation of parameters” section gives that , and — under the efficient estimation, the variance matrix of the parameter must be equal to the inverse of the Fisher information matrix. // stpasha » 08:06, 11 September 2010 (UTC)
- Thanks for the correction. I mistakenly computed rather than . Khosra ( talk) 06:55, 20 September 2010 (UTC)
About the lead
There used to be the time when the article started with “In probability theory, normal distribution is a continuous probability distribution which is often used to describe, at least approximately, any variable that tends to cluster around the mean”. Some people tend to revert the intro back to this sentence from time to time, which is why I think an explanation is due why such sentence is inappropriate in an encyclopedia.
First it must be stated that the distribution is not merely continuous, but absolutely continuous. Absolute continuity implies that the distribution possesses density, whereas simple continuity means very little. Second, about the “any variable that tends to cluster around the mean”. This is not an informative statement. Any unimodal distribution can be said to “cluster around the mean”, and some non-unimodal distributions too. This statement is so loose that it fails to describe anything. Finally, “is often used to describe, at least approximately” is a weasel-phrase. No serious researcher will use normal distribution to describe his data, unless he has good reasons to believe that the data IS actually normally distributed. There is a good quote from Fisher about this, see the Occurrence section. // stpasha » 09:23, 2 October 2010 (UTC)
- When I put that statement there, I had no idea that it had a history of being there. It's just that the former phrase, which I see someone has reverted, is just utterly, absolutely horrible:
- In probability theory and statistics, the normal distribution, or Gaussian distribution, is an absolutely continuous probability distribution whose cumulants of all orders above two are zero.
- Keep in mind, Stpasha, that this sentence may sound fine to you, an expert in statistics, but to the average reader, it simply makes no sense. It is characteristic of a nasty trend in so many technical articles on Wikipedia, which is that they are written by experts for experts. The number of experts in any field is miniscule compared to the number of non-experts, and in any case, an expert in statistics is not likely to go reading the Wikipedia article on the normal distribution to figure out what it is. Imagine if you are an average non-expert, who might conceivably have some idea of what a probability distribution is, but maybe not, and certainly not much more -- reading this sentence you're going to think "What the hell? What does 'absolutely continuous' mean? What are 'cumulants'?" If you read the link to absolutely continuous, it makes no sense to a non-expert. Likewise for cumulants. The lead sentence is an introduction that is supposed to tell the average non-expert what a topic is about. My old lead sentence read essentially “In probability theory, the normal distribution is a continuous probability distribution which is often used to describe, at least approximately, any real-valued random variable that tends to cluster around the mean”. (Note, I added "real valued" and "random".) It tells you
- This is a continuous distribution, used to describe a real number (as opposed to a discrete distribution, a multi-variate distribution, etc.).
- This is a very common distribution, often used as a first approximation in statistics to describe any single-peaked distribution (as opposed e.g. to a multi-peaked distribution).
- Both of these facts may seem so obvious to you as not to even merit mentioning, but they are exactly what a non-expert doesn't know but needs to know. I am not opposed to other formulations of these two facts, but any lead must mention these basic facts. If you disagree with the second fact as I've stated it, figure out some other way to express it that satisfies you, but don't take it out. As for your comment about "no serious researcher ...":
- Beware of the " no true Scotsman" fallacy.
- It doesn't address the essential point, which is "as a first approximation". Plenty of statistical techniques use the normal distribution as an approximation. MCMC often uses a Gaussian as a proposal distribution. Laplace approximation approximates a posterior distribution with a Gaussian centered around the mode. Etc.
- Cumulants and absolute continuity are both advanced topics that are irrelevant to the vast majority of users and hence simply do not belong in the lead. (Note that your average college-level intro statistics course doesn't even mention either of these topics.) As for your comment about "continuous" being meaningless, I respectfully must disagree -- in common (non-expert) statistical parlance, "continuous" is the opposite of "discrete" and means that a distribution is defined by a density function as opposed to a probability mass function. This means quite a lot. If you want to state that the distribution is absolutely continuous, or has no non-zero cumulants except the first two, or any other statement that pleases experts but has no meaning to non-experts, fine -- but not in the lead. Benwing ( talk) 22:21, 2 October 2010 (UTC)
BTW, Stpasha, you might want to check out the pages WP:TECHNICAL and Wikipedia:Lead section#Introductory text, which provide guidelines on how technical articles, and particularly the lead sections, should be written. Benwing ( talk) 23:01, 2 October 2010 (UTC)
- I agree strongly with Benwing. This is one of the top hits in stats and the lead says, "go away--we don't want you, this article is just for mathematicians." I really can't make any sense of stpasha's comments about continuity vs absolute continuity. Remember, when you write something, it is to communicate something to someone else. Do you seriously believe that there exists a person who (a) understands the distinction, and (b) doesn't know that the normal is absolutely continuous? Obviously, this fact belongs way, way down in the article. 018 ( talk) 00:12, 3 October 2010 (UTC)
- I do understand that the cumulants are hard to digest, but it is the only possible way to actually define the distribution without using formulas. In most textbooks they would simply state that a normal distribution is the one with the following pdf:, and provide a formula. When you say that normal distribution “is the distribution that is often used to describe ...”, then this sentence is merely a description, not a definition. It’s like if you were writing an article about tomatoes, you’d start it with “Tomatoes are fruits that are red in color.” There are some guidelines about what the first sentence should look like, see WP:LEAD#First sentence, in particular the “If the subject is amenable to definition ...” part.
- I agree that an average reader will probably not understand what these cumulants are about. But at least the reader will know that there is something here that he doesn't understand. If you write the first sentence the way you do, then the reader will simply learn that normal distribution is the one which everybody uses, and he won’t be any wiser as to what it actually is. Moreover, he probably won’t understand the fact that he still doesn’t know what the distribution is.
- As for the absolute continuity — current Wikipedia articles don’t do a good job in explaining what that is. And in fact it might be beneficial to adopt the other terminology convention and to rename absolute continuity into simple continuity, as many probability theory textbooks do. Note also that there are in fact 3 “pure” types of random variables: continuous, discrete, and singular. The last one nobody talks about because they are impractical and very inconvenient to analyze.
- Lastly, about the “first approximation”. The normal distribution is indeed used as an approximation. Especially in the college-level textbooks and examples. The reason for this is that the normal distribution is to a certain extent the “simplest” statistical distribution. And incidentally, what makes it “simple” is the fact that it has only two nonzero cumulants. Now, this reasoning goes way deeper than any regular textbook, but it is so. And it must also be mentioned that there is no “next step” approximation -- that is, there are no distributions with only 3 nonzero cumulants, or only 4, etc.
- As for the true Scotsmen — it is a common knowledge that you really don’t want to impose such assumption in your research, unless there is just no way around it. The times have past when simple approximations where sufficient in research, now they are left only in exercises and problem sets. Note that MCMC method doesn’t assume anything — it merely uses normal as the transition density, which is done for convenience, as the result of the method does not depend on this choice. The Laplacian estimator uses the fact that certain objectives allow for quadratic expansion around the point of maximum, which translates into
local asymptotic normality and normal approximation. There are some objectives (e.g.
maximum score estimator) which do not allow such quadratic expansion, for those estimators the distribution of the Laplacian estimator will be drastically different (and more complicated). //
stpasha »
00:56, 3 October 2010 (UTC)
- stpasha, The first sentence of the guide you linked to reads, "The article should begin with a declarative sentence telling the nonspecialist reader what (or who) is the subject." mentioning cumulants totally fails this requirement. You are also confusing a
definition with what a mathematician calls a definition. I'd also point out that you are thinking of this from a very narrow part of a narrow part of the world (people with Ph.D.s in mathematics). This article is intended for a much broader audience.
018 (
talk)
03:28, 3 October 2010 (UTC)
- Well, the sentence with cumulants might be failing on the “nonspecialist” part, but the current sentence is failing on the “what the subject is” part, which is more serious. I’d be happy to have a nontechnical lead, but we cannot think of one. I did not understand your remark about the
definition — do you think that current first sentence actually defines something? //
stpasha »
05:41, 3 October 2010 (UTC)
- Stpasha, the problem here I think is that you're misinterpreting what the guideline says. What it says exactly is "tell what the subject is"; it doesn't say "define the subject precisely and in a way that uniquely characterizes the subject". These are two entirely different things. In fact, very few statistics articles include a rigorous definition of their subject in the lead. As an example, the
Student's t distribution says
- In probability and statistics, Student's t-distribution (or simply the t-distribution) is a continuous probability distribution that arises in the problem of estimating the mean of a normally distributed population when the sample size is small.
- IMO this is a well-written lead and I think most of the highly experienced WP editors would agree. This lead does not define precisely what the distribution is in a mathematical sense, but instead defines it pragmatically by describing (1) the basic properties, and (2) one of its most common uses. Note also that the guideline specifically says "[tell] the nonspecialist reader". Everything in the intro needs to be geared to the nonspecialist. This principle is emphasized over and over in all the guidelines and is by far the most important principle to stick to. In addition, as for your comment about readers not ever learning what the normal distribution "is", this doesn't make any sense to me. Note that the p.d.f. formula is given a sentence or two down. Furthermore, a definition specified in terms of cumulants is not going to help a reader who doesn't know what a cumulant is, and even if they manage to remember the cumulant-based definition, it can't reasonably be said that they "know" what the definition is. As for your comment about cumulants being "the only way to define the distribution without formulas": First, I don't see the point of this. If avoiding formulas makes the definition harder to understand than using them, by all means use them. Second of all, I don't even think this statement about cumulants is true, as you can also define the normal distribution through maximum entropy, through the central limit theorem, etc.
Benwing (
talk)
07:43, 3 October 2010 (UTC)
- I agree completely with what you said. I also wonder if a CLT based definition wouldn't be idea. That is, after all, a huge part of why this is such a popular distribution. 018 ( talk) 13:04, 3 October 2010 (UTC)
- Stpasha, the problem here I think is that you're misinterpreting what the guideline says. What it says exactly is "tell what the subject is"; it doesn't say "define the subject precisely and in a way that uniquely characterizes the subject". These are two entirely different things. In fact, very few statistics articles include a rigorous definition of their subject in the lead. As an example, the
Student's t distribution says
- Well, the sentence with cumulants might be failing on the “nonspecialist” part, but the current sentence is failing on the “what the subject is” part, which is more serious. I’d be happy to have a nontechnical lead, but we cannot think of one. I did not understand your remark about the
definition — do you think that current first sentence actually defines something? //
stpasha »
05:41, 3 October 2010 (UTC)
- stpasha, The first sentence of the guide you linked to reads, "The article should begin with a declarative sentence telling the nonspecialist reader what (or who) is the subject." mentioning cumulants totally fails this requirement. You are also confusing a
definition with what a mathematician calls a definition. I'd also point out that you are thinking of this from a very narrow part of a narrow part of the world (people with Ph.D.s in mathematics). This article is intended for a much broader audience.
018 (
talk)
03:28, 3 October 2010 (UTC)
History
Please see Anders Hald : A History of Parametric Statistical Inference from Bernoulli to Fisher, 1713-1935. He has different views than Stigler.
1774 : asymptotic normality of the posterior distribution, derivation of the constant of the normal distribution (page 38). This is the first justification of the normal distribution and first appearance of the Bayesian Central Limit Theorem
1785 : further results (page 44)
- And what makes you think that Hald is always right or clear? His book gives quite wrong impression regarding the accomplishments of Laplace. Laplace (1774) JSTOR 2245476 considered the posterior distribution in a simple binomial experiment. However he did not show asymptotic normality of the posterior, merely that its expected value converges to the “truth” with probability one. He estimated the probability of this difference being different from the probability limit, but his final formula (on p.369) is nowhere close to resembling the normal distribution. He did derive the value of the integral ∫dμ/√(lnμ), which after a change of variables becomes the Gaussian integral, however this article already mentions the fact that the integral was first computed by Laplace; and Gauss mentioned that too in his tract.
- I did not check the Laplace (1785) memoire, since I cannot find it in English translation. But it is highly unlikely he actually derived the normal distribution there. Also, Hald himself states the following: “The second revolution began in 1809-1810 with the solution of the problem of the mean, which gave us two of the most important tools in statistics, the normal distribution as a distribution of observations, and the normal distribution as an approximation to the distribution of the mean in large samples.” (p. 3). From this I conclude that the normal distribution was not actually known before 1809 as the distribution per se. // stpasha » 07:06, 4 October 2010 (UTC)
- Hello stpasha. I am not so knowledgeable but here is my point of view. 1) The article does not mention that Gauss has read Laplace (1774). Bayes (1763) was not known to the mathematicians including Laplace until the 1780's. So Gauss learned the Bayesian paradigm from Laplace (1774).
- 2) Stigler in the introduction to his translation of Laplace (1774) actually mentions the asymptotic normality of the posterior.
- 3) Laplace proved like De Moivre the validity of an approximation in large samples. This approximation is made general in Laplace (1786) and Laplace (1790a). I follow Hald's bibliography. Laplace (1790a) is a general version of the Bayesian Central Limit Theorem. Until Laplace (1790a), Laplace had not read Gauss's book. In Laplace (1786) and Laplace (1790a), the expression of the normal density is explicit. Laplace knows he approximates one distribution by another one (the integral value is 1).
- 4) By doing so, he only proves the asymptotic normality of the posterior. So the normal distribution is not yet a distribution of the errors like the Laplace distribution (1774). This is Gauss's work. However Laplace had already shown the importance of the normal distribution, as the asymptotic posterior. This is the first point of the quotation of Hald.
- 5) The normal distribution was not yet the distribution of the mean in large samples. I agree. This is later work by Laplace when he switched to the frequentist paradigm. This is the second point of the quotation of Hald.
- — Preceding unsigned comment added by 193.171.33.67 ( talk) 22:16, 5 October 2010 (UTC)
- Hello 193.171.33.67. I’m not a history expert myself, but when researching this subject I came to realize few things: (1) it is best not to rely on either Stigler’s or Hald’s opinions unless you can verify their claims by looking at the original papers, (2) history is subject to interpretation: two people using the same facts may come to different conclusions, (3) sometimes it is hard to tell whether an author understood the results of his work the same way as we understand them now (4) a publication must be judged not only by what it says, but also on what actual impact it had (poor Adrain, I feel sorry for him).
- That said, we have sources for the following publications: De Moivre (1733), Laplace (1774), and Gauss (1809). I cannot find the source for either Laplace (1786) or Laplace (1790), so there is no point in speculating what’s in there.
- Now, for Gauss the relevant sections are 175−178. He says (p.254): “the probability to be assigned to each error Δ will be expressed by a function of Δ which we shall denote by φΔ … the probability that an error lies between the limits Δ and Δ+dΔ differing from each other by the infinitely small difference dΔ, will be expressed by φΔdΔ; hence the probability generally, that the error lies between D and D′, will be given by the integral ∫φΔdΔ extended from Δ=D to Δ=D′.” Thus, in his notation φ is explicitly and unambiguously a probability density function.
- After some manipulations, Gauss concludes (p.258−259) that: “… and since, by the elegant theorem first discovered by Laplace, the integral ∫e−hhΔΔdΔ from Δ=−∞ to Δ=+∞ is √π⁄h, (denoting by π the semicircumference of the circle the radius of which is unity), our function becomes
- ”
- As you see, Gauss does cite the Laplace when it comes to the integral (which nowadays is unfairly called the Gaussian integral). However we also see that Gauss does not cite anybody regarding his function φ.
- And although this function φ was known earlier to de Moivre and Laplace, under different disguises, Gauss was the first to actually interpret it as a probability density function, as a random variable. And it is from his work that this distribution became widely known in the scientific community, and why it was called the Gaussian; whereas de Moivre’s “pamphlet for a private circulation” doesn't count. // stpasha » 23:31, 9 October 2010 (UTC)
US adult males: revisited
Can we have a less controversial example in the lead? Current one (the heights of US adult males) isn't supported by a reference, and also contradicts a later claim in the article that the sizes of biological species are distributed approximately log-normally. Besides, “US adult males” is not a sufficiently homogeneous group: variability due to race / ethnicity make it a mixture of several log-normal distributions. // stpasha » 05:33, 5 March 2010 (UTC)
- In addition to that, the phrase also presents a broken thought: "For example, the heights of adult males in the United States are roughly normally distributed, with a mean of about 70 in (1.8 m)" In what? And 70 what? Bananas? —Preceding
unsigned comment added by
201.95.183.186 (
talk)
00:24, 7 March 2010 (UTC)
- Those are inches. US adult males are just weird that way :) // stpasha »
Long ago I suggested to remove this paragraph from the lead, which suggestion was refuted on the basis that it is “the only generally understandable information” there. Now that the lead has been improved in readability, maybe it’s ok to get this piece finally out? // stpasha » 02:19, 9 October 2010 (UTC)
- No objection from me. Benwing ( talk) 03:43, 9 October 2010 (UTC)
Zero variance
I think maybe we should alter the definition to allow normal distributions with 0 variance. This is needed for consistency with the “ Multivariate normal distribution” article, where we say that a random vector X is distributed normally if and only if every linear combination of its components cX has univariate normal distribution. Since this linear combination can potentially have zero variance, such case must be allowed within the current article.
The cons for such inclusion are that we'll need to define pdf and cdf separately for the case σ² = 0. … stpasha » 20:43, 24 November 2009 (UTC)
- Yes I think this is the best option. Have two definitions for each of the PDF (as it is done now) and CDF (to do) functions with the explicit mention in the text (as it is) that they are generalised functions used to model the special case for sigma=0. This needs to be stated explicit because at the moment the article gives the impression that from the usual Gaussian pdf we can derive this particular behaviour (degenerate distribution with all the mass in mu) if we set sigma=0. —Preceding unsigned comment added by 130.236.58.84 ( talk) 10:13, 10 October 2010 (UTC)
- I think this subject should reopen. You cannot unilaterally define special formulations for the cdf and pdf as you wish in order to take care for the zero variance case. I am against such formulations that have nothing to do with the original CDF and the integral. Similar simplifications can be made for many other distributions. — Preceding unsigned comment added by 130.236.58.84 ( talk) 08:54, 9 October 2010
- And what makes you the prophet of “the original pdf and cdf”? There are many ways to define the normal distribution — see the lead section and the properties section. Most of those definitions include the
degenerate distribution (σ² = 0) as a particular case, which is why zero variance should be allowed in the definition of the normal. In particular,
- Normal distribution is the only distribution with finite number of non-zero cumulants (degenerate satisfies);
- Normal distribution is the one with maximum entropy among all distributions with given mean and variance (degenerate satisfies);
- And what makes you the prophet of “the original pdf and cdf”? There are many ways to define the normal distribution — see the lead section and the properties section. Most of those definitions include the
degenerate distribution (σ² = 0) as a particular case, which is why zero variance should be allowed in the definition of the normal. In particular,
- Well since you mention that, if the definition of the normal includes sigma=0, then the support is finite (at mu) and then over a finite support it is the uniform distribution that has maximum entropy and not the Gaussian. Of course the Dirac is also the limiting distribution for the uniform when the support is b=a. But then someone with the same thought process can say that most distributions at their degenerate form are of the same family and thus related. Be careful what kind of simplifications you make. —Preceding unsigned comment added by 130.236.58.84 ( talk) 10:02, 10 October 2010 (UTC)
- Normal distribution is the one with the characteristic function φ = eiμt − ½σ²t² (degenerate satisfies);
- Normal distribution is the limiting distribution in the CLT (degenerate satisfies);
- Zero variance should also be allowed to define the stability property
- Normal distribution is closed under linear transformations (we have to allow zero variance here, o/w not all linear transformations will lead to normal distributions)
- Normal distribution is used to define multivariate normal and infinite-dimensional normal, once again zero variance has to be allowed (ok, it actually must be allowed, otherwise you won't be able to define ∞-dimensional normal)
- Note also that both the pdf and cdf of the limiting degenerate distribution can be derived from the “regular” Gaussian pdf and cdf by taking the limit σ → 0. For the pdf see Dirac delta article (it has a nice picture), for the cdf see the Heaviside step function#Analytic approximations article.
- // stpasha » 22:22, 9 October 2010 (UTC)
I've been agnostic to the recent debate regarding whether to allow zero variance in the normal distribution. But I've rethought it, and concluded that almost certainly, we should not. The basic reason has to do with Wikipedia's "Verifiability not truth" maxim, which is a core principle ( WP:V, WP:VNT). Hence, we need to consult reliable sources, not use our mathematical intuition.
So far I've consulted two sources and they both agree that the variance must be specifically greater than, not greater than or equal to, zero. These include DeGroot and Schervish "Probability and Statistics" and Chris Bishop "Pattern Recognition and Machine Learning". I don't have any other books on hand, so I'd suggest other people check their own references. Note that on top of this, Bishop's description of the multivariate normal specifically says the covariance matrix must be positive definite, not non-negative definite. Benwing ( talk) 20:17, 10 October 2010 (UTC)
- I do agree that most reliable sources define normal distribution as the one with strictly positive variance. All those sources however are either not broad in coverage, or inconsistent. The reason why we actually have to include the zero-variance case into the definition, is because of the multivariate cases. For univariate normal you almost never encounter the zero-variance case (for example if you say that something converges to N(0,0) then it can be technically correct, but it would also mean that you have improperly normalized the sequence). However as the number of dimensions increases you become more and more likely to encounter normals with incomplete rank. The Hausman test is one prominent example. As your enter the infinite-dimensional case, then the incomplete rank actually becomes the rule. The covariance kernel of such Gaussian element is a compact operator, which means that its range is a proper subspace of the entire space, and that there is an entire subspace ℜ⊥ of elements which are orthogonal to your r.v. and whose inner-product with your r.v. will give a zero-variance normal distribution.
- It is not surprising that those people who talk about the univariate normal never look as far ahead as into the ∞-dimensional case. Neither it is surprising that those people who discuss the ∞-dimensional normals consider the univariate case so trivial that they don't even bother to define it (see e.g. the Handbook of Econometrics, chapter 77, def.2.4.3). However in order for the Wikipedia to be consistent, zero variance case must be allowed in the definition. // stpasha » 00:58, 11 October 2010 (UTC)
- OK then, at least we need to have a section indicating why we define the normal distribution differently from the textbooks. It still makes me uncomfortable as it has a whiff of original research, but i'll defer to your expertise. Benwing ( talk) 03:28, 11 October 2010 (UTC)
Right then now lets all stop complaining and help me write the Frechet distribution article which needs some work :) (its useful for Extreme Value theory). —Preceding unsigned comment added by 130.236.58.84 ( talk) 08:37, 11 October 2010 (UTC)
- I disagree with stpasha on this on two fronts. First, that this isn't OR unless he can point to an article that points this issue out. Is it really a problem for Wikipedia to make the same mistake as everyone else? Second, I think the degenerate distribution should NOT be in the probability box--it will just confuse people. I think that if we do include it, it should be sequestered in one section with an explanation of why it is there. But again, unless there is a good ref, it is OR and we need to boot it. 018 ( talk) 03:33, 12 October 2010 (UTC)
- Also, can you write down the exponential family when the variance is zero? If you can't, does this mean that the normal only usually has an exponential family form? 018 ( talk) 03:37, 12 October 2010 (UTC)
- Well, I'm the guilty party who stuck those on, on the theory that the PDF and CDF formulas ought to agree with how the support and parameter domain are given. In truth, I would rather that they all be gone; I agree with you, 018, that not sticking with what the standard references say is OR.
- Stpasha - perhaps a compromise that would satisfy you is to take all the zero-variance stuff out of the definition (we really do need to follow what the standard sources say, regardless of the mathematical issues), but include a section describing (1) that the normal distribution can easily be extended to include the zero-variance case, with the relevant formulas provided; (2) that, although the standard sources don't do it, there are a number of mathematical reasons why it makes sense to extend the definition to include the zero-variance case, and for certain applications (e.g. infinite-dimensional Gaussian distributions) you must do so in order to maintain mathematical consistency. This way we simultaneously avoid having the definition go against the standard sources, but include the concerns you've brought up. Benwing ( talk) 07:47, 13 October 2010 (UTC)
- Well, I don't mind delegating this issue to a subsection — as long as it stays somewhere... //
stpasha »
08:56, 13 October 2010 (UTC)
- Okay, I removed them from the top. They are still in the pdf and cdf sections, but I think they should go from there too. I also would like to see a source before we add even a section about this issue stpasha is raising. 018 ( talk) 15:54, 13 October 2010 (UTC)
- Well, I don't mind delegating this issue to a subsection — as long as it stays somewhere... //
stpasha »
08:56, 13 October 2010 (UTC)
"standard normal" or "the standard normal"
The annotation on my change got messed up accidentally. What I was trying to say was that "blah blah blah is called standard normal" sounds wrong vs. "blah blah blah is called the standard normal". But I don't know what's the "correct" convention (if there even is any at all). Benwing ( talk) 08:56, 10 October 2010 (UTC)
- I'm not a native speaker, so don’t trust my judgement too much; however it seems to me that there is “the standard normal distribution” (since it’s unique), and there is “a standard normal random variable” (since there could be many of those). // stpasha » 01:02, 11 October 2010 (UTC)
- Your judgments sound fine to me. Benwing ( talk) 03:30, 11 October 2010 (UTC)
- I agree with stpasha, his reasoning is sound and this is the convention that I have heard used. 018 ( talk) 15:57, 13 October 2010 (UTC)
Is this accurate?
I am reading this in the text: "In addition, the probability of seeing a normally-distributed value that is far (i.e. more than a few standard deviations) from the mean drops off extremely rapidly. As a result, statistical inference using a normal distribution is not robust to the presence of outliers (data that is unexpectedly far from the mean, due to exceptional circumstances, observational error, etc.). When outliers are expected, data may be better described using a heavy-tailed distribution such as the Student’s t-distribution"
I am just wondering if this is accurate? My understanding of robust to outliers means that the model assigns very little (or zero) probability to values far away from the mean. So yes I think the heavy-tailed comment is correct but the first sentence should be "In addition, the probability of seeing a normally-distributed value that is far (i.e. more than a few standard deviations) from the mean drops off relatively slowly. As a result..."
For example from the article about the laplacian The pdf of the Laplace distribution is also reminiscent of the normal distribution; however, whereas the normal distribution is expressed in terms of the squared difference from the mean μ, the Laplace density is expressed in terms of the absolute difference from the mean. Consequently the Laplace distribution has fatter tails than the normal distribution.
So for example if we wish to use a more robust norm for the outliers we would use the L1 norm which leads to the Laplace (from a MLE point of view). But perhaps I am wrong. What does everyone else think? —Preceding unsigned comment added by 130.236.58.84 ( talk) 10:38, 10 October 2010 (UTC)
- No, you have it backwards. "Heavy-tailed" means "has relatively more mass in the tails", as you'd expect. The reason the Student's T is robust to outliers is because of this; if you are trying to estimate the mean, and you have an outlier, the fact that the outlier is assigned relatively high probability means that the mean value is not pulled way off. In a light-tailed distribution, an outlier will drag the mean way far from where the mean of all the other points is, simply because otherwise the MLE would be too small. Benwing ( talk) 20:12, 10 October 2010 (UTC)
Electron Orbitals
I removed the example of an electron in a 1s orbital being Gaussian. The distribution (for an electron in a 1/r Coulomb potential) is actually proportional to e-r. If I think of a similar example, I will add it in, because it was very striking! 128.111.10.89 ( talk) 13:25, 30 October 2010 (UTC)
Image Curve percentages wrong
The image in "Standard deviation and confidence intervals" part has wrong percentages. I suggest to change it with the image in Standard Score one or another, more accurate one. —Preceding unsigned comment added by 77.49.4.13 ( talk) 21:36, 10 December 2010 (UTC)
- The percentages on the picture you mentioned are accurate, at least up to 1 decimal digit. The image in the standard score article is nearly unreadable at the thumbnail size, and overfilled with unnecessary details. I have restored the original image now. // stpasha » 04:27, 13 December 2010 (UTC)
Explanation on the rounding of the amount of data withing 1,2,3 standard deviations.
Here is the text after I changed it, I added the exact numbers in bold, which should explain why I choose to correct the article to it's current number rounding scheme:
- Dark blue is exactly or less than one standard deviation from the mean. For the normal distribution, this accounts for 68.27% (0.6826895) of the set, while two standard deviations from the mean account for about 95.45% (0.9544997), and three standard deviations account for about 99.73% (0.9973002). Outliers,the values that deviate more than three standard deviations, account for 0.27% (0.002699796) of the distribution
If any one thinks this should be changes - please explain why - I'd be happy to know. Talgalili ( talk) 09:12, 11 December 2010 (UTC)
- The simple reason that should change is that these are the correct numbers. And the empirical rule ISN'T ANY LINK WITH NORMAL DISTRIBUTION. This has to be with SYMMETRICAL distribution, which resembles to it, bcs have coefficient of
skewness γ1 both zero, but NORMAL DISTRIBUTION also has the plus that has coefficient of kyrtosis β2 3, while symmetrical doesn't. This is a tragic mistake that leads to misleading of everyone. the 68-95-99.7 rule is valid FOR SYMMETRIC DISTRIBUTIONS, BUT NOT TO NORMAL DISTRIBUTION. —Preceding
unsigned comment added by
194.219.39.170 (
talk)
22:33, 13 December 2010 (UTC)
- Hi there - could you please give some reference to your claim. Since I fail to understand in what way rounding 0.9544997 to 95.45% instead of 95.44% is wrong - I would like some further help in understanding. Thank you for your help in this. Talgalili ( talk) 07:14, 14 December 2010 (UTC)
- The simple reason that should change is that these are the correct numbers. And the empirical rule ISN'T ANY LINK WITH NORMAL DISTRIBUTION. This has to be with SYMMETRICAL distribution, which resembles to it, bcs have coefficient of
skewness γ1 both zero, but NORMAL DISTRIBUTION also has the plus that has coefficient of kyrtosis β2 3, while symmetrical doesn't. This is a tragic mistake that leads to misleading of everyone. the 68-95-99.7 rule is valid FOR SYMMETRIC DISTRIBUTIONS, BUT NOT TO NORMAL DISTRIBUTION. —Preceding
unsigned comment added by
194.219.39.170 (
talk)
22:33, 13 December 2010 (UTC)
- And I wonder what exactly do you mean by "the correct numbers"? 68% is the correct number for the probability that a normal r.v. lies within one standard deviation from the mean. And so is 68.27% is correct, and 68.2689492137% is also correct. Neither of those numbers are precise, however. The precise number is equal to erf(1/sqrt(2)), which is a transcendental number and cannot be written exactly in decimal notation. It's of course a matter of style how many decimal digits to give, which is why we give less precise number (68%) first, and then much more precise (68.2689492137%) later in the table. And FYI, the 68-95-99.7 rule is NOT valid for any symmetrical distribution. Of course, one can easily construct examples of non-normal distributions where this rule holds, which may or may not be symmetric, but how exactly it stops the rule being a relevant link for this article? // stpasha » 20:59, 14 December 2010 (UTC)
the distribution of 1/X
if X is normal, then what is the distribution of 1/X????? It is good to include this. even there is not solution to it. Jackzhp ( talk) 23:34, 28 December 2010 (UTC)
You transform it to u=1/x and you make calculations —Preceding unsigned comment added by 79.103.101.115 ( talk) 19:52, 9 January 2011 (UTC)
Someone has been messing around with this page, adding obscenities.
e.g . Under 'definition' there is 'The factor fuck you man in this expression ensures that the total area under the curve '
The page should be restored to its former condition.
- Someone named Roger Carpenter called this distribution the "recinormal" distribution. The PDF is easy to write down, something like
But who knows what its properties are. You can plot it in R and it has a somewhat weird shape -- it has two modes on each side of the origin, is heavily skewed to the right (or to the left, on the negative side of the origin), and near the origin it drops suddenly and then has what looks like a completely flat section at 0 height near the origin. Benwing ( talk) 22:09, 9 April 2012 (UTC)
Like this:
mathworld
Are all of the references to Mathworld/Wolfram really needed? See footnotes 12, 15, 16, 16, 26, and below the footnotes Weisstein, Eric W. "Normal distribution". MathWorld. Do all of these contribute something that is not already covered in the article? Mathstat ( talk) 23:49, 27 February 2011 (UTC)
- Well, they are all references, their purpose is not to add something new to the article, but to back up claims made in the article. One may ask whether or not these references are reliable and trustworthy, or whether there are any better references to replace them, but as of right now all footnotes that you listed are doing their job. // stpasha » 01:32, 28 February 2011 (UTC)
Merging with gaussian function
- removed misplaced merge template for merge from Gaussian function
The Gaussian function does also have numerous applications outside the field of statistics, for example regarding solution of diffusion equations and Hermite functions and regarding feature detection in computer vision. If this article would be merged under normal distributions, these connections would be lost. Hence, I think that it is more appropriate to keep the present article on the Gaussian with appropriate cross referencing and developing the article further. Tpl (talk) 11:53, 8 June 2011 (UTC)
- Merge templates go on articles not discussion pages. This has all be discussed before on the articles' talk pages, and rejected. Melcombe ( talk) 14:48, 8 June 2011 (UTC)
Incorrect Kullback-Leibler divergence
The Kullback-Leibler divergence quoted in the article appears to be incorrect. In particular the log(sigma_1/sigma_2) term should not be in the brackets. It would be useful for someone to confirm this. The source quoted appears to be correct: http://www.allisons.org/ll/MML/KL/Normal/ Egkauston ( talk) 07:32, 29 November 2011 (UTC) Update: I checked again and I was wrong. The entry appears to be correct. Egkauston ( talk) 07:51, 29 November 2011 (UTC)
Common misunderstanding about PDFs
In the figures, it would be nice to show some Normal probability density function with mean and standard distribution values such as the maximum value would be higher than 1; for example, mu = .05, sigma = .003. The density can take values higher than 1; the constraint is for the cumulative density function (area under the PDF), which cannot exceds 1. It is a fairly common confussion between PDF and CDF, and I believe it is worth to remark. — Preceding unsigned comment added by 190.48.106.19 ( talk) 03:49, 25 July 2012 (UTC)
main equation
Hi, can someone check the main equation at the top of the page. I may be misunderstanding it, but its a probability distrubition so shoulden't a curve using it sum to 1? I put it into R and came out with 0.2. Checking on wolfram mathworld they use a slightly different equation. I may simply have misunderstood! Kev 109.12.210.202 ( talk) 09:07, 4 August 2012 (UTC)
Graph
The graph at the top of the page is good for the article. Thanks for having it there. It identifies the red curve as the standard normal distribution. Can the graph's author or a responsible party also identify and label the other curves, please? Thank you. 69.210.252.252 ( talk) 21:44, 15 August 2012 (UTC)
Please clarify figure caption
In the "Central Limit Theorem" section, the caption for the "De Moivre-Laplace" figure mentions "the function". It would be helpful if it were specified what function is meant. As it stands, the figure does not really aid understanding of the CLT. — Preceding unsigned comment added by 193.60.198.36 ( talk) 15:56, 26 November 2012 (UTC)
Hi there, just noticed there's an error in an equation in "Estimation of parameters" and it's not displaying properly. Not sure how to fix it or anything, but there it is. — Preceding unsigned comment added by 97.65.66.166 ( talk) 19:21, 25 March 2013 (UTC)
Clarification needed
It should be noted that the Normal Distribution Function comes from the Stirling's approximation applied to the Binomial distribution (deMoivres-Laplace: http://en.wikipedia.org/wiki/De_Moivre%E2%80%93Laplace_theorem.) In the binomial distribution, the probability of "each outcome" is known. That is Binomial distribution builds on that fact that "I can get k successes in n trials where each event has a probability p", and I plot the value of E(k) versus k. When I carry this to the Stirling approximation to form the Normal Distribution function, I assume each independent event has the same "p". What is this "p" that I refer to now in the context of a normal distribution function? In other words are the trials still "Bernoulli"? If yes what is the p used in the context of NDF.
If however one is simply assuming this is "distribution" function and the central limit theorem is just a coincidence, then note that most derivations of the central limit theorem also build from Binomial distribution. Can someone please clarify what is "Bernoulli" about the trails in that case? Is each E(x) associated with x still representing a success of a "Bernoulli outcome" at all??? The literature on this page, and the "central limit theorem" is not clear and is recursive..and always points back to Demoive-Laplace Theorem only.
An independent proof of the "Central limit Theorem", not relying on Binomial distribution would also help clarify this circular reference.
-Alok 11:31, 19 July 2013 (UTC) — Preceding unsigned comment added by Alokdube ( talk • contribs)
It should also be noted that wikipedia does not in anyway state that Normal Distribution function is sacrosanct but most text books and academicians tend to do so. However it would be really great if someone can show the assumptions made in the approach. -Alok 23:10, 23 July 2013 (UTC) — Preceding unsigned comment added by Alokdube ( talk • contribs)
A simpler formula for the pdf - should it be in this article?
The PDF can be re-arranged to the following form:
where Z is the Standard score (number of standard deviations from the mean). This makes it pretty obvious that the pdf is maximal when is small (narrow distribution) and when is small (towards the center of the distribution). I find this notation way simpler and more intuitive than the standard formula for the pdf. Should we include it in the main article (and where?) for the pedagogical purpose? — Preceding unsigned comment added by 129.215.5.255 ( talk) 10:46, 30 October 2013 (UTC)
Normal Sum Theorem
The normal sum theorem for the sum of two normal variates is discussed in Lemons, Don (2002). An Introduction to Stochastic Processes in Physics. John Hopkins. p. 34. ISBN 0-8018-6867-X.. The proof of the theorem shows that the variance for the sum is the sum of the two variances. However, this doesn't prove the distribution for the sum is a normal distribution since more than one distribution can have the same variance. -- Jbergquist ( talk) 06:18, 30 November 2013 (UTC)
- If x and y have normal distributions with zero means and standard deviations of σ and s respectively, the probability density for all combinations of x and y is just the product of the two normal distributions. One can then show that the probability distribution for z=x+y is a normal distribution with mean zero and variance σ2+s2. The proof involves transforming the joint probability density to a new set of variables, z=x+y and w=x-y, then integrating over all values of w to get the probability density for z. -- Jbergquist ( talk) 02:50, 2 December 2013 (UTC)
Who is this Article for?
Would it be fair to say that few if any math majors turn to Wikipedia for help in their chosen field? If so, who exactly is this article written for? Unless they have post-secondary studies in Math, few people would have the knowledge or time to comprehend any of the terms used & these beginners, I would submit, are the vast majority of those who click on this article. We would just like, in layman's terms, an explanation of Normal Distributuion. Instead we've found a long, specialized article written for no one. — Preceding unsigned comment added by 96.55.2.6 ( talk) 22:40, 26 March 2013 (UTC)
- Agreed.
Livingston
08:51, 21 April 2013 (UTC)
- Thirded. The article should begin with an intuitive explanation. It is far too technical right from the start.
Plantsurfer (
talk)
11:12, 21 April 2013 (UTC)
- While I am here, an animated figure of the kind shown at right has great potential to communicate what a normal distribution is, but it is a great pity that the values that are contributing to the curve are at discrete, symmetrical intervals, and that they perfectly fit the normal curve right from the outset. That is not how it works. It would be a lot better to have a similar graphic based on a real or realistically modeled data set.
Plantsurfer (
talk)
11:21, 21 April 2013 (UTC)
- Wikipedia is not a textbook, nor is it a teacher. The article simply describes what normal distribution is, and its mathematical properties. That's the point of this site: to describe what *is*. And if, in certain subjects such as physics or mathematics, what *is* is difficult for the average person to understand, that's their problem. JDiala ( talk) 06:14, 3 January 2014 (UTC)
- While I am here, an animated figure of the kind shown at right has great potential to communicate what a normal distribution is, but it is a great pity that the values that are contributing to the curve are at discrete, symmetrical intervals, and that they perfectly fit the normal curve right from the outset. That is not how it works. It would be a lot better to have a similar graphic based on a real or realistically modeled data set.
Plantsurfer (
talk)
11:21, 21 April 2013 (UTC)
- Thirded. The article should begin with an intuitive explanation. It is far too technical right from the start.
Plantsurfer (
talk)
11:12, 21 April 2013 (UTC)
You have links to the terms you don't understand. Also, N is an advanced subject in itself. i.e. it can not be simplified without being hollow and meaningless. Read about other types of distributions first if you want simpler examples of that type of math. The reason for the complexity, or rather lack of a comprehensive explanation for it, is that the distribution is not human constructed but an observed reality of life. It just happens to work for many common situations. -- 5.54.91.60 ( talk) 20:03, 21 June 2013 (UTC)
I'm confused. Shouldn't the ERF function be defined as ERF(a,b) = integral between a and b, instead of ERF(x) = integral between -x and +x? This would then allow for the proper definition of the CDF function as ERF(-infinity, x) instead of defining it as a single value function. Maybe the error introduced by using -x instead of -infinity is small.
130.76.64.109 ( talk) 16:15, 4 July 2013 (UTC)
I add to this, I'm a 4th year engineering student, and even then, this is going right over my head, it doesn't help that the way the formulas are shown, they cannot be selected, and as can be seen here,
Is the root function to the power of e, or is the whole term multiplied by e? — Preceding unsigned comment added by 114.76.42.246 ( talk) 23:29, 20 March 2014 (UTC)
Use of double factorial
Double factorials seem to be uncommon in mathematics, it may help with the exposition if the double factorials were replaced by their explicit formula MATThematical ( talk) 23:21, 9 May 2014 (UTC)
Normal curve never touches X axis
Normal curve never touches X axis. It was touching X axis in two figures which I have removed from the article. I would like to discuss on this point if someone has other opinion / reference. Thanks. -- Abhijeet Safai ( talk) 09:31, 29 May 2014 (UTC)
- The center of the lines used to draw the figures never touch the x axis either. The lines have to be a certain thickness, or you couldn't see them. So part of the line used to draw them will touch the x axis. There is no other way to draw them. Restoring the figures. PAR ( talk) 13:04, 29 May 2014 (UTC)
Produced normality: simpler than Box-Müller
sqrt(-2*log(rand()))*cos(2*pi*rand()) — Preceding unsigned comment added by MClerc ( talk • contribs) 19:55, 6 August 2014 (UTC)
Produced normality
1. Cite on any regression can achieve normal residuals with proper modeling, please.
2. Some regressions explicitly assume other distributions, of course. Probit and logit come to mind.
3. I've seen weighting procedures to adjust for skewed residuals. But if the residuals have a kurtosis other than 3, how can normal kurtosis be achieved?
4. I'd like to keep this category under the Occurrence heading, but I'm honestly unclear about the proper treatment.
Everyone believes in the Gaussian law of errors, the experimenters because they think it is a mathematical theorem, the mathematicians because they think it is an empirical fact. Kennedy, quoting Poincare, but see this elaboration: http://boards.straightdope.com/sdmb/showpost.php?p=14046385&postcount=33. Measure for Measure ( talk) 20:56, 17 August 2014 (UTC)
Images
Hello everybody,
I've just created an image that could replace another image in this article:
-
Old
-
New
I think the new image is better, because
- it doesn't have background
- it's a little bit easier to read
- the digits are aligned
- the SVG is valid
- the image can be created directly from the source code that is available in the description (without editing it any more)
- the looks more like an x and less like a (chi)
And it also has a CC0 license.
I could also re-make the other image in the same "style".
Best regards, -- MartinThoma ( talk) 19:38, 29 August 2014 (UTC)
- @ MartinThoma: It looks great! Thanks! Paul2520 ( talk) 20:02, 29 August 2014 (UTC)
Characteristic function is *inverse* Fourier transform
According to the Characteristic function (probability theory) page, the CF of a distribution is the inverse Fourier transform of the PDF (and therefore the frequency-domain PDF is the Fourier transform of the time-domain CF ). We could just change instances of "Fourier transform" to "inverse Fourier transform", but the page goes on to say "...normal distribution on the frequency domain", so this we should also change to "...normal distribution on the time domain". I'm not missing something here, am I? Tsbertalan ( talk) 23:42, 4 December 2014 (UTC)
CDF Function
The Pascal CDF function, as shown does not translate the formula shown above it. As near as I can tell, it does not provide a correct result. I suggest that for this and other examples you use a more commonly used language: C or C++. — Preceding unsigned comment added by Statguy1 ( talk • contribs) 06:45, 16 February 2015 (UTC)
The Pascal code does not account for the double factorial in the denominator. This approximation of the CDF function is also given (with a reference) elsewhere in this WikiPedia article Normal_distribution#Numerical_approximations_for_the_normal_CDF — Preceding unsigned comment added by 138.73.5.2 ( talk) 15:02, 22 October 2015 (UTC)
Univariate Random Variables Terminology
The top line states "This article is about the univariate normal distribution", yet the description is in terms for 'random variables', (plural) i.e. the multivariate case. I'm not sure if the plural usage 'random variables' is a formal math usage I'm not familiar with, a british/american usage difference, or just poor usage. Also, the lead paragraph does not directly state what the Normal Distribution is, but infers the definition from the CLT. I suggest restating and splitting the 2nd lead paragraph as below, and submit it to discussion here first.
-Orig The normal distribution is remarkably useful because of the central limit theorem. In its most general form, under some conditions (which include finite variance), it states that averages of random variables independently drawn from independent distributions converge in distribution to the normal, that is, become normally distributed when the number of random variables is sufficiently large. Physical quantities that are expected to be the sum of many independent processes (such as measurement errors) often have distributions that are nearly normal.[3] Moreover, many results and methods (such as propagation of uncertainty and least squares parameter fitting) can be derived analytically in explicit form when the relevant variables are normally distributed.
-Rework The normal distribution is defined by the central limit theorem. Generalized, it states, under some conditions (which include finite variance), that the distribution of averages of a random variable independently drawn from independent distributions converge to the normal distribution, when the number of samples is sufficiently large.
Physical quantities that are expected to be the sum of many independent processes (such as measurement errors) often have distributions that are nearly normal.[3] Moreover, many results and methods (such as propagation of uncertainty and least squares parameter fitting) can be derived analytically in explicit form when the relevant variables are normally distributed. LarryLACa ( talk) 03:47, 13 October 2015 (UTC)
- The term random variables does not commit to what type of variables we are talking about, only how many of them (more than one). There can be one univariate RV, multiple univariate RVs, one multivariate RV (i.e., a random vector), or multiple multiviarate RVs. Incidentally, in your rework, the phrase "the distribution of averages of a random variable" sounds quite awkward to my American ears. I get what you're trying to do here, but I don't think your reworked version is actually better than the original. - dcljr ( talk) 22:02, 6 November 2015 (UTC)
Gaussian Distribution
One of the most famous and used distribution by scientist is bell type distributions. It is desired since it goes from maximum to minimum and vice versa. Distribution of phenomena and mathematical modeling can appear very easily.
Read more on reference: http://mathworld.wolfram.com/NormalDistribution.html
MansourJE ( talk) 21:47, 14 April 2016 (UTC)
Misuse or manipulation of the normal distribution
The applications are briefly touched on, but the danger of misapplication is completely ignored.
MansourJE ( talk) 17:18, 14 April 2016 (UTC)
- Indeed it is ignored by the so-called mainstream economics.-- 5.2.200.163 ( talk) 11:12, 22 July 2016 (UTC)
Figure in "Standard deviation and coverage" section - vertical lines should be equally spaced
Hello, For the figure in the "Standard deviation and coverage" section, the vertical lines should be equally spaced. — Preceding unsigned comment added by 99.226.5.121 ( talk) 21:31, 8 February 2017 (UTC)
This article is very good, clear citation, the math is correct, has very reliable references. But it doesn't mention that Gaussian Distribution has a widely application in air pollution transportation model and diffusion model.
Jiamingshi (
talk)
05:35, 28 April 2017 (UTC)
At zero
Also the reciprocal of the standard deviation might be defined as the precision and the expression of the normal distribution becomes
According to Stigler, this formulation is advantageous because of a much simpler and easier-to-remember formula, the fact that the PDF has unit height at zero,
Well:
- (in general)
and also for
So??? Madyno ( talk) 15:04, 11 May 2017 (UTC)
Transform
I think the formula for the Fourier transform is not in line with the definition in the lemma of Fourier transform. Madyno ( talk) 10:44, 22 October 2017 (UTC)
Bell Curve
I am sure this article is very good, but I came to this page to find out why a Bell curve (or bell curve) is called as it is. Is it named after a shape or the person who first devised it or what? And maybe the article should say so? Kiltpin ( talk) 12:16, 27 October 2016 (UTC)
- The bell curve is called bell curve, because it looks like the silhouette of a (church) bell. Any kind of sigmoid curve will result in a bell curve if looked at the first derivative of that sigmoid or S-curve. -- Gunnar ( talk) 18:26, 4 November 2018 (UTC)
Standard notation for standard normal distribution
or
I like the first version more, as it looks more clearly arranged. -- Gunnar ( talk) 18:36, 4 November 2018 (UTC)
- Agree - I don't like lazy fractions. — Preceding unsigned comment added by Constant314 ( talk • contribs) 20:39, 4 November 2018 (UTC)
Edits
1. The entropy H, as a function of the density f, is called a functional.
2. The symbol d in an integral expression is a kind op operator, not a variable, and hence not set in italic. Madyno ( talk) 21:24, 14 June 2019 (UTC)
- @ Madyno: Look at the edit summaries; the first complete revert was a misclick thanks to WP:TW jumping in the way; I undid that so I could simply undo the changes to the d's. For that, see MOS:MATH#Roman versus italic. – Deacon Vorbis ( carbon • videos) 21:28, 14 June 2019 (UTC)
Okay, matter of taste. Madyno ( talk) 21:33, 14 June 2019 (UTC)
Useful Relation
I miss the useful relation — Preceding unsigned comment added by 141.23.181.132 ( talk) 16:34, 18 August 2019 (UTC)
- You mean, if then Or, moreover, But this is written, see "General normal distribution". Boris Tsirelson ( talk) 16:50, 18 August 2019 (UTC)
Quantile function
The section on the quantile function defines to be , but then 2 lines later uses to mean something related but different, without warning. Fathead99 ( talk) 15:17, 28 July 2017 (UTC)
- Why without warning? It is written clearly that the first is the quantile function of the standard normal distribution N(0,1), while the second is the quantile function of another (not standard) normal distribution N(μ,σ2). Boris Tsirelson ( talk) 20:12, 18 August 2019 (UTC)
Purely educational
Regarding diagrams of different PDFs: There should be a curve here with a maximum value above 1, just to illustrate that it is possible. — Preceding unsigned comment added by 2001:4643:E6E3:0:2C29:9E4F:EDF9:AD78 ( talk) 13:19, 12 September 2019 (UTC)
Another potentially Useful Measure
I'm missing the average deviation from the mean. Its simply sqrt(2/pi) * sigma ~ 0.797 sigma (see https://www.wolframalpha.com/input/?i=2+*+integral+from+0+to+infinity+of+x+*+exp%28-%28x%2Fsigma%29%5E2%2F2%29+%2F+%28sigma+*+sqrt%282+pi%29%29 ) This measure may not be a widely used quantity among mathematicians, but it's what less-mathematically-inclined people tend to report (e.g. bsc students, bankers etc)
May I add this to the table at top right? If so, how? Michi zh ( talk) 12:16, 7 January 2020 (UTC)
- @
Michi zh:
{{
Infobox probability distribution}}
doesn't have an entry for this, so there's currently no way to add it here, unless you also modify the infobox. That's probably not a great idea since this is such an unusual measure. I'm curious why you think less mathematically inclined people would prefer it (and what do you mean by "report"?). It's almost always more difficult to calculate then the std dev/variance. – Deacon Vorbis ( carbon • videos) 14:18, 7 January 2020 (UTC)- True, "more difficult to calculate" in the theory, but true as well, it is widely used in applications. And in the theory it is called the first absolute central moment.
Boris Tsirelson (
talk)
16:34, 7 January 2020 (UTC)
- Yeah, that's the name I couldn't quite remember, thanks. (And it's already in the article body anyway at least). – Deacon Vorbis ( carbon • videos) 16:43, 7 January 2020 (UTC)
- @ Deacon Vorbis: Thanks for checking in and explaining how to do this, and thanks Boris Tsirelson for explaning!
- RE whether to go down that route, I would actually argue yes. Let me explain:
- The reason is that even Engineering MSc's (who have taken hours of statistics classes) routinely come up with this measure to summarize their data, and from people with less statistical training I hardly see anyone calculating variance. (Think about it: If you compare the two methods to assess spread of data, "ignoring the minusses" is far easier than taking the square (which is an actual calculation you'd need paper for). Now as an engineer who loves the utility of statistics, I need to translate the number people give to me into an estimate of the far more useful variance (which is why I came here).
- RE this table, my understanding is that it has a whole bunch of entries hardly anyone ever needs (sorry to call mathematicians "hardly anyone", but compared to quite a few "commoners" reading this page, mathematicians really are select few). Consequently, it should also contain this info that pertains many commoners, and yes, since this is the most important distribution, I would consider it ok to add it to the infobox that's used for all distributions, if that's what's needed. Does this make sense?
Michi zh (
talk)
20:04, 9 January 2020 (UTC)
- I'd say, taking the square is a small problem; low
robustness of the sample variance is a bigger problem, since incorrect observations may occur in practice .
Boris Tsirelson (
talk)
21:44, 9 January 2020 (UTC)
- Thanks for the input Boris Tsirelson but either I don't understand it, or we're digressing. I wanted to put the "mean average deviation" or as you said it is mathematically called "first absolute central moment" into the list, not the variance...
- To get back to topic and since no-one's spoken against it, I'll now try to find where around
{{
Infobox probability distribution}}
I can place this suggestion. Cheers! Michi zh ( talk) 20:10, 12 January 2020 (UTC)
- I'd say, taking the square is a small problem; low
robustness of the sample variance is a bigger problem, since incorrect observations may occur in practice .
Boris Tsirelson (
talk)
21:44, 9 January 2020 (UTC)
- True, "more difficult to calculate" in the theory, but true as well, it is widely used in applications. And in the theory it is called the first absolute central moment.
Boris Tsirelson (
talk)
16:34, 7 January 2020 (UTC)
So the deed is done! I hope other people find it useful too! Feel free to delete this section if it's not necessary anymore. Best Michi zh ( talk) 22:37, 16 January 2020 (UTC)
The MAD is an acronym for several different measures (e.g. mean absolute deviation but also the median one). Please make sure to link the name to the specific definition used. Thanks. Tal Galili ( talk) 05:18, 17 January 2020 (UTC)
- I'm confused Tal Galili, as I'd done this already. If this is a polite request for correction, pls confirm (and probably I'll need a little more info as to what is unspecific about the link I put). Thanks! Michi zh ( talk) 12:43, 4 February 2020 (UTC)
- Hey, the page you link to says explicitly that it is not about a specific measure. I suspect you are using the mean abs deviation from the mean. I think it should be made clear. I'm suggesting to make the wikilink you use be to a more specific definition. Cheers, Tal Galili ( talk) 22:21, 4 February 2020 (UTC)
Possible error
Could someone check the table of values? They seem to be wrong. — Preceding unsigned comment added by Piqm ( talk • contribs) 19:05, 2 November 2020 (UTC)
Probability Density Function
For some displays (like mine) the negative sign in the exponent doesn't show properly unless you've zoomed in. I'm not savvy enough to fix it — Preceding unsigned comment added by 2603:8080:1540:546:3175:C96:9C96:B48C ( talk) 20:58, 6 December 2020 (UTC)
This appears to be a bug with Chromium (FF and Safari show the minus properly). Logged a bug, let's see if it's fixable by Chromium: https://bugs.chromium.org/p/chromium/issues/detail?id=1159852 — Preceding unsigned comment added by 84.9.90.236 ( talk) 17:13, 17 December 2020 (UTC)
Sine wave?
Is a sine wave of one period ( example) a type of bell curve? I didn't see it mentioned anywhere in the article. ➧ datumizer ☎ 13:16, 26 December 2020 (UTC)
- I should clarify that Bell curve redirects here. ➧ datumizer ☎ 13:23, 26 December 2020 (UTC)
I've only ever seen the term "bell curve" applied to an actual normal curve or to a curve that is close to normal in some sense. The restricted sine you mention would not qualify. FilipeS ( talk) 05:26, 30 December 2020 (UTC)
Asymptotic behaviour
I feel the article is incomplete without some mention of the asymptotic behaviour of the tails of the curve. — Preceding unsigned comment added by 77.61.180.106 ( talk) 18:26, 11 January 2021 (UTC)
Simple description
This article is terrible if you don't have advanced level maths already. There's not even an attempt to explain it in simple English (yes, I'm aware of Simple English Wiki; that version of this article is also not in Simple English). Who is the target audience of this article? People who already understand this sort of maths? I'd be surprised if even 5% of readers would learn anything from reading this article, I certainly haven't. — Preceding unsigned comment added by 217.155.20.204 ( talk) 14:18, 14 October 2020 (UTC)
Absolutely agree, Wikipedia is meant to be an accessible resource for finding out about something you don't know. Not a reminder for people with technical knowledge. This article is effectively useless, a school student stopping in here is going to take one look and navigate away. — Preceding unsigned comment added by 122.62.34.148 ( talk) 08:12, 11 March 2021 (UTC)
Tail bound / concentration inequality
I quickly tried searching for tail bound but I saw no mention of tail bounds or concentration inequalities, which are very useful. The most useful being ones like
for one tail and twice for both tails.
See http://www.stat.yale.edu/~pollard/Books/Mini/Basic.pdf
https://www.math.wisc.edu/~roch/grad-prob/gradprob-notes7.pdf Wqwt ( talk) 05:17, 25 April 2021 (UTC)
Suggestion to check edits made by user Dvidby0
Just like I commented on /info/en/?search=Multivariate_normal_distribution user Dvidby0 is citing his own paper with dubious contribution to the topic. It is more subtle here but I think it is worth to reconsider if citing yourself is moral ( are you promoting your 2020 paper?) and is it adding anything new to the topic? Maybe it is adding something but sure as hell it isn't adding clarity. People here want to learn something about normal distribution and you are putting your stuff in. Imagine everybody started adding things from their 1y old papers to get citations, wikipedia would look like complete garbage. — Preceding unsigned comment added by Vretka ( talk • contribs) 20:55, 12 March 2021 (UTC)
- I agree with your concern. We used to require reliable secondary sources. The we started accepting blog posts from university professors with long histories of academic publications in respected journals with a peer review process posting on their university’s website. Then we started accepting any professor’s blog posted in the .edu domain. Now, the blog doesn’t even need to be in the .edu domain or on a university sponsored website. There is always a tension between accuracy and completeness. It seems that we are more and more willing to take a chance on inaccurate information in order to achieve a more complete coverage of the subject. To use a metaphor, Wikipedia used to be a lake with well filtered inflows, but now it is transitioning to a swamp.
- As for the text that Dvidby0 added, I didn’t see anything wrong or new. There should be 100’s of reliable sources in textbooks. I do think that the link to the Matlab code should be removed because Wikipedia isn’t a directory of links and the editors of Wikipedia cannot vet the accuracy of the Matlab code. Also, the figure, which I presume is the output of that Matlab code, is too esoteric for Wikipedia. Constant314 ( talk) 22:56, 12 March 2021 (UTC)
- I agree with Vretka -- this is clearly unpublished original research which doesn't belong here. Pointing out that there are other instances to be found on Wikipedia doesn't make it right, any more than a thief should be judged innocent because there's a lot of crime about. It breaks Wikipedia's policy and should absolutely be removed. Glenbarnett ( talk) 22:58, 30 July 2021 (UTC)
Wiki Education Foundation-supported course assignment
![]() This article is or was the subject of a Wiki Education Foundation-supported course assignment. Further details are available
on the course page. Peer reviewers:
Jiamingshi.
This article is or was the subject of a Wiki Education Foundation-supported course assignment. Further details are available
on the course page. Peer reviewers:
Jiamingshi.
Above undated message substituted from Template:Dashboard.wikiedu.org assignment by PrimeBOT ( talk) 05:23, 17 January 2022 (UTC)
intro sucks and i shouldn't need to tell you this
wiki is a general encylopedia for the avg person do you people really think the introduction is pitched to the avg person ? maybe ask your parents or grandparents jeez , grow up you math people and learn how to write English and don't you dare criticize me for being mean; i am really fed up with math people's total inability to write at the appropriate level really fed up — Preceding unsigned comment added by 2601:192:4700:1F70:BDC1:852D:B5D9:A6AC ( talk) 23:30, 30 December 2021 (UTC)
- thats fair. i will have a look at suggesting an improvment on the introduction. serious question: is there a good example of a mathematical introduction that you found particularly well pitched to an average person? it would help me model an introduction. who knows, perhaps you will start a trend of standardizing mathematical explanations. FullPlaid ( talk) 15:57, 9 February 2022 (UTC)
Unnecessary expectation of "reciprocal"?
After the table with the moments of a Gaussian there is a sentence about the expected value of the "reciprocal". In fact the result is about for . In addition the result is a very weak upper bound: it is stated for a Gaussian with arbitrary mean but the result is independent of the mean. It seems unnecessary for such a result to appear in a section about the exact moments of the Gaussian. — Preceding unsigned comment added by Aterbiou ( talk • contribs) 09:34, 9 March 2022 (UTC)
Removing opening paragraph
I removed the following opening paragraph from the article. It seemed pointlessly vague and off-topic: articles on specific distributions aren't the place for handwaving explanations of basic statistical concepts. Leaving it here in case someone has a different opinion. 69.127.73.225 ( talk) 02:52, 4 April 2022 (UTC)
"A normal distribution is a probability distribution used to model phenomena that have a default behaviour and cumulative possible deviations from that behaviour. For instance, a proficient archer's arrows are expected to land around the bull's eye of the target; however, due to aggregating imperfections in the archer's technique, most arrows will miss the bull's eye by some distance. The average of this distance is known in archery as accuracy, while the amount of variation in the distances as precision. In the context of a normal distribution, accuracy and precision are referred to as the mean and the standard deviation, respectively. Thus, a narrow measure of an archer's proficiency can be expressed with two values: a mean and a standard deviation. In a normal distribution, these two values mean: there is a ~68% probability that an arrow will land within one standard deviation of the archer's average accuracy; a ~95% probability that an arrow will land within two standard deviations of the archer's average accuracy; ~99.7% within three; and so on, slowly increasing towards 100%."
- That text was added in February to precede the long-standing and more appropriate intro. However, it was added as a result of comments at #intro sucks and i shouldn't need to tell you this that rightfully complain about the description of the topic in the intro, which is quite terse and difficult to understand for the average person. Mind matrix 12:23, 4 April 2022 (UTC)
Minor error in fraction
Following the line "The CDF of the standard normal distribution can be expanded by Integration by parts into a series: " I think that in the equation for phi(x) the fraction "x^5/3.5" should read "x^5/15". 217.155.205.34 ( talk) 17:37, 12 May 2022 (UTC)
With unknown mean and unknown variance equations
I tried implementing this and got tiny variances. Searching around, I found https://stats.stackexchange.com/questions/365192/bayesian-update-for-a-univariate-normal-distribution-with-unknown-mean-and-varia where someone else tried and got tiny variances. As far as I can tell, it works nicely if we don't divide by the total observations (or obs+pseudo) in the final distribution. I don't know how to prove such things. — Preceding unsigned comment added by 76.146.32.69 ( talk) 16:19, 25 July 2022 (UTC)
PDF formula is wrong.
The pdf formula in the some sections is missing a minus sign. In the right column the pdf is correct. Ron.linssen ( talk) 08:33, 29 September 2022 (UTC)