|
| This article is rated Stub-class on Wikipedia's
content assessment scale. It is of interest to the following WikiProjects: | |||||||||||||||||||||||||||||||||||||||||||||||||
| ||||||||||||||||||||||||||||||||||||||||||||||||||


How much water was in it? Seems a fairly obvious thing to include. Fig ( talk) 14:21, 17 October 2011 (UTC)
- Melting 395 cubic km (= ~95 cubic miles) of grounded ice (362 Gt) into 362 cubic km (= ~87 cubic miles) of meltwater and adding it to the oceans would raise globally averaged sea-level by 1.00 mm (ref [1]). So 16 meters of SLR would be 16,000 times that = 5,792,000 Gt of meltwater, from about 1.52 million cubic miles of ice.
- Or, in the units favored by US News & World Report, we could say "12,083 Lake Eries."
- Feel free to add it to the article, Fig, wherever you think it belongs, in whichever units you prefer. NCdave ( talk) 18:40, 4 April 2017 (UTC)
- If someone wants to include how much water was in Meltwater pulse 1A, the amount needs to come from reliable sources that answer this question because [Wikipedia:No original research|original research] is excluded from Wikipedia articles. Paul H. ( talk) 17:10, 7 April 2017 (UTC)
- Routine calculations, such as units conversions, are not "original research." Converting from meters of SLR to mass of meltwater or volume of ice is a routine calculation. Google finds hundreds of reliable sources which give the simple conversion factors between sea-level rise and equivalent amount of water or ice. It only depends on the surface area of the oceans, which obviously is not a figure in dispute in the first couple of significant digits. There's no WP:OR problem with putting this information in the article, regardless of whether you specify it in GT, cubic miles of ice, "Lake Eries" of water, or any other units. NCdave ( talk) 20:37, 30 April 2017 (UTC)
Seems interesting to include this new study in the article. http://www.nature.com/nature/journal/v483/n7391/full/483549a.html Palaeoclimate: Tahitian record suggests Antarctic collapse, Robert E. Kopp, Nature 483, 549–550 (29 March 2012) doi:10.1038/483549a — Preceding unsigned comment added by 132.166.73.163 ( talk) 13:14, 29 March 2012 (UTC)
- In Antarctica, ice accumulation and loss are very, very close to being in perfect balance. Whether Antarctica is actually gaining or losing ice mass is unknown.
- Most recently, this 2015 NASA study reported that Antarctica is gaining 82 Gt of ice per year: http://www.nasa.gov/feature/goddard/nasa-study-mass-gains-of-antarctic-ice-sheet-greater-than-losses
- Based on CryoSat, McMillan (2014) found Antarctica is losing 79 to 241 Gt/yr of ice, though that was based on only 3 years of data.
- Based on GRACE, Shepherd (2012) concluded that Antarctica ice mass change since 1992 has averaged - 71 +/- 83 Gt/yr, which means they couldn't tell whether it's actually gaining or losing ice mass.
- Based on ICESat, Zwally (2012) found that Antarctica is gaining ice mass: +27 to +59 Gt/yr (averaged over five years), or +70 to +170 Gt/yr (averaged over 19 years). http://vimeo.com/46429608
- The range from those various studies, with error bars, is from +170 Gt/yr to -241 Gt/yr, which is equivalent to just -0.47 to +0.67 mm/yr sea-level change.
- That's equivalent to less than 3 inches of sea-level change per century. In other words, although we don't know whether Antarctica is gaining or losing ice, we do know the rate, either way, is so tiny that it's currently having a negligible effect on sea-level and on Antarctica's total ice sheet mass. NCdave ( talk) 18:50, 4 April 2017 (UTC)
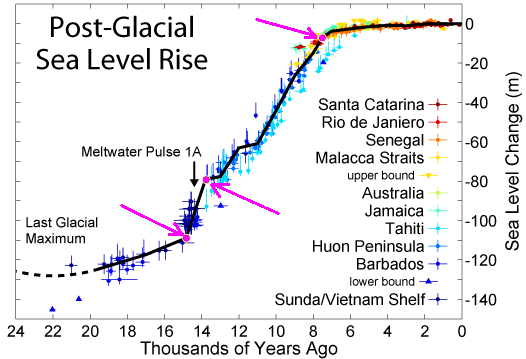
The text says, "global sea level rose between 16 meters (52 ft) and 25 meters (82 ft) in about 400–500 years, giving mean rates of roughly 30–60 mm (0.098–0.197 ft)/yr."
But I digitized the graph using WebPlotDigitizer, and found that the Meltwater Pulse 1A segment runs from 14.81K to 13.74K years ago, and shows sea-level rising from -108.7 to -79.0 meters (total of 29.7 meters), for a rate of: (108.7 - 79.0) / (14.81 - 13.74) = 27.8 mm/yr
Obviously those numbers are not quite consistent with the text. The duration of of the Pulse is longer in the graph, and the amount of SLR is greater, but the rate of SLR is lower, than the text reports. NCdave ( talk) 18:23, 4 April 2017 (UTC)
- There are three factors that need to considered. First, the figure is from a entirely different source than the text. The different sources means that different data sets were used to produce both; different algorithms and weighting were used to account for the standard deviations of depth and age associated with each data point; and likely different types of material were dated. All of these factors would cause the interpreted duration and magnitude of meltwater spikes between sources to be significantly different between the text and figure. Which one is “correct” would be a judgment of the suitability of the specific techniques used to analyze the data and plot figures. Second, the small scale and resolution of the available figure means that no matter how precise the WebPlotDigitizer might be, the accuracy of the numerical values obtained by digitizing relative to the original values used to plot graph would be somewhat unreliable. For example, I would suspect that the accuracy for depth obtained using WebPlotDigitizer from a such a figure would likely be at least plus or minus a few meters, if not more. Finally, the figure that was digitized was prepared by Robert A. Rhode from published data as part of the Global Warming Art project. It is an illustration that is not from the peer-reviewed scientific literature. Therefore, the emphasis is on illustrative properties and not on numerical accuracy. Overall, a person has to be skeptical and wary about the accuracy of data obtained from figures, especially those, which are popular illustrations, regardless of how precise a digitizer might be. Given these factors, it is not surprising that there are differences between the numbers in the text and those estimated from figure implicitly only as an illustration. Paul H. ( talk) 16:47, 7 April 2017 (UTC)
- Good points, Paul, except it is easy to get better than 1 meter resolution when digitizing that graph with WebPlotDigitizer, which is no doubt quite a bit better than the precision of the original data. Give it a try, it's a very handy tool. NCdave ( talk) 20:19, 30 April 2017 (UTC)
Hello fellow Wikipedians,
I have just modified one external link on Meltwater pulse 1A. Please take a moment to review my edit. If you have any questions, or need the bot to ignore the links, or the page altogether, please visit this simple FaQ for additional information. I made the following changes:
- Added archive https://web.archive.org/web/20150924031156/http://www.honors.ufl.edu/apps/Thesis.aspx/Details/1814 to http://www.honors.ufl.edu/apps/Thesis.aspx/Details/1814
When you have finished reviewing my changes, you may follow the instructions on the template below to fix any issues with the URLs.
This message was posted before February 2018.
After February 2018, "External links modified" talk page sections are no longer generated or monitored by InternetArchiveBot. No special action is required regarding these talk page notices, other than
regular verification using the archive tool instructions below. Editors
have permission to delete these "External links modified" talk page sections if they want to de-clutter talk pages, but see the
RfC before doing mass systematic removals. This message is updated dynamically through the template {{
source check}} (last update: 5 June 2024).
- If you have discovered URLs which were erroneously considered dead by the bot, you can report them with this tool.
- If you found an error with any archives or the URLs themselves, you can fix them with this tool.
Cheers.— InternetArchiveBot ( Report bug) 08:02, 25 January 2018 (UTC)
What I was wondering about is, that there is no mention in the article of possible sudden water discharge events from the European and Asian continent, or even in southeast Asia, into the interconnected world oceans.
Due to the laws of hydraulics all this possible events even on different continents have to be seen as a whole, in sum.
A water pulse, speak, a lot of additional water in short time, can only come from big reservoirs on land or due events of a sudden strong rise of temperature. But even "on land" can today mean under water, since the level than was 120 meters below. Every depression which lies higher then that was then a lake that even can suddenly break.
Another aspect is the rise of the whole earth crust, of a whole continent, due pressure relief from ice and even big water bodies. This would rise the sea level too (maybe, because the crust floats also on a non compressible liquid, the magma).
Or when very big previously suspended ice masses, bridges, suddenly slid or drop or break of into the ocean.
And what about the thing of more dust in the atmosphere before the ice maximum? With the beginning of more rain after the melting there maybe was a sudden temperature rise due purification of the atmosphere.
A lot of work for scientist for years to work that all out. — Preceding unsigned comment added by 94.114.202.121 ( talk) 23:44, 3 June 2018 (UTC)
And I even have another theory. What if the peek is no sudden peak, but a sudden addition.
Imagine that a lot of the melting water first also filed up all ancient and even new depressions on land, so that at the beginning just a part of the melting water reached the oceans. Than, much later, when all this depressions startet to overflow, this additional water startet to reach the oceans.
I thought about that all after seeing this picture and article, even if this event fits better with the Meltwater pulse 1B (maybe the additional overflow of the Black Sea into the Mediterranean):
https://ars.els-cdn.com/content/image/1-s2.0-S002532271730035X-gr1.jpg — Preceding unsigned comment added by 94.114.202.121 ( talk) 00:21, 4 June 2018 (UTC)
Another important thing concerning water level rises is the shape of the repository. A high but narrow glas rises faster in water level with the same amount of liquid than a wide soup bowl. Don't know, if this is paid attention to in the case of the littoral shape of the coastline of the continents. Maybe today they know the exact shape of the earth even under water to predict future sea level rises. — Preceding unsigned comment added by 94.114.202.121 ( talk) 01:39, 4 June 2018 (UTC)
- Stub-Class Environment articles
- Unknown-importance Environment articles
- Stub-Class Climate change articles
- Unknown-importance Climate change articles
- WikiProject Climate change articles
- Stub-Class Geology articles
- Low-importance Geology articles
- Low-importance Stub-Class Geology articles
- Automatically assessed Geology articles
- WikiProject Geology articles
- Articles with conflicting quality ratings
- Start-Class Limnology and Oceanography articles
- Low-importance Limnology and Oceanography articles
- WikiProject Limnology and Oceanography articles
|
| This article is rated Stub-class on Wikipedia's
content assessment scale. It is of interest to the following WikiProjects: | |||||||||||||||||||||||||||||||||||||||||||||||||
| ||||||||||||||||||||||||||||||||||||||||||||||||||
How much water was in it? Seems a fairly obvious thing to include. Fig ( talk) 14:21, 17 October 2011 (UTC)
- Melting 395 cubic km (= ~95 cubic miles) of grounded ice (362 Gt) into 362 cubic km (= ~87 cubic miles) of meltwater and adding it to the oceans would raise globally averaged sea-level by 1.00 mm (ref [1]). So 16 meters of SLR would be 16,000 times that = 5,792,000 Gt of meltwater, from about 1.52 million cubic miles of ice.
- Or, in the units favored by US News & World Report, we could say "12,083 Lake Eries."
- Feel free to add it to the article, Fig, wherever you think it belongs, in whichever units you prefer. NCdave ( talk) 18:40, 4 April 2017 (UTC)
- If someone wants to include how much water was in Meltwater pulse 1A, the amount needs to come from reliable sources that answer this question because [Wikipedia:No original research|original research] is excluded from Wikipedia articles. Paul H. ( talk) 17:10, 7 April 2017 (UTC)
- Routine calculations, such as units conversions, are not "original research." Converting from meters of SLR to mass of meltwater or volume of ice is a routine calculation. Google finds hundreds of reliable sources which give the simple conversion factors between sea-level rise and equivalent amount of water or ice. It only depends on the surface area of the oceans, which obviously is not a figure in dispute in the first couple of significant digits. There's no WP:OR problem with putting this information in the article, regardless of whether you specify it in GT, cubic miles of ice, "Lake Eries" of water, or any other units. NCdave ( talk) 20:37, 30 April 2017 (UTC)
Seems interesting to include this new study in the article. http://www.nature.com/nature/journal/v483/n7391/full/483549a.html Palaeoclimate: Tahitian record suggests Antarctic collapse, Robert E. Kopp, Nature 483, 549–550 (29 March 2012) doi:10.1038/483549a — Preceding unsigned comment added by 132.166.73.163 ( talk) 13:14, 29 March 2012 (UTC)
- In Antarctica, ice accumulation and loss are very, very close to being in perfect balance. Whether Antarctica is actually gaining or losing ice mass is unknown.
- Most recently, this 2015 NASA study reported that Antarctica is gaining 82 Gt of ice per year: http://www.nasa.gov/feature/goddard/nasa-study-mass-gains-of-antarctic-ice-sheet-greater-than-losses
- Based on CryoSat, McMillan (2014) found Antarctica is losing 79 to 241 Gt/yr of ice, though that was based on only 3 years of data.
- Based on GRACE, Shepherd (2012) concluded that Antarctica ice mass change since 1992 has averaged - 71 +/- 83 Gt/yr, which means they couldn't tell whether it's actually gaining or losing ice mass.
- Based on ICESat, Zwally (2012) found that Antarctica is gaining ice mass: +27 to +59 Gt/yr (averaged over five years), or +70 to +170 Gt/yr (averaged over 19 years). http://vimeo.com/46429608
- The range from those various studies, with error bars, is from +170 Gt/yr to -241 Gt/yr, which is equivalent to just -0.47 to +0.67 mm/yr sea-level change.
- That's equivalent to less than 3 inches of sea-level change per century. In other words, although we don't know whether Antarctica is gaining or losing ice, we do know the rate, either way, is so tiny that it's currently having a negligible effect on sea-level and on Antarctica's total ice sheet mass. NCdave ( talk) 18:50, 4 April 2017 (UTC)
The text says, "global sea level rose between 16 meters (52 ft) and 25 meters (82 ft) in about 400–500 years, giving mean rates of roughly 30–60 mm (0.098–0.197 ft)/yr."
But I digitized the graph using WebPlotDigitizer, and found that the Meltwater Pulse 1A segment runs from 14.81K to 13.74K years ago, and shows sea-level rising from -108.7 to -79.0 meters (total of 29.7 meters), for a rate of: (108.7 - 79.0) / (14.81 - 13.74) = 27.8 mm/yr
Obviously those numbers are not quite consistent with the text. The duration of of the Pulse is longer in the graph, and the amount of SLR is greater, but the rate of SLR is lower, than the text reports. NCdave ( talk) 18:23, 4 April 2017 (UTC)
- There are three factors that need to considered. First, the figure is from a entirely different source than the text. The different sources means that different data sets were used to produce both; different algorithms and weighting were used to account for the standard deviations of depth and age associated with each data point; and likely different types of material were dated. All of these factors would cause the interpreted duration and magnitude of meltwater spikes between sources to be significantly different between the text and figure. Which one is “correct” would be a judgment of the suitability of the specific techniques used to analyze the data and plot figures. Second, the small scale and resolution of the available figure means that no matter how precise the WebPlotDigitizer might be, the accuracy of the numerical values obtained by digitizing relative to the original values used to plot graph would be somewhat unreliable. For example, I would suspect that the accuracy for depth obtained using WebPlotDigitizer from a such a figure would likely be at least plus or minus a few meters, if not more. Finally, the figure that was digitized was prepared by Robert A. Rhode from published data as part of the Global Warming Art project. It is an illustration that is not from the peer-reviewed scientific literature. Therefore, the emphasis is on illustrative properties and not on numerical accuracy. Overall, a person has to be skeptical and wary about the accuracy of data obtained from figures, especially those, which are popular illustrations, regardless of how precise a digitizer might be. Given these factors, it is not surprising that there are differences between the numbers in the text and those estimated from figure implicitly only as an illustration. Paul H. ( talk) 16:47, 7 April 2017 (UTC)
- Good points, Paul, except it is easy to get better than 1 meter resolution when digitizing that graph with WebPlotDigitizer, which is no doubt quite a bit better than the precision of the original data. Give it a try, it's a very handy tool. NCdave ( talk) 20:19, 30 April 2017 (UTC)
Hello fellow Wikipedians,
I have just modified one external link on Meltwater pulse 1A. Please take a moment to review my edit. If you have any questions, or need the bot to ignore the links, or the page altogether, please visit this simple FaQ for additional information. I made the following changes:
- Added archive https://web.archive.org/web/20150924031156/http://www.honors.ufl.edu/apps/Thesis.aspx/Details/1814 to http://www.honors.ufl.edu/apps/Thesis.aspx/Details/1814
When you have finished reviewing my changes, you may follow the instructions on the template below to fix any issues with the URLs.
This message was posted before February 2018.
After February 2018, "External links modified" talk page sections are no longer generated or monitored by InternetArchiveBot. No special action is required regarding these talk page notices, other than
regular verification using the archive tool instructions below. Editors
have permission to delete these "External links modified" talk page sections if they want to de-clutter talk pages, but see the
RfC before doing mass systematic removals. This message is updated dynamically through the template {{
source check}} (last update: 5 June 2024).
- If you have discovered URLs which were erroneously considered dead by the bot, you can report them with this tool.
- If you found an error with any archives or the URLs themselves, you can fix them with this tool.
Cheers.— InternetArchiveBot ( Report bug) 08:02, 25 January 2018 (UTC)
What I was wondering about is, that there is no mention in the article of possible sudden water discharge events from the European and Asian continent, or even in southeast Asia, into the interconnected world oceans.
Due to the laws of hydraulics all this possible events even on different continents have to be seen as a whole, in sum.
A water pulse, speak, a lot of additional water in short time, can only come from big reservoirs on land or due events of a sudden strong rise of temperature. But even "on land" can today mean under water, since the level than was 120 meters below. Every depression which lies higher then that was then a lake that even can suddenly break.
Another aspect is the rise of the whole earth crust, of a whole continent, due pressure relief from ice and even big water bodies. This would rise the sea level too (maybe, because the crust floats also on a non compressible liquid, the magma).
Or when very big previously suspended ice masses, bridges, suddenly slid or drop or break of into the ocean.
And what about the thing of more dust in the atmosphere before the ice maximum? With the beginning of more rain after the melting there maybe was a sudden temperature rise due purification of the atmosphere.
A lot of work for scientist for years to work that all out. — Preceding unsigned comment added by 94.114.202.121 ( talk) 23:44, 3 June 2018 (UTC)
And I even have another theory. What if the peek is no sudden peak, but a sudden addition.
Imagine that a lot of the melting water first also filed up all ancient and even new depressions on land, so that at the beginning just a part of the melting water reached the oceans. Than, much later, when all this depressions startet to overflow, this additional water startet to reach the oceans.
I thought about that all after seeing this picture and article, even if this event fits better with the Meltwater pulse 1B (maybe the additional overflow of the Black Sea into the Mediterranean):
https://ars.els-cdn.com/content/image/1-s2.0-S002532271730035X-gr1.jpg — Preceding unsigned comment added by 94.114.202.121 ( talk) 00:21, 4 June 2018 (UTC)
Another important thing concerning water level rises is the shape of the repository. A high but narrow glas rises faster in water level with the same amount of liquid than a wide soup bowl. Don't know, if this is paid attention to in the case of the littoral shape of the coastline of the continents. Maybe today they know the exact shape of the earth even under water to predict future sea level rises. — Preceding unsigned comment added by 94.114.202.121 ( talk) 01:39, 4 June 2018 (UTC)
- Stub-Class Environment articles
- Unknown-importance Environment articles
- Stub-Class Climate change articles
- Unknown-importance Climate change articles
- WikiProject Climate change articles
- Stub-Class Geology articles
- Low-importance Geology articles
- Low-importance Stub-Class Geology articles
- Automatically assessed Geology articles
- WikiProject Geology articles
- Articles with conflicting quality ratings
- Start-Class Limnology and Oceanography articles
- Low-importance Limnology and Oceanography articles
- WikiProject Limnology and Oceanography articles