This special page shows all files uploaded to the English Wikipedia. (See also the list for Wikimedia Commons.) By default, the last uploaded files are shown at top of the list, but clicking on a column header will change the sorting.
Deleted files are not shown here but are included in the upload log.
| Date | Name | Thumbnail | Size | Description |
|---|---|---|---|---|
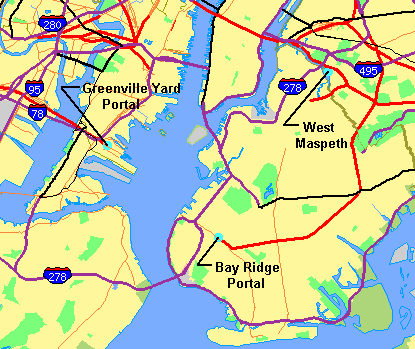
| 18:27, 21 May 2006 | CrossHarborRailFacilityMap.png ( file) |
 |
15 KB | Map showing New York Harbor with adjacent parts of New York and New Jersey obtained from U.S. Census Bureau, with facilities of proposed Cross-Harbor Rail Tunnel shown on map by Cross Harbor Freight Movement Project superimposed and legends added by hand. |
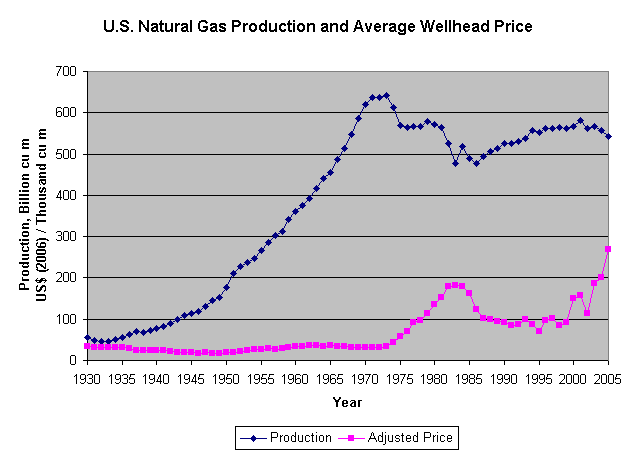
| 15:01, 9 May 2006 | UsNaturalGasProductionAndPrices.png ( file) |
 |
5 KB | Chart of U.S. natural gas production (million cubic meters) and average wellhead prices (adjusted to spring, 2006 by U.S. CPI, per thousand cubic meters) for years from 1930 through 2005, Natural gas data from Energy Information Administration, U.S. Depar |
| 17:49, 2 May 2006 | TransitFaresNorthAmerica1955to2005.png ( file) |
 |
5 KB | Chart of public transit fares in four major North American cities from 1955 through 2005 |
This special page shows all files uploaded to the English Wikipedia. (See also the list for Wikimedia Commons.) By default, the last uploaded files are shown at top of the list, but clicking on a column header will change the sorting.
Deleted files are not shown here but are included in the upload log.
| Date | Name | Thumbnail | Size | Description |
|---|---|---|---|---|
| 18:27, 21 May 2006 | CrossHarborRailFacilityMap.png ( file) |
|
15 KB | Map showing New York Harbor with adjacent parts of New York and New Jersey obtained from U.S. Census Bureau, with facilities of proposed Cross-Harbor Rail Tunnel shown on map by Cross Harbor Freight Movement Project superimposed and legends added by hand. |
| 15:01, 9 May 2006 | UsNaturalGasProductionAndPrices.png ( file) |
|
5 KB | Chart of U.S. natural gas production (million cubic meters) and average wellhead prices (adjusted to spring, 2006 by U.S. CPI, per thousand cubic meters) for years from 1930 through 2005, Natural gas data from Energy Information Administration, U.S. Depar |
| 17:49, 2 May 2006 | TransitFaresNorthAmerica1955to2005.png ( file) |
|
5 KB | Chart of public transit fares in four major North American cities from 1955 through 2005 |