
South Hams District Council is the local authority for the South Hams District in Devon, England. The council is elected every four years. Since the last boundary changes in 2015, 31 councillors have been elected from 20 wards: eleven of which elect one councillor, seven elect two councillors and two elect three councillors. [1] Between 1999 and 2014, 40 councillors were elected from 30 wards. [2]
Council elections
- 1973 South Hams District Council election
- 1976 South Hams District Council election
- 1979 South Hams District Council election (New ward boundaries) [3]
- 1983 South Hams District Council election
- 1987 South Hams District Council election (District boundary changes took place but the number of seats remained the same) [4] [5]
- 1991 South Hams District Council election
- 1995 South Hams District Council election
- 1999 South Hams District Council election (New ward boundaries reduced the number of seats by 4) [6] [7]
- 2003 South Hams District Council election
- 2007 South Hams District Council election
- 2011 South Hams District Council election
- 2015 South Hams District Council election (New ward boundaries reduced the number of seats by 9) [1] [8]
- 2019 South Hams District Council election
- 2023 South Hams District Council election
| Date | Conservative | +/- | Liberal Democrat | +/- | Greens | +/- | Labour | +/- | Independent | +/- | Control | |||||
| 2011 | 30 | 5 | 3 | 1 | 1 | Conservative | ||||||||||
| 2015 [note 1] [10] | 25 | -5 | 2 | -3 | 3 | = | 1 | = | 0 | -1 | Conservative | |||||
| 2017 | 24 | -1 | 3 | +1 | 3 | = | 1 | = | 0 | = | Conservative | |||||
| 2019 | 16 | -8 | 10 | +7 | 3 | = | 0 | -1 | 2 | +2 | Conservative | |||||
| 2023 | 7 | -9 | 19 | +9 | 3 | = | 1 | +1 | 1 | -1 | Liberal Democrats | |||||
District result maps
-
 1999 results map
 -
 2003 results map
 -
 2007 results map
 -
 2011 results map
 -
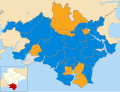
 2015 results map
 -
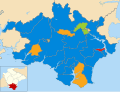
 2019 results map
 -
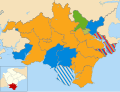 2023 results map


By-election results
1995-1999
| Party | Candidate | Votes | % | ±% | |
|---|---|---|---|---|---|
| Conservative | 348 | 57.6 | |||
| Liberal Democrats | 256 | 42.4 | |||
| Majority | 92 | 15.2 | |||
| Turnout | 604 | ||||
| Conservative gain from Liberal Democrats | Swing | ||||
| Party | Candidate | Votes | % | ±% | |
|---|---|---|---|---|---|
| Conservative | 398 | 69.6 | |||
| Liberal Democrats | 174 | 30.4 | |||
| Majority | 224 | 39.2 | |||
| Turnout | 572 | 43.6 | |||
| Conservative gain from Independent | Swing | ||||
1999-2003
| Party | Candidate | Votes | % | ±% | |
|---|---|---|---|---|---|
| Liberal Democrats | 174 | 33.9 | +20.0 | ||
| Labour | 130 | 25.3 | -48.7 | ||
| Independent | 112 | 21.8 | +21.8 | ||
| Independent | 76 | 14.8 | +14.8 | ||
| Independent | 22 | 4.3 | +4.3 | ||
| Majority | 44 | 8.6 | |||
| Turnout | 514 | 30.7 | |||
| Liberal Democrats gain from Labour | Swing | ||||
2003-2007
| Party | Candidate | Votes | % | ±% | |
|---|---|---|---|---|---|
| Conservative | Linda Facy | 211 | 41.9 | ||
| Independent | Brian Scown | 164 | 32.5 | ||
| Liberal Democrats | David Robinson | 129 | 25.6 | ||
| Majority | 47 | 16.3 | |||
| Turnout | 504 | 15.4 | |||
| Conservative hold | Swing | ||||
| Party | Candidate | Votes | % | ±% | |
|---|---|---|---|---|---|
| Conservative | George Rosevear | 643 | 52.7 | -4.7 | |
| Liberal Democrats | Brian Blake | 471 | 38.6 | -4.0 | |
| Labour | David Trigger | 106 | 8.7 | +8.7 | |
| Majority | 172 | 14.1 | |||
| Turnout | 1,220 | ||||
| Conservative hold | Swing | ||||
2007-2011
| Party | Candidate | Votes | % | ±% | |
|---|---|---|---|---|---|
| Liberal Democrats | Mike Hannaford | 522 | 52.4 | +27.4 | |
| Green | Jacqi Hodgson | 265 | 26.6 | +26.6 | |
| Conservative | Bob Greig | 162 | 16.2 | +5.5 | |
| Labour | Chris Robillard | 48 | 4.8 | -4.1 | |
| Majority | 257 | 25.8 | |||
| Turnout | 997 | 33.9 | |||
| Liberal Democrats hold | Swing | ||||
| Party | Candidate | Votes | % | ±% | |
|---|---|---|---|---|---|
| Liberal Democrats | Tony Barber | 379 | 44.3 | +11.9 | |
| Conservative | Alan Wright | 356 | 41.6 | -26.0 | |
| Labour | Helen Eassom | 121 | 14.1 | +14.1 | |
| Majority | 23 | 2.7 | |||
| Turnout | 856 | 21.8 | |||
| Liberal Democrats gain from Conservative | Swing | ||||
2015-2019
This by-election was called following the resignation of Green Party councillor Barrie Wood. [14]
| Party | Candidate | Votes | % | ±% | |
|---|---|---|---|---|---|
| Green | John Green | 570 | 30.1 | ||
| Liberal Democrats | John Birch | 558 | 29.5 | ||
| Labour | Eleanor Cohen | 432 | 22.8 | ||
| Conservative | Ralph Clark | 268 | 14.2 | ||
| Independent | Peter Pirnie | 63 | 3.3 | ||
| Majority | 12 | 0.6 | |||
| Turnout | 1891 | 28.37 | |||
| Green hold | Swing | ||||
This by-election was called following the resignation of Conservative councillor Lindsay Ward [16]
| Party | Candidate | Votes | % | ±% | |
|---|---|---|---|---|---|
| Liberal Democrats | Elizabeth Huntley | 473 | 46.1 | +46.1 | |
| Conservative | Jonathan Bell | 404 | 39.3 | -25.0 | |
| Labour | David Trigger | 110 | 10.7 | 10.7 | |
| Green | Janet Champman | 40 | 3.9 | -15.6 | |
| Majority | 69 | 0.6 | |||
| Turnout | 1027 | ||||
| Liberal Democrats gain from Conservative | Swing | ||||
2019-2023
This by-election was called following the death of Conservative councillor David May. [18]
| Party | Candidate | Votes | % | ±% | |
|---|---|---|---|---|---|
| Conservative | Louise Jones | 933 | 50.4 | +7.7 | |
| Green | Katie Reville | 768 | 41.5 | +41.5 | |
| TUSC | Tony Rea | 149 | 8.1 | +8.1 | |
| Majority | 165 | 0.6 | |||
| Turnout | 1,850 | 8.9 | |||
| Conservative hold | Swing | ||||
References
- ^ a b "Final recommendations for South Hams published". Local Government Boundary Commission for England. 25 February 2014. Archived from the original on 5 December 2016. Retrieved 26 October 2015.
- ^ "How to Vote". South Hams District Council. Archived from the original on 9 January 2009. Retrieved 19 February 2010.
- ^ The District of South Hams (Electoral Arrangements) Order 1977
- ^ The Mid Devon, South Hams and Teignbridge (Areas) Order 1985
- ^ The Devon (District Boundaries) Order 1985
- ^ "South Hams". BBC News Online. Retrieved 20 November 2009.
- ^ legislation.gov.uk - The District of South Hams (Electoral Changes) Order 1998. Retrieved on 4 October 2015.
- ^ legislation.gov.uk - The South Hams (Electoral Changes) Order 2014. Retrieved on 3 November 2015.
- ^ "The South Hams (Electoral Changes) Order 2014 No. 3059". Legislation.gov.uk. 5 November 2014.
- ^ "Declaration of Result of Poll". South Hams District Council. 7 May 2015. Archived from the original on 6 February 2017. Retrieved 27 October 2015.
- ^ "Labour makes surprise byelection gain". guardian.co.uk. 3 March 2006. Retrieved 20 November 2009.
- ^ "Apologies and thanks – but what a great night!".
- ^ "Declaration of result of poll" (PDF). South Hams District Council. Archived from the original (PDF) on 16 July 2011. Retrieved 19 February 2010.
- ^ Clark, Daniel (4 September 2015). "South Hams councillor resigns opening up vacancy in Totnes ward". Herald Express. Retrieved 26 October 2015.
- ^ "Totnes By-election 2015 Result". South Hams District Council. 8 October 2015. Retrieved 26 October 2015.
- ^ Acourt, Sam (31 January 2017). "By-election announced for Charterlands after Cllr Lindsay Ward resigns". Ivybridge & South Brent Gazette. Retrieved 24 February 2017.
- ^ "Charterlands by-election". South Hams District Council. 18 January 2017. Retrieved 23 February 2017.
- ^ Clark, Daniel (3 December 2020). "'Larger than life councillor' dies after cancer battle". Devon Live. Retrieved 6 December 2023.
- ^ "Local Elections Archive Project — Ivybridge West Ward". www.andrewteale.me.uk. Retrieved 6 December 2023.
External links
South Hams District Council is the local authority for the South Hams District in Devon, England. The council is elected every four years. Since the last boundary changes in 2015, 31 councillors have been elected from 20 wards: eleven of which elect one councillor, seven elect two councillors and two elect three councillors. [1] Between 1999 and 2014, 40 councillors were elected from 30 wards. [2]
Council elections
- 1973 South Hams District Council election
- 1976 South Hams District Council election
- 1979 South Hams District Council election (New ward boundaries) [3]
- 1983 South Hams District Council election
- 1987 South Hams District Council election (District boundary changes took place but the number of seats remained the same) [4] [5]
- 1991 South Hams District Council election
- 1995 South Hams District Council election
- 1999 South Hams District Council election (New ward boundaries reduced the number of seats by 4) [6] [7]
- 2003 South Hams District Council election
- 2007 South Hams District Council election
- 2011 South Hams District Council election
- 2015 South Hams District Council election (New ward boundaries reduced the number of seats by 9) [1] [8]
- 2019 South Hams District Council election
- 2023 South Hams District Council election
| Date | Conservative | +/- | Liberal Democrat | +/- | Greens | +/- | Labour | +/- | Independent | +/- | Control | |||||
| 2011 | 30 | 5 | 3 | 1 | 1 | Conservative | ||||||||||
| 2015 [note 1] [10] | 25 | -5 | 2 | -3 | 3 | = | 1 | = | 0 | -1 | Conservative | |||||
| 2017 | 24 | -1 | 3 | +1 | 3 | = | 1 | = | 0 | = | Conservative | |||||
| 2019 | 16 | -8 | 10 | +7 | 3 | = | 0 | -1 | 2 | +2 | Conservative | |||||
| 2023 | 7 | -9 | 19 | +9 | 3 | = | 1 | +1 | 1 | -1 | Liberal Democrats | |||||
District result maps
-
1999 results map
-
2003 results map
-
2007 results map
-
2011 results map
-
2015 results map
-
2019 results map
-
2023 results map
By-election results
1995-1999
| Party | Candidate | Votes | % | ±% | |
|---|---|---|---|---|---|
| Conservative | 348 | 57.6 | |||
| Liberal Democrats | 256 | 42.4 | |||
| Majority | 92 | 15.2 | |||
| Turnout | 604 | ||||
| Conservative gain from Liberal Democrats | Swing | ||||
| Party | Candidate | Votes | % | ±% | |
|---|---|---|---|---|---|
| Conservative | 398 | 69.6 | |||
| Liberal Democrats | 174 | 30.4 | |||
| Majority | 224 | 39.2 | |||
| Turnout | 572 | 43.6 | |||
| Conservative gain from Independent | Swing | ||||
1999-2003
| Party | Candidate | Votes | % | ±% | |
|---|---|---|---|---|---|
| Liberal Democrats | 174 | 33.9 | +20.0 | ||
| Labour | 130 | 25.3 | -48.7 | ||
| Independent | 112 | 21.8 | +21.8 | ||
| Independent | 76 | 14.8 | +14.8 | ||
| Independent | 22 | 4.3 | +4.3 | ||
| Majority | 44 | 8.6 | |||
| Turnout | 514 | 30.7 | |||
| Liberal Democrats gain from Labour | Swing | ||||
2003-2007
| Party | Candidate | Votes | % | ±% | |
|---|---|---|---|---|---|
| Conservative | Linda Facy | 211 | 41.9 | ||
| Independent | Brian Scown | 164 | 32.5 | ||
| Liberal Democrats | David Robinson | 129 | 25.6 | ||
| Majority | 47 | 16.3 | |||
| Turnout | 504 | 15.4 | |||
| Conservative hold | Swing | ||||
| Party | Candidate | Votes | % | ±% | |
|---|---|---|---|---|---|
| Conservative | George Rosevear | 643 | 52.7 | -4.7 | |
| Liberal Democrats | Brian Blake | 471 | 38.6 | -4.0 | |
| Labour | David Trigger | 106 | 8.7 | +8.7 | |
| Majority | 172 | 14.1 | |||
| Turnout | 1,220 | ||||
| Conservative hold | Swing | ||||
2007-2011
| Party | Candidate | Votes | % | ±% | |
|---|---|---|---|---|---|
| Liberal Democrats | Mike Hannaford | 522 | 52.4 | +27.4 | |
| Green | Jacqi Hodgson | 265 | 26.6 | +26.6 | |
| Conservative | Bob Greig | 162 | 16.2 | +5.5 | |
| Labour | Chris Robillard | 48 | 4.8 | -4.1 | |
| Majority | 257 | 25.8 | |||
| Turnout | 997 | 33.9 | |||
| Liberal Democrats hold | Swing | ||||
| Party | Candidate | Votes | % | ±% | |
|---|---|---|---|---|---|
| Liberal Democrats | Tony Barber | 379 | 44.3 | +11.9 | |
| Conservative | Alan Wright | 356 | 41.6 | -26.0 | |
| Labour | Helen Eassom | 121 | 14.1 | +14.1 | |
| Majority | 23 | 2.7 | |||
| Turnout | 856 | 21.8 | |||
| Liberal Democrats gain from Conservative | Swing | ||||
2015-2019
This by-election was called following the resignation of Green Party councillor Barrie Wood. [14]
| Party | Candidate | Votes | % | ±% | |
|---|---|---|---|---|---|
| Green | John Green | 570 | 30.1 | ||
| Liberal Democrats | John Birch | 558 | 29.5 | ||
| Labour | Eleanor Cohen | 432 | 22.8 | ||
| Conservative | Ralph Clark | 268 | 14.2 | ||
| Independent | Peter Pirnie | 63 | 3.3 | ||
| Majority | 12 | 0.6 | |||
| Turnout | 1891 | 28.37 | |||
| Green hold | Swing | ||||
This by-election was called following the resignation of Conservative councillor Lindsay Ward [16]
| Party | Candidate | Votes | % | ±% | |
|---|---|---|---|---|---|
| Liberal Democrats | Elizabeth Huntley | 473 | 46.1 | +46.1 | |
| Conservative | Jonathan Bell | 404 | 39.3 | -25.0 | |
| Labour | David Trigger | 110 | 10.7 | 10.7 | |
| Green | Janet Champman | 40 | 3.9 | -15.6 | |
| Majority | 69 | 0.6 | |||
| Turnout | 1027 | ||||
| Liberal Democrats gain from Conservative | Swing | ||||
2019-2023
This by-election was called following the death of Conservative councillor David May. [18]
| Party | Candidate | Votes | % | ±% | |
|---|---|---|---|---|---|
| Conservative | Louise Jones | 933 | 50.4 | +7.7 | |
| Green | Katie Reville | 768 | 41.5 | +41.5 | |
| TUSC | Tony Rea | 149 | 8.1 | +8.1 | |
| Majority | 165 | 0.6 | |||
| Turnout | 1,850 | 8.9 | |||
| Conservative hold | Swing | ||||
References
- ^ a b "Final recommendations for South Hams published". Local Government Boundary Commission for England. 25 February 2014. Archived from the original on 5 December 2016. Retrieved 26 October 2015.
- ^ "How to Vote". South Hams District Council. Archived from the original on 9 January 2009. Retrieved 19 February 2010.
- ^ The District of South Hams (Electoral Arrangements) Order 1977
- ^ The Mid Devon, South Hams and Teignbridge (Areas) Order 1985
- ^ The Devon (District Boundaries) Order 1985
- ^ "South Hams". BBC News Online. Retrieved 20 November 2009.
- ^ legislation.gov.uk - The District of South Hams (Electoral Changes) Order 1998. Retrieved on 4 October 2015.
- ^ legislation.gov.uk - The South Hams (Electoral Changes) Order 2014. Retrieved on 3 November 2015.
- ^ "The South Hams (Electoral Changes) Order 2014 No. 3059". Legislation.gov.uk. 5 November 2014.
- ^ "Declaration of Result of Poll". South Hams District Council. 7 May 2015. Archived from the original on 6 February 2017. Retrieved 27 October 2015.
- ^ "Labour makes surprise byelection gain". guardian.co.uk. 3 March 2006. Retrieved 20 November 2009.
- ^ "Apologies and thanks – but what a great night!".
- ^ "Declaration of result of poll" (PDF). South Hams District Council. Archived from the original (PDF) on 16 July 2011. Retrieved 19 February 2010.
- ^ Clark, Daniel (4 September 2015). "South Hams councillor resigns opening up vacancy in Totnes ward". Herald Express. Retrieved 26 October 2015.
- ^ "Totnes By-election 2015 Result". South Hams District Council. 8 October 2015. Retrieved 26 October 2015.
- ^ Acourt, Sam (31 January 2017). "By-election announced for Charterlands after Cllr Lindsay Ward resigns". Ivybridge & South Brent Gazette. Retrieved 24 February 2017.
- ^ "Charterlands by-election". South Hams District Council. 18 January 2017. Retrieved 23 February 2017.
- ^ Clark, Daniel (3 December 2020). "'Larger than life councillor' dies after cancer battle". Devon Live. Retrieved 6 December 2023.
- ^ "Local Elections Archive Project — Ivybridge West Ward". www.andrewteale.me.uk. Retrieved 6 December 2023.