Somerset Council elections are held every four years to elect Somerset Council, the local authority for the non-metropolitan county of Somerset in South West England. From 1889 until 2023 the council was called Somerset County Council and it was an upper tier county council, with district-level functions being provided by the area's district councils. The districts were all abolished with effect from 1 April 2023, at which point the county council became a unitary authority, taking on the functions of the abolished district councils. The county council changed its name to Somerset Council to coincide with the change in its powers. [1] There are 110 councillors, elected from 54 wards. [2]
The Conservative Party has been the largest or second-largest party on the council since 1973, and since 1981 has competed with the Liberal Democrats for control; each party has formed several majority administrations in the period since. [3]
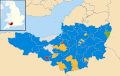
In 2009, the Conservative Party UK won 35 seats, [4] a six seat majority, with the Liberal Democrats UK coming second with 21 seats, in 2013 the Conservative Party UK won 29 seats, [5] a one seat majority, with the Liberal Democrats UK coming second with 18 seats and UKIP (a new entrant) coming joint third with Labour Party UK on three seats. In 2017 the Conservative Party UK won back seats and ended up winning 35 seats, [6] gaining them a seven seat majority, in this election, UKIP did not stand and the Liberal Democrats UK continued their loss of seats dropping to 12 (although they remained in second place).
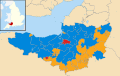
The 2022 local elections in Somerset were fought on new boundaries, with 110 seats available within the new unitary council. [7] In this election the Liberal Democrats UK won 61 seats granting them a five seat majority, the Conservative Party UK came second with 36 seats. [8]
- 1973 Somerset County Council election
- 1977 Somerset County Council election
- 1981 Somerset County Council election (boundary changes) [9]
- 1985 Somerset County Council election
- 1989 Somerset County Council election
- 1993 Somerset County Council election
- 1997 Somerset County Council election
- 2001 Somerset County Council election (boundary changes increased the number of seats by one) [10]
- 2005 Somerset County Council election
- 2009 Somerset County Council election
- 2013 Somerset County Council election
- 2017 Somerset County Council election
- 2022 Somerset Council election
-
 2001 results map
 -
 2005 results map
 -
 2009 results map
 -
 2013 results map
 -
 2017 results map
 -
 2022 results map


| Party | Candidate | Votes | % | ±% | |
|---|---|---|---|---|---|
| Conservative | 1,428 | 42.6 | +7.2 | ||
| Liberal Democrats | 1,125 | 33.6 | −1.4 | ||
| Labour | 798 | 23.8 | −5.8 | ||
| Majority | 303 | 9.0 | |||
| Turnout | 3,351 | 37.0 | |||
| Conservative hold | Swing | ||||
| Party | Candidate | Votes | % | ±% | |
|---|---|---|---|---|---|
| Conservative | 948 | 68.2 | +28.7 | ||
| Liberal Democrats | 442 | 31.8 | −14.0 | ||
| Majority | 506 | 36.4 | |||
| Turnout | 1,390 | 28.0 | |||
| Conservative gain from Liberal Democrats | Swing | ||||
| Party | Candidate | Votes | % | ±% | |
|---|---|---|---|---|---|
| Conservative | Matthew Ellis | 1,568 | 51.2 | +6.9 | |
| Liberal Democrats | Ian Hasell | 1,497 | 48.8 | +9.7 | |
| Majority | 71 | 2.4 | |||
| Turnout | 3,065 | 43.8 | |||
| Conservative hold | Swing | ||||
| Party | Candidate | Votes | % | ±% | |
|---|---|---|---|---|---|
| Conservative | Margaret Robinson | 950 | 47.4 | +10.0 | |
| Liberal Democrats | Rachel Witcombe | 783 | 39.1 | +5.5 | |
| Labour | Christopher Inchley | 271 | 13.5 | −15.5 | |
| Majority | 167 | 8.3 | |||
| Turnout | 2,004 | 29.0 | |||
| Conservative hold | Swing | ||||
| Party | Candidate | Votes | % | ±% | |
|---|---|---|---|---|---|
| Conservative | John Parham | 1,307 | 41.3 | ||
| Liberal Democrats | Garfield Kennedy | 892 | 28.2 | ||
| Labour | Chris Inchley | 711 | 22.5 | ||
| Green | Ian Forster | 256 | 8.1 | ||
| Majority | 415 | 13.1 | |||
| Turnout | |||||
| Conservative hold | Swing | ||||
| Party | Candidate | Votes | % | ±% | |
|---|---|---|---|---|---|
| Liberal Democrats | Paul Maxwell | 1,333 | 53.6 | ||
| Conservative | Paul Thompson | 943 | 37.9 | ||
| Green | Ian Greenfield | 108 | 4.3 | ||
| UKIP | Godfrey Davey | 104 | 4.2 | ||
| Majority | 390 | 15.7 | |||
| Turnout | 42.8 | ||||
| Liberal Democrats gain from Conservative | Swing | ||||
| Party | Candidate | Votes | % | ±% | |
|---|---|---|---|---|---|
| Conservative | John Denbee | 1,285 | 58.0 | ||
| Liberal Democrats | Helen Groves | 932 | 42.0 | ||
| Majority | 353 | 15.9 | |||
| Turnout | |||||
| Conservative hold | Swing | ||||
| Party | Candidate | Votes | % | ±% | |
|---|---|---|---|---|---|
| Conservative | Linda Oliver | 1,163 | 47.7 | ||
| Liberal Democrats | Damon Hooton | 836 | 34.3 | ||
| Labour | Catherine Richardson | 163 | 6.7 | ||
| Independent | Adrian Dobinson | 139 | 5.7 | ||
| Green | Les Spalding | 139 | 5.7 | ||
| Majority | 327 | 13.4 | |||
| Turnout | |||||
| Conservative gain from Liberal Democrats | Swing | ||||
| Party | Candidate | Votes | % | ±% | |
|---|---|---|---|---|---|
| Conservative | Michael Adkins | 1,298 | 29.9 | ||
| Liberal Democrats | Barrie Hall | 976 | 22.5 | ||
| Labour | Libby Lisgo | 927 | 21.4 | ||
| UKIP | Robert Bainbridge | 814 | 18.8 | ||
| Green | Alan Debenham | 326 | 7.5 | ||
| Majority | 322 | 7.4 | |||
| Turnout | |||||
| Conservative gain from Liberal Democrats | Swing | ||||
| Party | Candidate | Votes | % | ±% | |
|---|---|---|---|---|---|
| Liberal Democrats | Dawn Johnson | 1,677 | 63.2 | +15.6 | |
| Conservative | Ruth Harmon | 886 | 33.4 | −6.4 | |
| Labour | Michael McGuffie | 92 | 3.5 | −2.4 | |
| Majority | 791 | 29.8 | |||
| Turnout | 2,655 | ||||
| Liberal Democrats hold | Swing | ||||
| Party | Candidate | Votes | % | ±% | |
|---|---|---|---|---|---|
| Liberal Democrats | Kevin Messenger | 1,247 | 54.8 | N/A | |
| Conservative | David Hall | 614 | 27 | N/A | |
| Green | Ewan Jones | 415 | 18.2 | N/A | |
| Majority | 633 | 27.8 | N/A | ||
| Turnout | 2,276 | 28.3 | –31.3 | ||
| Liberal Democrats gain from Conservative | Swing | ||||
| Party | Candidate | Votes | % | ±% | |
|---|---|---|---|---|---|
| Liberal Democrats | Stephen Richard John Page | 1,212 | 50.12 | ||
| Conservative | David Hall | 878 | 36.31 | ||
| Labour | Gregory Lawrence Chambers | 174 | 7.20 | ||
| Green | Matthew Francis Geen | 154 | 6.37 | ||
| Majority | 334 | 13.81 | |||
| Turnout | 2,428 | 27.98 | –15.34 | ||
| Liberal Democrats hold | Swing | ||||
| Party | Candidate | Votes | % | ±% | |
|---|---|---|---|---|---|
| Liberal Democrats | Rob Reed | 1,313 | 47.33 | ||
| Conservative | Ken Maddock | 1,122 | 40.45 | ||
| Green | Michael Kenneth Smyth | 200 | 7.21 | N/A | |
| Labour | David Alan Oakensen | 139 | 5.01 | N/A | |
| Majority | 191 | 6.88 | |||
| Turnout | 2,788 | 36.07 | –7.93 | ||
| Liberal Democrats hold | Swing | ||||
- ^ "The Somerset (Structural Changes) Order 2022", legislation.gov.uk, The National Archives, SI 2022/329, retrieved 27 March 2024
- ^ "Somerset election results 2022: Lib Dems win control". BBC News. 6 May 2022. Retrieved 3 July 2023.
- ^ Rallings, Colin; Thrasher, Michael. "Somerset County Council Election Results 1973-2009" (PDF). Elections Centre, Plymouth University. Retrieved 22 June 2023.
- ^ "BBC NEWS | Election 2009 | Somerset council".
- ^ "Local elections 2013: Somerset Tories retain control". BBC News. May 2013.
- ^ "Local Elections Archive Project - 2017 - Somerset".
- ^ "Somerset: 'This is the biggest shake up in 50 years'". 3 April 2023.
- ^ "Election results". 6 May 2022.
- ^ The County of Somerset (Electoral Arrangements) Order 1980
- ^ "Somerset". BBC Online. Retrieved 3 June 2008.
- ^ "New Faces Join Mendip District Council". Mendip District Council. 30 May 2008. Retrieved 18 March 2010.
- ^ "Castle Cary by-election result". Somerset Council. 10 August 2023. Retrieved 18 January 2024.
- ^ "Somerset Council by election: Castle Cary Division". Somerset Council. 10 August 2023. Retrieved 18 January 2024.
|
Somerset Council elections are held every four years to elect Somerset Council, the local authority for the non-metropolitan county of Somerset in South West England. From 1889 until 2023 the council was called Somerset County Council and it was an upper tier county council, with district-level functions being provided by the area's district councils. The districts were all abolished with effect from 1 April 2023, at which point the county council became a unitary authority, taking on the functions of the abolished district councils. The county council changed its name to Somerset Council to coincide with the change in its powers. [1] There are 110 councillors, elected from 54 wards. [2]
The Conservative Party has been the largest or second-largest party on the council since 1973, and since 1981 has competed with the Liberal Democrats for control; each party has formed several majority administrations in the period since. [3]
In 2009, the Conservative Party UK won 35 seats, [4] a six seat majority, with the Liberal Democrats UK coming second with 21 seats, in 2013 the Conservative Party UK won 29 seats, [5] a one seat majority, with the Liberal Democrats UK coming second with 18 seats and UKIP (a new entrant) coming joint third with Labour Party UK on three seats. In 2017 the Conservative Party UK won back seats and ended up winning 35 seats, [6] gaining them a seven seat majority, in this election, UKIP did not stand and the Liberal Democrats UK continued their loss of seats dropping to 12 (although they remained in second place).
The 2022 local elections in Somerset were fought on new boundaries, with 110 seats available within the new unitary council. [7] In this election the Liberal Democrats UK won 61 seats granting them a five seat majority, the Conservative Party UK came second with 36 seats. [8]
- 1973 Somerset County Council election
- 1977 Somerset County Council election
- 1981 Somerset County Council election (boundary changes) [9]
- 1985 Somerset County Council election
- 1989 Somerset County Council election
- 1993 Somerset County Council election
- 1997 Somerset County Council election
- 2001 Somerset County Council election (boundary changes increased the number of seats by one) [10]
- 2005 Somerset County Council election
- 2009 Somerset County Council election
- 2013 Somerset County Council election
- 2017 Somerset County Council election
- 2022 Somerset Council election
-
2001 results map
-
2005 results map
-
2009 results map
-
2013 results map
-
2017 results map
-
2022 results map
| Party | Candidate | Votes | % | ±% | |
|---|---|---|---|---|---|
| Conservative | 1,428 | 42.6 | +7.2 | ||
| Liberal Democrats | 1,125 | 33.6 | −1.4 | ||
| Labour | 798 | 23.8 | −5.8 | ||
| Majority | 303 | 9.0 | |||
| Turnout | 3,351 | 37.0 | |||
| Conservative hold | Swing | ||||
| Party | Candidate | Votes | % | ±% | |
|---|---|---|---|---|---|
| Conservative | 948 | 68.2 | +28.7 | ||
| Liberal Democrats | 442 | 31.8 | −14.0 | ||
| Majority | 506 | 36.4 | |||
| Turnout | 1,390 | 28.0 | |||
| Conservative gain from Liberal Democrats | Swing | ||||
| Party | Candidate | Votes | % | ±% | |
|---|---|---|---|---|---|
| Conservative | Matthew Ellis | 1,568 | 51.2 | +6.9 | |
| Liberal Democrats | Ian Hasell | 1,497 | 48.8 | +9.7 | |
| Majority | 71 | 2.4 | |||
| Turnout | 3,065 | 43.8 | |||
| Conservative hold | Swing | ||||
| Party | Candidate | Votes | % | ±% | |
|---|---|---|---|---|---|
| Conservative | Margaret Robinson | 950 | 47.4 | +10.0 | |
| Liberal Democrats | Rachel Witcombe | 783 | 39.1 | +5.5 | |
| Labour | Christopher Inchley | 271 | 13.5 | −15.5 | |
| Majority | 167 | 8.3 | |||
| Turnout | 2,004 | 29.0 | |||
| Conservative hold | Swing | ||||
| Party | Candidate | Votes | % | ±% | |
|---|---|---|---|---|---|
| Conservative | John Parham | 1,307 | 41.3 | ||
| Liberal Democrats | Garfield Kennedy | 892 | 28.2 | ||
| Labour | Chris Inchley | 711 | 22.5 | ||
| Green | Ian Forster | 256 | 8.1 | ||
| Majority | 415 | 13.1 | |||
| Turnout | |||||
| Conservative hold | Swing | ||||
| Party | Candidate | Votes | % | ±% | |
|---|---|---|---|---|---|
| Liberal Democrats | Paul Maxwell | 1,333 | 53.6 | ||
| Conservative | Paul Thompson | 943 | 37.9 | ||
| Green | Ian Greenfield | 108 | 4.3 | ||
| UKIP | Godfrey Davey | 104 | 4.2 | ||
| Majority | 390 | 15.7 | |||
| Turnout | 42.8 | ||||
| Liberal Democrats gain from Conservative | Swing | ||||
| Party | Candidate | Votes | % | ±% | |
|---|---|---|---|---|---|
| Conservative | John Denbee | 1,285 | 58.0 | ||
| Liberal Democrats | Helen Groves | 932 | 42.0 | ||
| Majority | 353 | 15.9 | |||
| Turnout | |||||
| Conservative hold | Swing | ||||
| Party | Candidate | Votes | % | ±% | |
|---|---|---|---|---|---|
| Conservative | Linda Oliver | 1,163 | 47.7 | ||
| Liberal Democrats | Damon Hooton | 836 | 34.3 | ||
| Labour | Catherine Richardson | 163 | 6.7 | ||
| Independent | Adrian Dobinson | 139 | 5.7 | ||
| Green | Les Spalding | 139 | 5.7 | ||
| Majority | 327 | 13.4 | |||
| Turnout | |||||
| Conservative gain from Liberal Democrats | Swing | ||||
| Party | Candidate | Votes | % | ±% | |
|---|---|---|---|---|---|
| Conservative | Michael Adkins | 1,298 | 29.9 | ||
| Liberal Democrats | Barrie Hall | 976 | 22.5 | ||
| Labour | Libby Lisgo | 927 | 21.4 | ||
| UKIP | Robert Bainbridge | 814 | 18.8 | ||
| Green | Alan Debenham | 326 | 7.5 | ||
| Majority | 322 | 7.4 | |||
| Turnout | |||||
| Conservative gain from Liberal Democrats | Swing | ||||
| Party | Candidate | Votes | % | ±% | |
|---|---|---|---|---|---|
| Liberal Democrats | Dawn Johnson | 1,677 | 63.2 | +15.6 | |
| Conservative | Ruth Harmon | 886 | 33.4 | −6.4 | |
| Labour | Michael McGuffie | 92 | 3.5 | −2.4 | |
| Majority | 791 | 29.8 | |||
| Turnout | 2,655 | ||||
| Liberal Democrats hold | Swing | ||||
| Party | Candidate | Votes | % | ±% | |
|---|---|---|---|---|---|
| Liberal Democrats | Kevin Messenger | 1,247 | 54.8 | N/A | |
| Conservative | David Hall | 614 | 27 | N/A | |
| Green | Ewan Jones | 415 | 18.2 | N/A | |
| Majority | 633 | 27.8 | N/A | ||
| Turnout | 2,276 | 28.3 | –31.3 | ||
| Liberal Democrats gain from Conservative | Swing | ||||
| Party | Candidate | Votes | % | ±% | |
|---|---|---|---|---|---|
| Liberal Democrats | Stephen Richard John Page | 1,212 | 50.12 | ||
| Conservative | David Hall | 878 | 36.31 | ||
| Labour | Gregory Lawrence Chambers | 174 | 7.20 | ||
| Green | Matthew Francis Geen | 154 | 6.37 | ||
| Majority | 334 | 13.81 | |||
| Turnout | 2,428 | 27.98 | –15.34 | ||
| Liberal Democrats hold | Swing | ||||
| Party | Candidate | Votes | % | ±% | |
|---|---|---|---|---|---|
| Liberal Democrats | Rob Reed | 1,313 | 47.33 | ||
| Conservative | Ken Maddock | 1,122 | 40.45 | ||
| Green | Michael Kenneth Smyth | 200 | 7.21 | N/A | |
| Labour | David Alan Oakensen | 139 | 5.01 | N/A | |
| Majority | 191 | 6.88 | |||
| Turnout | 2,788 | 36.07 | –7.93 | ||
| Liberal Democrats hold | Swing | ||||
- ^ "The Somerset (Structural Changes) Order 2022", legislation.gov.uk, The National Archives, SI 2022/329, retrieved 27 March 2024
- ^ "Somerset election results 2022: Lib Dems win control". BBC News. 6 May 2022. Retrieved 3 July 2023.
- ^ Rallings, Colin; Thrasher, Michael. "Somerset County Council Election Results 1973-2009" (PDF). Elections Centre, Plymouth University. Retrieved 22 June 2023.
- ^ "BBC NEWS | Election 2009 | Somerset council".
- ^ "Local elections 2013: Somerset Tories retain control". BBC News. May 2013.
- ^ "Local Elections Archive Project - 2017 - Somerset".
- ^ "Somerset: 'This is the biggest shake up in 50 years'". 3 April 2023.
- ^ "Election results". 6 May 2022.
- ^ The County of Somerset (Electoral Arrangements) Order 1980
- ^ "Somerset". BBC Online. Retrieved 3 June 2008.
- ^ "New Faces Join Mendip District Council". Mendip District Council. 30 May 2008. Retrieved 18 March 2010.
- ^ "Castle Cary by-election result". Somerset Council. 10 August 2023. Retrieved 18 January 2024.
- ^ "Somerset Council by election: Castle Cary Division". Somerset Council. 10 August 2023. Retrieved 18 January 2024.
| Somerset Council | |||||||||||||||||||||
|---|---|---|---|---|---|---|---|---|---|---|---|---|---|---|---|---|---|---|---|---|---|
| Bath and North East Somerset Council | |||||||||||||||||||||
| North Somerset Council | |||||||||||||||||||||
| West of England Mayor | |||||||||||||||||||||
| |||||||||||||||||||||
| |||||||||||||||||||||
|