.jpg)
As of the first quarter of 2023, Washington State has 604 MW of solar power electricity generation. [1] This is an increase from about 300 MW in 2021 and 27 MW in 2013.
Washington pays a feed-in tariff of up to $5,000/year of 15 cents/kWh, which is increased by a factor of 2.4 if the panels are made in the state and by an additional 1.2 if the inverters are made in state. [2] [3]
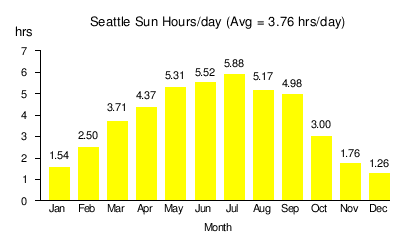
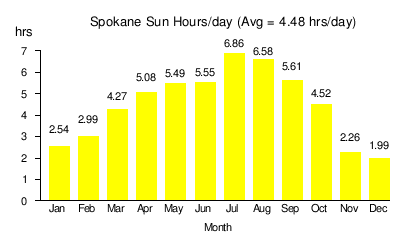
Amount of sunlight
The average insolation in Washington's two largest cities are as follows.
In the charts, a peak sun hour is one kilowatt-hour per square meter of solar irradiance. [4]
|
|
Installed generation capacity
Total grid connected
| Grid-Connected PV Capacity (MW) [7] [8] [9] [10] [11] [12] [13] [14] | |||
|---|---|---|---|
| Year | Capacity | Change | % Change |
| 2007 | 1.9 | ||
| 2008 | 3.7 | 1.8 | 95% |
| 2009 | 5.2 | 1.5 | 41% |
| 2010 | 8.0 | 2.9 | 54% |
| 2011 | 12.3 | 4.2 | 54% |
| 2012 | 19.5 | 7.2 | 59% |
| 2013 | 27.4 | 7.9 | 41% |
| 2014 | 39 | 7.2 | 42% |
| 2015 | 62 | 26 | 59% |
| 2016 | 85 | 23 | 37% |
| 2017 | 105 | 20 | 23% |
| 2018 | 169 | 64 | 61% |
| 2019 | 216 | 47 | 27% |
| 2020 | 250.3 | 34.3 | 15% |
| 2021 | 297.6 | 47.3 | % |
| 2022 | 585 | 287.4 | % |
Utility-scale
| Year | Total | Jan | Feb | Mar | Apr | May | Jun | Jul | Aug | Sep | Oct | Nov | Dec |
|---|---|---|---|---|---|---|---|---|---|---|---|---|---|
| 2018 | 2 | 0 | 0 | 0 | 0 | 0 | 0 | 0 | 0 | 0 | 0 | 1 | 1 |
| 2019 | 43 | 2 | 2 | 4 | 4 | 4 | 5 | 5 | 5 | 4 | 4 | 2 | 2 |
| 2020 | 47 | 1 | 3 | 4 | 5 | 5 | 5 | 7 | 6 | 4 | 4 | 2 | 1 |
| 2021 | 50 | 1 | 2 | 5 | 6 | 6 | 7 | 7 | 6 | 5 | 4 | 2 | 1 |
| 2022 | 83 | 1 | 3 | 5 | 5 | 6 | 6 | 7 | 6 | 4 | 13 | 14 | 11 |
| 2023 | 15 | 23 | 34 | 42 | 16 | 52 | 52 | 45 | 35 | 27 | 16 |
See also
- List of power stations in Washington#Solar
- Wind power in Washington (state)
- Solar power in the United States
- Renewable energy in the United States
References
- ^ "Washington Solar | SEIA". www.seia.org. Retrieved 2023-08-19.
- ^ Washington State Creates Incentive for Home Solar Power Production
- ^ Washington Renewable Energy Production Incentives Archived 2012-05-10 at the Wayback Machine
- ^ https://www.cnet.com/home/energy-and-utilities/peak-sun-hours/
- ^ "PV Watts". NREL. Retrieved 19 August 2012.
- ^ "PV Watts". NREL. Retrieved 19 August 2012.
- ^ Sherwood, Larry (July 2014). "U.S. Solar Market Trends 2013" (PDF). Interstate Renewable Energy Council (IREC). Retrieved 2014-07-21.
- ^ Sherwood, Larry (July 2013). "U.S. Solar Market Trends 2012" (PDF). Interstate Renewable Energy Council (IREC). p. 16. Retrieved 2013-10-11.
- ^ Sherwood, Larry (August 2012). "U.S. Solar Market Trends 2011" (PDF). Interstate Renewable Energy Council (IREC). p. 17. Archived from the original (PDF) on 2012-09-06. Retrieved 2012-08-16.
- ^ Sherwood, Larry (June 2011). "U.S. Solar Market Trends 2010" (PDF). Interstate Renewable Energy Council (IREC). Retrieved 2011-06-29.
- ^ Sherwood, Larry (July 2010). "U.S. Solar Market Trends 2009" (PDF). Interstate Renewable Energy Council (IREC). Archived from the original (PDF) on 2010-09-25. Retrieved 2010-07-28.
- ^ Sherwood, Larry (July 2009). "U.S. Solar Market Trends 2008" (PDF). Interstate Renewable Energy Council (IREC). Archived from the original (PDF) on 2009-11-23. Retrieved 2010-07-24.
- ^ Sherwood, Larry (August 2008). "U.S. Solar Market Trends 2007" (PDF). Interstate Renewable Energy Council (IREC). Retrieved 2010-07-24.[ permanent dead link]
- ^ Washington Solar
- ^ "Electricity Data Browser". U.S. Department of Energy. March 28, 2018. Retrieved October 1, 2021.
External links
As of the first quarter of 2023, Washington State has 604 MW of solar power electricity generation. [1] This is an increase from about 300 MW in 2021 and 27 MW in 2013.
Washington pays a feed-in tariff of up to $5,000/year of 15 cents/kWh, which is increased by a factor of 2.4 if the panels are made in the state and by an additional 1.2 if the inverters are made in state. [2] [3]
Amount of sunlight
The average insolation in Washington's two largest cities are as follows.
In the charts, a peak sun hour is one kilowatt-hour per square meter of solar irradiance. [4]
|
|
Installed generation capacity
Total grid connected
| Grid-Connected PV Capacity (MW) [7] [8] [9] [10] [11] [12] [13] [14] | |||
|---|---|---|---|
| Year | Capacity | Change | % Change |
| 2007 | 1.9 | ||
| 2008 | 3.7 | 1.8 | 95% |
| 2009 | 5.2 | 1.5 | 41% |
| 2010 | 8.0 | 2.9 | 54% |
| 2011 | 12.3 | 4.2 | 54% |
| 2012 | 19.5 | 7.2 | 59% |
| 2013 | 27.4 | 7.9 | 41% |
| 2014 | 39 | 7.2 | 42% |
| 2015 | 62 | 26 | 59% |
| 2016 | 85 | 23 | 37% |
| 2017 | 105 | 20 | 23% |
| 2018 | 169 | 64 | 61% |
| 2019 | 216 | 47 | 27% |
| 2020 | 250.3 | 34.3 | 15% |
| 2021 | 297.6 | 47.3 | % |
| 2022 | 585 | 287.4 | % |
Utility-scale
| Year | Total | Jan | Feb | Mar | Apr | May | Jun | Jul | Aug | Sep | Oct | Nov | Dec |
|---|---|---|---|---|---|---|---|---|---|---|---|---|---|
| 2018 | 2 | 0 | 0 | 0 | 0 | 0 | 0 | 0 | 0 | 0 | 0 | 1 | 1 |
| 2019 | 43 | 2 | 2 | 4 | 4 | 4 | 5 | 5 | 5 | 4 | 4 | 2 | 2 |
| 2020 | 47 | 1 | 3 | 4 | 5 | 5 | 5 | 7 | 6 | 4 | 4 | 2 | 1 |
| 2021 | 50 | 1 | 2 | 5 | 6 | 6 | 7 | 7 | 6 | 5 | 4 | 2 | 1 |
| 2022 | 83 | 1 | 3 | 5 | 5 | 6 | 6 | 7 | 6 | 4 | 13 | 14 | 11 |
| 2023 | 15 | 23 | 34 | 42 | 16 | 52 | 52 | 45 | 35 | 27 | 16 |
See also
- List of power stations in Washington#Solar
- Wind power in Washington (state)
- Solar power in the United States
- Renewable energy in the United States
References
- ^ "Washington Solar | SEIA". www.seia.org. Retrieved 2023-08-19.
- ^ Washington State Creates Incentive for Home Solar Power Production
- ^ Washington Renewable Energy Production Incentives Archived 2012-05-10 at the Wayback Machine
- ^ https://www.cnet.com/home/energy-and-utilities/peak-sun-hours/
- ^ "PV Watts". NREL. Retrieved 19 August 2012.
- ^ "PV Watts". NREL. Retrieved 19 August 2012.
- ^ Sherwood, Larry (July 2014). "U.S. Solar Market Trends 2013" (PDF). Interstate Renewable Energy Council (IREC). Retrieved 2014-07-21.
- ^ Sherwood, Larry (July 2013). "U.S. Solar Market Trends 2012" (PDF). Interstate Renewable Energy Council (IREC). p. 16. Retrieved 2013-10-11.
- ^ Sherwood, Larry (August 2012). "U.S. Solar Market Trends 2011" (PDF). Interstate Renewable Energy Council (IREC). p. 17. Archived from the original (PDF) on 2012-09-06. Retrieved 2012-08-16.
- ^ Sherwood, Larry (June 2011). "U.S. Solar Market Trends 2010" (PDF). Interstate Renewable Energy Council (IREC). Retrieved 2011-06-29.
- ^ Sherwood, Larry (July 2010). "U.S. Solar Market Trends 2009" (PDF). Interstate Renewable Energy Council (IREC). Archived from the original (PDF) on 2010-09-25. Retrieved 2010-07-28.
- ^ Sherwood, Larry (July 2009). "U.S. Solar Market Trends 2008" (PDF). Interstate Renewable Energy Council (IREC). Archived from the original (PDF) on 2009-11-23. Retrieved 2010-07-24.
- ^ Sherwood, Larry (August 2008). "U.S. Solar Market Trends 2007" (PDF). Interstate Renewable Energy Council (IREC). Retrieved 2010-07-24.[ permanent dead link]
- ^ Washington Solar
- ^ "Electricity Data Browser". U.S. Department of Energy. March 28, 2018. Retrieved October 1, 2021.