One third of North Hertfordshire District Council in England is elected each year, followed by one year without election. A boundary review is underway to allow the council to instead be elected all at once every four years from 2024 onwards. [1]
Elections
The elections have been as follows: [2] [3]
| Year | Seats | Conservative | Labour | Liberal Democrats [a] | Ratepayers | Independent | Notes |
|---|---|---|---|---|---|---|---|
| 1973 | 48 | 23 | 17 | 0 | 1 | 7 | |
| 1976 | 48 | 30 | 11 | 0 | 2 | 5 | |
| 1979 | 50 | 34 | 12 | 0 | 2 | 2 | New ward boundaries. [4] |
| 1980 | 50 | 32 | 14 | 0 | 2 | 2 | |
| 1982 | 50 | 32 | 14 | 0 | 2 | 2 | |
| 1983 | 50 | 30 | 15 | 1 | 2 | 2 | |
| 1984 | 50 | 31 | 12 | 2 | 3 | 2 | |
| 1986 | 50 | 26 | 14 | 7 | 3 | 0 | |
| 1987 | 50 | 26 | 13 | 8 | 3 | 0 | |
| 1988 | 50 | 27 | 13 | 7 | 3 | 0 | |
| 1990 | 50 | 29 | 15 | 3 | 3 | 0 | District boundary changes took place but the number of seats remained the same. [5] [6] |
| 1991 | 50 | 26 | 18 | 2 | 3 | 1 | |
| 1992 | 50 | 26 | 17 | 3 | 3 | 1 | |
| 1994 | 50 | 25 | 18 | 5 | 1 | 1 | |
| 1995 | 50 | 22 | 21 | 6 | 0 | 1 | |
| 1996 | 50 | 16 | 26 | 7 | 0 | 1 | |
| 1998 | 50 | 17 | 26 | 6 | 0 | 1 | |
| 1999 | 49 | 28 | 18 | 3 | 0 | 0 | New ward boundaries. [7] |
| 2000 | 49 | 29 | 18 | 2 | 0 | 0 | |
| 2002 | 49 | 28 | 17 | 4 | 0 | 0 | |
| 2003 | 49 | 27 | 16 | 6 | 0 | 0 | |
| 2004 | 49 | 28 | 14 | 7 | 0 | 0 | |
| 2006 | 49 | 33 | 9 | 7 | 0 | 0 | |
| 2007 | 49 | 30 | 10 | 9 | 0 | 0 | New ward boundaries. [8] |
| 2008 | 49 | 32 | 8 | 9 | 0 | 0 | |
| 2010 | 49 | 33 | 7 | 9 | 0 | 0 | |
| 2011 | 49 | 34 | 7 | 8 | 0 | 0 | |
| 2012 | 49 | 33 | 10 | 6 | 0 | 0 | |
| 2014 | 49 | 34 | 12 | 3 | 0 | 0 | |
| 2015 | 49 | 36 | 11 | 2 | 0 | 0 | |
| 2016 | 49 | 34 | 12 | 3 | 0 | 0 | |
| 2018 | 49 | 29 | 14 | 6 | 0 | 0 | |
| 2019 | 49 | 22 | 16 | 11 | 0 | 0 | |
| 2021 | 49 | 23 | 15 | 11 | 0 | 0 | |
| 2022 | 49 | 19 | 17 | 13 | 0 | 0 | |
| 2023 | 49 | 15 | 19 | 15 | 0 | 0 | |
| 2024 | 51 | 7 | 25 | 19 | 0 | 0 | New ward boundaries. [9] |
Borough result maps
-
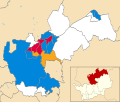
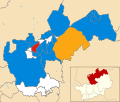 2015 results map
 -
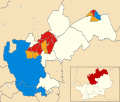
 2016 results map
 -
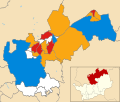
 2018 results map
 -
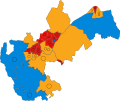
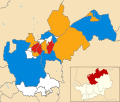 2019 results map
 -
 2021 results map
 -
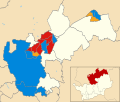
 2022 results map
 -
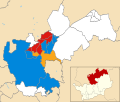
 2023 results map
 -
 2024 results map


By-elections
2002-2006
| Party | Candidate | Votes | % | ±% | |
|---|---|---|---|---|---|
| Liberal Democrats | Marilyn Kirkland [11] | 331 | 48.3 | -4.7 | |
| Conservative | 324 | 47.2 | +0.2 | ||
| Labour | 31 | 4.5 | +4.5 | ||
| Majority | 7 | 1.0 | |||
| Turnout | 686 | ||||
| Liberal Democrats hold | Swing | ||||
2010-2014
| Party | Candidate | Votes | % | ±% | |
|---|---|---|---|---|---|
| Conservative | Faye Barnard | 774 | 56.8 | -7.4 | |
| UKIP | Peter Robbins | 217 | 15.9 | +15.9 | |
| Labour | Jackie McDonald | 189 | 13.9 | -3.1 | |
| Liberal Democrats | Peter Johnson | 110 | 8.1 | +0.4 | |
| Green | George Howe | 72 | 5.3 | -5.8 | |
| Majority | 557 | 40.9 | |||
| Turnout | 1,362 | ||||
| Conservative hold | Swing | ||||
| Party | Candidate | Votes | % | ±% | |
|---|---|---|---|---|---|
| Conservative | Julian Cunningham | 761 | 51.3 | -2.7 | |
| Labour | Martin Stears-Handscomb | 399 | 26.9 | +7.1 | |
| UKIP | John Barry | 184 | 12.4 | +12.4 | |
| Liberal Democrats | Margaret Higbid | 88 | 5.9 | -7.6 | |
| Green | Mario May | 51 | 3.4 | -9.3 | |
| Majority | 362 | 24.4 | |||
| Turnout | 1,483 | ||||
| Conservative hold | Swing | ||||
| Party | Candidate | Votes | % | ±% | |
|---|---|---|---|---|---|
| Labour | Frank Radcliffe | 361 | 48.0 | -12.8 | |
| Conservative | Mara MacSeoinin | 180 | 23.9 | -0.7 | |
| UKIP | Peter Croft | 148 | 19.7 | +19.7 | |
| Green | Jacqueline Greatorex | 32 | 4.3 | -5.5 | |
| Liberal Democrats | Clare Body | 31 | 4.1 | -0.7 | |
| Majority | 181 | 24.1 | |||
| Turnout | 752 | ||||
| Labour hold | Swing | ||||
2014-2018
| Party | Candidate | Votes | % | ±% | |
|---|---|---|---|---|---|
| Labour | Martin Stears-Handscomb | 258 | 31.9 | -17.4 | |
| Independent | Jackie McDonald | 200 | 24.8 | +24.8 | |
| Conservative | Serena Farrow | 158 | 19.6 | -12.4 | |
| Liberal Democrats | Louise Peace | 150 | 18.6 | +9.9 | |
| Green | George Howe | 42 | 5.2 | -4.8 | |
| Majority | 58 | 7.2 | |||
| Turnout | 808 | ||||
| Labour hold | Swing | ||||
| Party | Candidate | Votes | % | ±% | |
|---|---|---|---|---|---|
| Conservative | Raymond Shakespeare-Smith | 717 | 41.7 | -2.6 | |
| Liberal Democrats | John Hefford | 394 | 22.9 | +12.3 | |
| Independent | Jacqueline McDonald | 277 | 16.1 | +6.1 | |
| Labour | Dave Winstanley | 219 | 12.7 | -5.5 | |
| Green | Des Stephens | 114 | 6.6 | -2.6 | |
| Majority | 323 | 7.2 | |||
| Turnout | 1,721 | ||||
| Conservative hold | Swing | ||||
| Party | Candidate | Votes | % | ±% | |
|---|---|---|---|---|---|
| Conservative | Sarah Dingley | 844 | 50.4 | -0.6 | |
| Liberal Democrats | Carol Stanier | 470 | 28.1 | +14.7 | |
| Labour | Vaughan West | 196 | 11.7 | -4.6 | |
| Green | Katherine Shann | 97 | 5.8 | -1.3 | |
| UKIP | Christopher Arquati | 68 | 4.1 | -8.0 | |
| Majority | 374 | 22.3 | |||
| Turnout | 1,675 | ||||
| Conservative hold | Swing | ||||
2018-2022
| Party | Candidate | Votes | % | ±% | |
|---|---|---|---|---|---|
| Liberal Democrats | Raj Bhakar | 1,238 | 67.0 | +18.6 | |
| Conservative | Samuel Forsyth | 450 | 24.3 | -3.8 | |
| Green | Deolinda Eltringham | 134 | 7.2 | -1.1 | |
| CPA | Leigh Smith | 27 | 1.5 | +0.4 | |
| Majority | 788 | 42.6 | |||
| Turnout | 1,849 | ||||
| Liberal Democrats hold | Swing | ||||
References
- ^ "North Hertfordshire". Local Government Boundary Commission for England. Retrieved 9 April 2023.
- ^ Rallings, Colin; Thrasher, Michael. "North Hertfordshire District Council Election Results 1973–2012" (PDF). The Elections Centre. Plymouth University. Retrieved 4 March 2023.
- ^ Teale, Andrew. "North Hertfordshire". Local Elections Archive Project. Retrieved 9 April 2023.
- ^ The District of North Hertfordshire (Electoral Arrangements) Order 1977 (S.I. 1977/1442)
- ^ "The Bedfordshire and Hertfordshire (County Boundaries) Order 1989", legislation.gov.uk, The National Archives, SI 1989/284, retrieved 5 November 2015
- ^ "The Cambridgeshire, Essex, Hertfordshire and Lincolnshire (County Boundaries) Order 1939", legislation.gov.uk, The National Archives, SI 1989/133, retrieved 5 November 2015
- ^ "The District of North Hertfordshire (Electoral Changes) Order 1998", legislation.gov.uk, The National Archives, SI 1998/2555, retrieved 4 October 2015
- ^ "The District of North Hertfordshire (Electoral Changes) Order 2006", legislation.gov.uk, The National Archives, SI 2006/3112, retrieved 3 November 2015
- ^ "The North Hertfordshire (Electoral Changes) Order 2023", legislation.gov.uk, The National Archives, SI 2023/1024, retrieved 12 May 2024
- ^ "Local Elections Archive Project — Baldock East Ward". www.andrewteale.me.uk. Retrieved 11 May 2024.
- ^ "Meeting of the Council held in the Council Chamber, Council Offices, Gernon Road, Letchworth Garden City on Thursday, 8 December 2005 at 7.30 p.m" (PDF). North Hertfordshire District Council. Retrieved 28 May 2024.
- ^ "Local Elections Archive Project — Hitchwood, Offa and Hoo Ward". www.andrewteale.me.uk. Retrieved 11 May 2024.
- ^ "Local Elections Archive Project — Letchworth South West Ward". www.andrewteale.me.uk. Retrieved 11 May 2024.
- ^ "Local Elections Archive Project — Hitchin Oughton Ward". www.andrewteale.me.uk. Retrieved 11 May 2024.
- ^ "Local Elections Archive Project — Hitchin Oughton Ward". www.andrewteale.me.uk. Retrieved 11 May 2024.
- ^ "Local Elections Archive Project — Hitchin Priory Ward". www.andrewteale.me.uk. Retrieved 11 May 2024.
- ^ "Local Elections Archive Project — Royston Heath Ward". www.andrewteale.me.uk. Retrieved 11 May 2024.
- ^ "Local Elections Archive Project — Hitchin Highbury Ward". www.andrewteale.me.uk. Retrieved 11 May 2024.
External links
One third of North Hertfordshire District Council in England is elected each year, followed by one year without election. A boundary review is underway to allow the council to instead be elected all at once every four years from 2024 onwards. [1]
Elections
The elections have been as follows: [2] [3]
| Year | Seats | Conservative | Labour | Liberal Democrats [a] | Ratepayers | Independent | Notes |
|---|---|---|---|---|---|---|---|
| 1973 | 48 | 23 | 17 | 0 | 1 | 7 | |
| 1976 | 48 | 30 | 11 | 0 | 2 | 5 | |
| 1979 | 50 | 34 | 12 | 0 | 2 | 2 | New ward boundaries. [4] |
| 1980 | 50 | 32 | 14 | 0 | 2 | 2 | |
| 1982 | 50 | 32 | 14 | 0 | 2 | 2 | |
| 1983 | 50 | 30 | 15 | 1 | 2 | 2 | |
| 1984 | 50 | 31 | 12 | 2 | 3 | 2 | |
| 1986 | 50 | 26 | 14 | 7 | 3 | 0 | |
| 1987 | 50 | 26 | 13 | 8 | 3 | 0 | |
| 1988 | 50 | 27 | 13 | 7 | 3 | 0 | |
| 1990 | 50 | 29 | 15 | 3 | 3 | 0 | District boundary changes took place but the number of seats remained the same. [5] [6] |
| 1991 | 50 | 26 | 18 | 2 | 3 | 1 | |
| 1992 | 50 | 26 | 17 | 3 | 3 | 1 | |
| 1994 | 50 | 25 | 18 | 5 | 1 | 1 | |
| 1995 | 50 | 22 | 21 | 6 | 0 | 1 | |
| 1996 | 50 | 16 | 26 | 7 | 0 | 1 | |
| 1998 | 50 | 17 | 26 | 6 | 0 | 1 | |
| 1999 | 49 | 28 | 18 | 3 | 0 | 0 | New ward boundaries. [7] |
| 2000 | 49 | 29 | 18 | 2 | 0 | 0 | |
| 2002 | 49 | 28 | 17 | 4 | 0 | 0 | |
| 2003 | 49 | 27 | 16 | 6 | 0 | 0 | |
| 2004 | 49 | 28 | 14 | 7 | 0 | 0 | |
| 2006 | 49 | 33 | 9 | 7 | 0 | 0 | |
| 2007 | 49 | 30 | 10 | 9 | 0 | 0 | New ward boundaries. [8] |
| 2008 | 49 | 32 | 8 | 9 | 0 | 0 | |
| 2010 | 49 | 33 | 7 | 9 | 0 | 0 | |
| 2011 | 49 | 34 | 7 | 8 | 0 | 0 | |
| 2012 | 49 | 33 | 10 | 6 | 0 | 0 | |
| 2014 | 49 | 34 | 12 | 3 | 0 | 0 | |
| 2015 | 49 | 36 | 11 | 2 | 0 | 0 | |
| 2016 | 49 | 34 | 12 | 3 | 0 | 0 | |
| 2018 | 49 | 29 | 14 | 6 | 0 | 0 | |
| 2019 | 49 | 22 | 16 | 11 | 0 | 0 | |
| 2021 | 49 | 23 | 15 | 11 | 0 | 0 | |
| 2022 | 49 | 19 | 17 | 13 | 0 | 0 | |
| 2023 | 49 | 15 | 19 | 15 | 0 | 0 | |
| 2024 | 51 | 7 | 25 | 19 | 0 | 0 | New ward boundaries. [9] |
Borough result maps
-
2015 results map
-
2016 results map
-
2018 results map
-
2019 results map
-
2021 results map
-
2022 results map
-
2023 results map
-
2024 results map
By-elections
2002-2006
| Party | Candidate | Votes | % | ±% | |
|---|---|---|---|---|---|
| Liberal Democrats | Marilyn Kirkland [11] | 331 | 48.3 | -4.7 | |
| Conservative | 324 | 47.2 | +0.2 | ||
| Labour | 31 | 4.5 | +4.5 | ||
| Majority | 7 | 1.0 | |||
| Turnout | 686 | ||||
| Liberal Democrats hold | Swing | ||||
2010-2014
| Party | Candidate | Votes | % | ±% | |
|---|---|---|---|---|---|
| Conservative | Faye Barnard | 774 | 56.8 | -7.4 | |
| UKIP | Peter Robbins | 217 | 15.9 | +15.9 | |
| Labour | Jackie McDonald | 189 | 13.9 | -3.1 | |
| Liberal Democrats | Peter Johnson | 110 | 8.1 | +0.4 | |
| Green | George Howe | 72 | 5.3 | -5.8 | |
| Majority | 557 | 40.9 | |||
| Turnout | 1,362 | ||||
| Conservative hold | Swing | ||||
| Party | Candidate | Votes | % | ±% | |
|---|---|---|---|---|---|
| Conservative | Julian Cunningham | 761 | 51.3 | -2.7 | |
| Labour | Martin Stears-Handscomb | 399 | 26.9 | +7.1 | |
| UKIP | John Barry | 184 | 12.4 | +12.4 | |
| Liberal Democrats | Margaret Higbid | 88 | 5.9 | -7.6 | |
| Green | Mario May | 51 | 3.4 | -9.3 | |
| Majority | 362 | 24.4 | |||
| Turnout | 1,483 | ||||
| Conservative hold | Swing | ||||
| Party | Candidate | Votes | % | ±% | |
|---|---|---|---|---|---|
| Labour | Frank Radcliffe | 361 | 48.0 | -12.8 | |
| Conservative | Mara MacSeoinin | 180 | 23.9 | -0.7 | |
| UKIP | Peter Croft | 148 | 19.7 | +19.7 | |
| Green | Jacqueline Greatorex | 32 | 4.3 | -5.5 | |
| Liberal Democrats | Clare Body | 31 | 4.1 | -0.7 | |
| Majority | 181 | 24.1 | |||
| Turnout | 752 | ||||
| Labour hold | Swing | ||||
2014-2018
| Party | Candidate | Votes | % | ±% | |
|---|---|---|---|---|---|
| Labour | Martin Stears-Handscomb | 258 | 31.9 | -17.4 | |
| Independent | Jackie McDonald | 200 | 24.8 | +24.8 | |
| Conservative | Serena Farrow | 158 | 19.6 | -12.4 | |
| Liberal Democrats | Louise Peace | 150 | 18.6 | +9.9 | |
| Green | George Howe | 42 | 5.2 | -4.8 | |
| Majority | 58 | 7.2 | |||
| Turnout | 808 | ||||
| Labour hold | Swing | ||||
| Party | Candidate | Votes | % | ±% | |
|---|---|---|---|---|---|
| Conservative | Raymond Shakespeare-Smith | 717 | 41.7 | -2.6 | |
| Liberal Democrats | John Hefford | 394 | 22.9 | +12.3 | |
| Independent | Jacqueline McDonald | 277 | 16.1 | +6.1 | |
| Labour | Dave Winstanley | 219 | 12.7 | -5.5 | |
| Green | Des Stephens | 114 | 6.6 | -2.6 | |
| Majority | 323 | 7.2 | |||
| Turnout | 1,721 | ||||
| Conservative hold | Swing | ||||
| Party | Candidate | Votes | % | ±% | |
|---|---|---|---|---|---|
| Conservative | Sarah Dingley | 844 | 50.4 | -0.6 | |
| Liberal Democrats | Carol Stanier | 470 | 28.1 | +14.7 | |
| Labour | Vaughan West | 196 | 11.7 | -4.6 | |
| Green | Katherine Shann | 97 | 5.8 | -1.3 | |
| UKIP | Christopher Arquati | 68 | 4.1 | -8.0 | |
| Majority | 374 | 22.3 | |||
| Turnout | 1,675 | ||||
| Conservative hold | Swing | ||||
2018-2022
| Party | Candidate | Votes | % | ±% | |
|---|---|---|---|---|---|
| Liberal Democrats | Raj Bhakar | 1,238 | 67.0 | +18.6 | |
| Conservative | Samuel Forsyth | 450 | 24.3 | -3.8 | |
| Green | Deolinda Eltringham | 134 | 7.2 | -1.1 | |
| CPA | Leigh Smith | 27 | 1.5 | +0.4 | |
| Majority | 788 | 42.6 | |||
| Turnout | 1,849 | ||||
| Liberal Democrats hold | Swing | ||||
References
- ^ "North Hertfordshire". Local Government Boundary Commission for England. Retrieved 9 April 2023.
- ^ Rallings, Colin; Thrasher, Michael. "North Hertfordshire District Council Election Results 1973–2012" (PDF). The Elections Centre. Plymouth University. Retrieved 4 March 2023.
- ^ Teale, Andrew. "North Hertfordshire". Local Elections Archive Project. Retrieved 9 April 2023.
- ^ The District of North Hertfordshire (Electoral Arrangements) Order 1977 (S.I. 1977/1442)
- ^ "The Bedfordshire and Hertfordshire (County Boundaries) Order 1989", legislation.gov.uk, The National Archives, SI 1989/284, retrieved 5 November 2015
- ^ "The Cambridgeshire, Essex, Hertfordshire and Lincolnshire (County Boundaries) Order 1939", legislation.gov.uk, The National Archives, SI 1989/133, retrieved 5 November 2015
- ^ "The District of North Hertfordshire (Electoral Changes) Order 1998", legislation.gov.uk, The National Archives, SI 1998/2555, retrieved 4 October 2015
- ^ "The District of North Hertfordshire (Electoral Changes) Order 2006", legislation.gov.uk, The National Archives, SI 2006/3112, retrieved 3 November 2015
- ^ "The North Hertfordshire (Electoral Changes) Order 2023", legislation.gov.uk, The National Archives, SI 2023/1024, retrieved 12 May 2024
- ^ "Local Elections Archive Project — Baldock East Ward". www.andrewteale.me.uk. Retrieved 11 May 2024.
- ^ "Meeting of the Council held in the Council Chamber, Council Offices, Gernon Road, Letchworth Garden City on Thursday, 8 December 2005 at 7.30 p.m" (PDF). North Hertfordshire District Council. Retrieved 28 May 2024.
- ^ "Local Elections Archive Project — Hitchwood, Offa and Hoo Ward". www.andrewteale.me.uk. Retrieved 11 May 2024.
- ^ "Local Elections Archive Project — Letchworth South West Ward". www.andrewteale.me.uk. Retrieved 11 May 2024.
- ^ "Local Elections Archive Project — Hitchin Oughton Ward". www.andrewteale.me.uk. Retrieved 11 May 2024.
- ^ "Local Elections Archive Project — Hitchin Oughton Ward". www.andrewteale.me.uk. Retrieved 11 May 2024.
- ^ "Local Elections Archive Project — Hitchin Priory Ward". www.andrewteale.me.uk. Retrieved 11 May 2024.
- ^ "Local Elections Archive Project — Royston Heath Ward". www.andrewteale.me.uk. Retrieved 11 May 2024.
- ^ "Local Elections Archive Project — Hitchin Highbury Ward". www.andrewteale.me.uk. Retrieved 11 May 2024.