Lommiswil | |
|---|---|
 Coat of arms | |
 Lommiswil  Lommiswil | |
| Coordinates: 47°13′N 7°28′E / 47.217°N 7.467°E | |
| Country | Switzerland |
| Canton | Solothurn |
| District | Lebern |
| Area | |
| • Total | 5.76 km2 (2.22 sq mi) |
| Elevation | 564 m (1,850 ft) |
| Population (31 December 2018)
[2] | |
| • Total | 1,535 |
| • Density | 270/km2 (690/sq mi) |
| Time zone | UTC+01:00 ( Central European Time) |
| • Summer ( DST) | UTC+02:00 ( Central European Summer Time) |
| Postal code(s) | 4514 |
| SFOS number | 2551 |
| ISO 3166 code | CH-SO |
| Surrounded by | Bellach, Oberdorf, Selzach |
| Website |
lommiswil SFSO statistics |
Lommiswil is a municipality in the district of Lebern in the canton of Solothurn in Switzerland.
History
Lommiswil is first mentioned in 1292 as Lomolzwile. [3]
Geography
Lommiswil has an area, as of 2009 [update], of 5.78 square kilometers (2.23 sq mi). Of this area, 2.54 km2 (0.98 sq mi) or 43.9% is used for agricultural purposes, while 2.48 km2 (0.96 sq mi) or 42.9% is forested. Of the rest of the land, 0.74 km2 (0.29 sq mi) or 12.8% is settled (buildings or roads). [4]
Of the built up area, housing and buildings made up 8.1% and transportation infrastructure made up 3.3%. Power and water infrastructure as well as other special developed areas made up 1.2% of the area Out of the forested land, all of the forested land area is covered with heavy forests. Of the agricultural land, 35.3% is used for growing crops and 7.4% is pastures, while 1.2% is used for orchards or vine crops. [4]
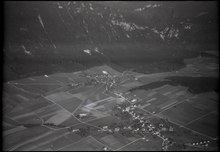
The municipality is located in the Lebern district, on a plateau in the southern foothills of the Jura Mountains. It consists of the village of Lommiswil and the settlement of Im Holz.
Coat of arms
The blazon of the municipal coat of arms is Azure a Lamb Argent passant over a base Vert holding a Flagstaff Or with a swallow-tailed Flag Gules a Cross Argent. [5]
Demographics
Lommiswil has a population (as of December 2020 [update]) of 1,587. [6] As of 2008 [update], 7.4% of the population are resident foreign nationals. [7] Over the last 10 years (1999–2009 ) the population has changed at a rate of 2.7%. [8]
Most of the population (as of 2000 [update]) speaks German (1,338 or 95.6%), with French being second most common (13 or 0.9%) and Italian being third (12 or 0.9%). [9]
As of 2008 [update], the gender distribution of the population was 51.5% male and 48.5% female. The population was made up of 693 Swiss men (47.2% of the population) and 63 (4.3%) non-Swiss men. There were 652 Swiss women (44.4%) and 59 (4.0%) non-Swiss women. [10] Of the population in the municipality 463 or about 33.1% were born in Lommiswil and lived there in 2000. There were 461 or 33.0% who were born in the same canton, while 325 or 23.2% were born somewhere else in Switzerland, and 123 or 8.8% were born outside of Switzerland. [9]
In 2008 [update] there were 9 live births to Swiss citizens and 1 birth to non-Swiss citizens, and in same time span there were 13 deaths of Swiss citizens. Ignoring immigration and emigration, the population of Swiss citizens decreased by 4 while the foreign population increased by 1. There were 2 Swiss women who immigrated back to Switzerland. The total Swiss population change in 2008 (from all sources, including moves across municipal borders) was an increase of 29 and the non-Swiss population remained the same. This represents a population growth rate of 2.0%. [7]
The age distribution, as of 2000 [update], in Lommiswil is; 106 children or 7.6% of the population are between 0 and 6 years old and 234 teenagers or 16.7% are between 7 and 19. Of the adult population, 77 people or 5.5% of the population are between 20 and 24 years old. 359 people or 25.7% are between 25 and 44, and 435 people or 31.1% are between 45 and 64. The senior population distribution is 148 people or 10.6% of the population are between 65 and 79 years old and there are 40 people or 2.9% who are over 80. [11]
As of 2000 [update], there were 524 people who were single and never married in the municipality. There were 763 married individuals, 59 widows or widowers and 53 individuals who are divorced. [9]
As of 2000 [update], there were 531 private households in the municipality, and an average of 2.6 persons per household. [8] There were 104 households that consist of only one person and 44 households with five or more people. Out of a total of 537 households that answered this question, 19.4% were households made up of just one person and there were 6 adults who lived with their parents. Of the rest of the households, there are 190 married couples without children, 214 married couples with children There were 15 single parents with a child or children. There were 2 households that were made up of unrelated people and 6 households that were made up of some sort of institution or another collective housing. [9]
In 2000 [update] there were 342 single family homes (or 77.6% of the total) out of a total of 441 inhabited buildings. There were 52 multi-family buildings (11.8%), along with 39 multi-purpose buildings that were mostly used for housing (8.8%) and 8 other use buildings (commercial or industrial) that also had some housing (1.8%). Of the single family homes 25 were built before 1919, while 42 were built between 1990 and 2000. The greatest number of single family homes (89) were built between 1981 and 1990. [12]
In 2000 [update] there were 546 apartments in the municipality. The most common apartment size was 4 rooms of which there were 173. There were 6 single room apartments and 289 apartments with five or more rooms. Of these apartments, a total of 522 apartments (95.6% of the total) were permanently occupied, while 11 apartments (2.0%) were seasonally occupied and 13 apartments (2.4%) were empty. [12] As of 2009 [update], the construction rate of new housing units was 4.8 new units per 1000 residents. [8] The vacancy rate for the municipality, in 2010 [update], was 4.69%. [8]
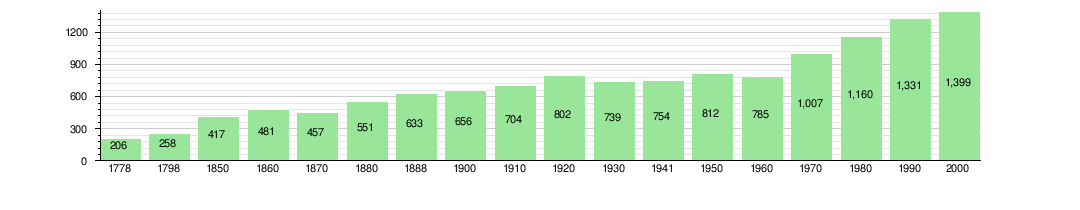
The historical population is given in the following chart: [3] [13]
Politics
In the 2007 federal election the most popular party was the SVP which received 24.93% of the vote. The next three most popular parties were the FDP (21.6%), the CVP (20.88%) and the SP (18.93%). In the federal election, a total of 629 votes were cast, and the voter turnout was 59.4%. [14]
Economy
As of 2010 [update], Lommiswil had an unemployment rate of 1.8%. As of 2008 [update], there were 35 people employed in the primary economic sector and about 14 businesses involved in this sector. 18 people were employed in the secondary sector and there were 7 businesses in this sector. 88 people were employed in the tertiary sector, with 31 businesses in this sector. [8] There were 781 residents of the municipality who were employed in some capacity, of which females made up 43.5% of the workforce.
In 2008 [update] the total number of full-time equivalent jobs was 100. The number of jobs in the primary sector was 23, all of which were in agriculture. The number of jobs in the secondary sector was 14 of which 10 or (71.4%) were in manufacturing and 4 (28.6%) were in construction. The number of jobs in the tertiary sector was 63. In the tertiary sector; 9 or 14.3% were in wholesale or retail sales or the repair of motor vehicles, 4 or 6.3% were in the movement and storage of goods, 4 or 6.3% were in a hotel or restaurant, 14 or 22.2% were in the information industry, 10 or 15.9% were technical professionals or scientists, 8 or 12.7% were in education and 4 or 6.3% were in health care. [15]
In 2000 [update], there were 53 workers who commuted into the municipality and 643 workers who commuted away. The municipality is a net exporter of workers, with about 12.1 workers leaving the municipality for every one entering. [16] Of the working population, 17.4% used public transportation to get to work, and 62.1% used a private car. [8]
Religion
From the 2000 census [update], 631 or 45.1% were Roman Catholic, while 523 or 37.4% belonged to the Swiss Reformed Church. Of the rest of the population, there were 3 individuals (or about 0.21% of the population) who belonged to the Christian Catholic Church, and there were 20 individuals (or about 1.43% of the population) who belonged to another Christian church. There were 4 (or about 0.29% of the population) who were Islamic. There were 3 individuals who were Buddhist. 194 (or about 13.87% of the population) belonged to no church, are agnostic or atheist, and 21 individuals (or about 1.50% of the population) did not answer the question. [9]
Education
In Lommiswil about 596 or (42.6%) of the population have completed non-mandatory upper secondary education, and 239 or (17.1%) have completed additional higher education (either university or a Fachhochschule). Of the 239 who completed tertiary schooling, 68.2% were Swiss men, 20.5% were Swiss women, 7.1% were non-Swiss men and 4.2% were non-Swiss women. [9]
As of 2000 [update], there were 8 students in Lommiswil who came from another municipality, while 119 residents attended schools outside the municipality. [16]

References
- ^ a b "Arealstatistik Standard - Gemeinden nach 4 Hauptbereichen". Federal Statistical Office. Retrieved 13 January 2019.
- ^ "Ständige Wohnbevölkerung nach Staatsangehörigkeitskategorie Geschlecht und Gemeinde; Provisorische Jahresergebnisse; 2018". Federal Statistical Office. 9 April 2019. Retrieved 11 April 2019.
- ^ a b Lommiswil in German, French and Italian in the online Historical Dictionary of Switzerland.
- ^ a b Swiss Federal Statistical Office-Land Use Statistics 2009 data (in German). Retrieved 25 March 2010
- ^ Flags of the World.com. Retrieved 3 April 2011
- ^ "Ständige und nichtständige Wohnbevölkerung nach institutionellen Gliederungen, Geburtsort und Staatsangehörigkeit". bfs.admin.ch (in German). Swiss Federal Statistical Office - STAT-TAB. 31 December 2020. Retrieved 21 September 2021.
- ^ a b Swiss Federal Statistical Office – Superweb database – Gemeinde Statistics 1981-2008 Archived 28 June 2010 at the Wayback Machine (in German). Retrieved 19 June 2010
- ^ a b c d e f Swiss Federal Statistical Office Archived 5 January 2016 at the Wayback Machine. Retrieved 3 April 2011
- ^ a b c d e f STAT-TAB Datenwürfel für Thema 40.3 – 2000 Archived 9 August 2013 at the Wayback Machine (in German). Retrieved 2 February 2011
- ^ Canton of Solothurn Statistics – Wohnbevölkerung der Gemeinden nach Nationalität und Geschlecht Archived 5 March 2011 at the Wayback Machine (in German). Retrieved 11 March 2011
- ^ Canton of Solothurn Statistics – Wohnbevölkerung nach Gemeinden, Nationalität, Altersgruppen und Zivilstand, Total (Männer + Frauen) Archived 7 July 2011 at the Wayback Machine (in German). Retrieved 11 March 2011
- ^ a b Federal Statistical Office STAT-TAB – Datenwürfel für Thema 09.2 – Gebäude und Wohnungen Archived 21 January 2015 at the Wayback Machine (in German). Retrieved 28 January 2011
- ^ Swiss Federal Statistical Office STAT-TAB Bevölkerungsentwicklung nach Region, 1850-2000 Archived 30 September 2014 at the Wayback Machine (in German). Retrieved 29 January 2011
- ^ Swiss Federal Statistical Office, Nationalratswahlen 2007: Stärke der Parteien und Wahlbeteiligung, nach Gemeinden/Bezirk/Canton Archived 14 May 2015 at the Wayback Machine (in German). Retrieved 28 May 2010
- ^ Swiss Federal Statistical Office STAT-TAB Betriebszählung: Arbeitsstätten nach Gemeinde und NOGA 2008 (Abschnitte), Sektoren 1-3 Archived 25 December 2014 at the Wayback Machine (in German). Retrieved 28 January 2011
- ^ a b Swiss Federal Statistical Office – Statweb Archived 4 August 2012 at archive.today (in German). Retrieved 24 June 2010
| International | |
|---|---|
| Other | |
Lommiswil | |
|---|---|
|
Coat of arms | |
Lommiswil Lommiswil | |
| Coordinates: 47°13′N 7°28′E / 47.217°N 7.467°E | |
| Country | Switzerland |
| Canton | Solothurn |
| District | Lebern |
| Area | |
| • Total | 5.76 km2 (2.22 sq mi) |
| Elevation | 564 m (1,850 ft) |
| Population (31 December 2018)
[2] | |
| • Total | 1,535 |
| • Density | 270/km2 (690/sq mi) |
| Time zone | UTC+01:00 ( Central European Time) |
| • Summer ( DST) | UTC+02:00 ( Central European Summer Time) |
| Postal code(s) | 4514 |
| SFOS number | 2551 |
| ISO 3166 code | CH-SO |
| Surrounded by | Bellach, Oberdorf, Selzach |
| Website |
lommiswil SFSO statistics |
Lommiswil is a municipality in the district of Lebern in the canton of Solothurn in Switzerland.
History
Lommiswil is first mentioned in 1292 as Lomolzwile. [3]
Geography
Lommiswil has an area, as of 2009 [update], of 5.78 square kilometers (2.23 sq mi). Of this area, 2.54 km2 (0.98 sq mi) or 43.9% is used for agricultural purposes, while 2.48 km2 (0.96 sq mi) or 42.9% is forested. Of the rest of the land, 0.74 km2 (0.29 sq mi) or 12.8% is settled (buildings or roads). [4]
Of the built up area, housing and buildings made up 8.1% and transportation infrastructure made up 3.3%. Power and water infrastructure as well as other special developed areas made up 1.2% of the area Out of the forested land, all of the forested land area is covered with heavy forests. Of the agricultural land, 35.3% is used for growing crops and 7.4% is pastures, while 1.2% is used for orchards or vine crops. [4]
The municipality is located in the Lebern district, on a plateau in the southern foothills of the Jura Mountains. It consists of the village of Lommiswil and the settlement of Im Holz.
Coat of arms
The blazon of the municipal coat of arms is Azure a Lamb Argent passant over a base Vert holding a Flagstaff Or with a swallow-tailed Flag Gules a Cross Argent. [5]
Demographics
Lommiswil has a population (as of December 2020 [update]) of 1,587. [6] As of 2008 [update], 7.4% of the population are resident foreign nationals. [7] Over the last 10 years (1999–2009 ) the population has changed at a rate of 2.7%. [8]
Most of the population (as of 2000 [update]) speaks German (1,338 or 95.6%), with French being second most common (13 or 0.9%) and Italian being third (12 or 0.9%). [9]
As of 2008 [update], the gender distribution of the population was 51.5% male and 48.5% female. The population was made up of 693 Swiss men (47.2% of the population) and 63 (4.3%) non-Swiss men. There were 652 Swiss women (44.4%) and 59 (4.0%) non-Swiss women. [10] Of the population in the municipality 463 or about 33.1% were born in Lommiswil and lived there in 2000. There were 461 or 33.0% who were born in the same canton, while 325 or 23.2% were born somewhere else in Switzerland, and 123 or 8.8% were born outside of Switzerland. [9]
In 2008 [update] there were 9 live births to Swiss citizens and 1 birth to non-Swiss citizens, and in same time span there were 13 deaths of Swiss citizens. Ignoring immigration and emigration, the population of Swiss citizens decreased by 4 while the foreign population increased by 1. There were 2 Swiss women who immigrated back to Switzerland. The total Swiss population change in 2008 (from all sources, including moves across municipal borders) was an increase of 29 and the non-Swiss population remained the same. This represents a population growth rate of 2.0%. [7]
The age distribution, as of 2000 [update], in Lommiswil is; 106 children or 7.6% of the population are between 0 and 6 years old and 234 teenagers or 16.7% are between 7 and 19. Of the adult population, 77 people or 5.5% of the population are between 20 and 24 years old. 359 people or 25.7% are between 25 and 44, and 435 people or 31.1% are between 45 and 64. The senior population distribution is 148 people or 10.6% of the population are between 65 and 79 years old and there are 40 people or 2.9% who are over 80. [11]
As of 2000 [update], there were 524 people who were single and never married in the municipality. There were 763 married individuals, 59 widows or widowers and 53 individuals who are divorced. [9]
As of 2000 [update], there were 531 private households in the municipality, and an average of 2.6 persons per household. [8] There were 104 households that consist of only one person and 44 households with five or more people. Out of a total of 537 households that answered this question, 19.4% were households made up of just one person and there were 6 adults who lived with their parents. Of the rest of the households, there are 190 married couples without children, 214 married couples with children There were 15 single parents with a child or children. There were 2 households that were made up of unrelated people and 6 households that were made up of some sort of institution or another collective housing. [9]
In 2000 [update] there were 342 single family homes (or 77.6% of the total) out of a total of 441 inhabited buildings. There were 52 multi-family buildings (11.8%), along with 39 multi-purpose buildings that were mostly used for housing (8.8%) and 8 other use buildings (commercial or industrial) that also had some housing (1.8%). Of the single family homes 25 were built before 1919, while 42 were built between 1990 and 2000. The greatest number of single family homes (89) were built between 1981 and 1990. [12]
In 2000 [update] there were 546 apartments in the municipality. The most common apartment size was 4 rooms of which there were 173. There were 6 single room apartments and 289 apartments with five or more rooms. Of these apartments, a total of 522 apartments (95.6% of the total) were permanently occupied, while 11 apartments (2.0%) were seasonally occupied and 13 apartments (2.4%) were empty. [12] As of 2009 [update], the construction rate of new housing units was 4.8 new units per 1000 residents. [8] The vacancy rate for the municipality, in 2010 [update], was 4.69%. [8]
The historical population is given in the following chart: [3] [13]
Politics
In the 2007 federal election the most popular party was the SVP which received 24.93% of the vote. The next three most popular parties were the FDP (21.6%), the CVP (20.88%) and the SP (18.93%). In the federal election, a total of 629 votes were cast, and the voter turnout was 59.4%. [14]
Economy
As of 2010 [update], Lommiswil had an unemployment rate of 1.8%. As of 2008 [update], there were 35 people employed in the primary economic sector and about 14 businesses involved in this sector. 18 people were employed in the secondary sector and there were 7 businesses in this sector. 88 people were employed in the tertiary sector, with 31 businesses in this sector. [8] There were 781 residents of the municipality who were employed in some capacity, of which females made up 43.5% of the workforce.
In 2008 [update] the total number of full-time equivalent jobs was 100. The number of jobs in the primary sector was 23, all of which were in agriculture. The number of jobs in the secondary sector was 14 of which 10 or (71.4%) were in manufacturing and 4 (28.6%) were in construction. The number of jobs in the tertiary sector was 63. In the tertiary sector; 9 or 14.3% were in wholesale or retail sales or the repair of motor vehicles, 4 or 6.3% were in the movement and storage of goods, 4 or 6.3% were in a hotel or restaurant, 14 or 22.2% were in the information industry, 10 or 15.9% were technical professionals or scientists, 8 or 12.7% were in education and 4 or 6.3% were in health care. [15]
In 2000 [update], there were 53 workers who commuted into the municipality and 643 workers who commuted away. The municipality is a net exporter of workers, with about 12.1 workers leaving the municipality for every one entering. [16] Of the working population, 17.4% used public transportation to get to work, and 62.1% used a private car. [8]
Religion
From the 2000 census [update], 631 or 45.1% were Roman Catholic, while 523 or 37.4% belonged to the Swiss Reformed Church. Of the rest of the population, there were 3 individuals (or about 0.21% of the population) who belonged to the Christian Catholic Church, and there were 20 individuals (or about 1.43% of the population) who belonged to another Christian church. There were 4 (or about 0.29% of the population) who were Islamic. There were 3 individuals who were Buddhist. 194 (or about 13.87% of the population) belonged to no church, are agnostic or atheist, and 21 individuals (or about 1.50% of the population) did not answer the question. [9]
Education
In Lommiswil about 596 or (42.6%) of the population have completed non-mandatory upper secondary education, and 239 or (17.1%) have completed additional higher education (either university or a Fachhochschule). Of the 239 who completed tertiary schooling, 68.2% were Swiss men, 20.5% were Swiss women, 7.1% were non-Swiss men and 4.2% were non-Swiss women. [9]
As of 2000 [update], there were 8 students in Lommiswil who came from another municipality, while 119 residents attended schools outside the municipality. [16]
References
- ^ a b "Arealstatistik Standard - Gemeinden nach 4 Hauptbereichen". Federal Statistical Office. Retrieved 13 January 2019.
- ^ "Ständige Wohnbevölkerung nach Staatsangehörigkeitskategorie Geschlecht und Gemeinde; Provisorische Jahresergebnisse; 2018". Federal Statistical Office. 9 April 2019. Retrieved 11 April 2019.
- ^ a b Lommiswil in German, French and Italian in the online Historical Dictionary of Switzerland.
- ^ a b Swiss Federal Statistical Office-Land Use Statistics 2009 data (in German). Retrieved 25 March 2010
- ^ Flags of the World.com. Retrieved 3 April 2011
- ^ "Ständige und nichtständige Wohnbevölkerung nach institutionellen Gliederungen, Geburtsort und Staatsangehörigkeit". bfs.admin.ch (in German). Swiss Federal Statistical Office - STAT-TAB. 31 December 2020. Retrieved 21 September 2021.
- ^ a b Swiss Federal Statistical Office – Superweb database – Gemeinde Statistics 1981-2008 Archived 28 June 2010 at the Wayback Machine (in German). Retrieved 19 June 2010
- ^ a b c d e f Swiss Federal Statistical Office Archived 5 January 2016 at the Wayback Machine. Retrieved 3 April 2011
- ^ a b c d e f STAT-TAB Datenwürfel für Thema 40.3 – 2000 Archived 9 August 2013 at the Wayback Machine (in German). Retrieved 2 February 2011
- ^ Canton of Solothurn Statistics – Wohnbevölkerung der Gemeinden nach Nationalität und Geschlecht Archived 5 March 2011 at the Wayback Machine (in German). Retrieved 11 March 2011
- ^ Canton of Solothurn Statistics – Wohnbevölkerung nach Gemeinden, Nationalität, Altersgruppen und Zivilstand, Total (Männer + Frauen) Archived 7 July 2011 at the Wayback Machine (in German). Retrieved 11 March 2011
- ^ a b Federal Statistical Office STAT-TAB – Datenwürfel für Thema 09.2 – Gebäude und Wohnungen Archived 21 January 2015 at the Wayback Machine (in German). Retrieved 28 January 2011
- ^ Swiss Federal Statistical Office STAT-TAB Bevölkerungsentwicklung nach Region, 1850-2000 Archived 30 September 2014 at the Wayback Machine (in German). Retrieved 29 January 2011
- ^ Swiss Federal Statistical Office, Nationalratswahlen 2007: Stärke der Parteien und Wahlbeteiligung, nach Gemeinden/Bezirk/Canton Archived 14 May 2015 at the Wayback Machine (in German). Retrieved 28 May 2010
- ^ Swiss Federal Statistical Office STAT-TAB Betriebszählung: Arbeitsstätten nach Gemeinde und NOGA 2008 (Abschnitte), Sektoren 1-3 Archived 25 December 2014 at the Wayback Machine (in German). Retrieved 28 January 2011
- ^ a b Swiss Federal Statistical Office – Statweb Archived 4 August 2012 at archive.today (in German). Retrieved 24 June 2010
| International | |
|---|---|
| Other | |