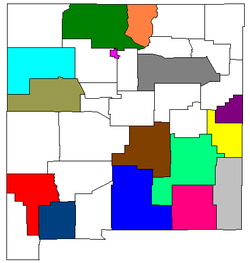
The State of New Mexico has a total of fifteen micropolitan areas. As of the 2000 Census, these counties had a combined population of 589,371 (32.4% of the state's total population). Based on a July 1, 2009 population estimate, that figure had increased to 597,079 (29.7% of the state's total population). [1]
|
|
1 - part of the
Clovis-Portales combined statistical area
2 - part of the
Albuquerque-Santa Fe-Las Vegas combined statistical area
| Micropolitan Statistical Area | July 1, 2009 Estimate |
2000 Population |
Percent Change (2000–2009) |
|---|---|---|---|
| Alamogordo | 63,201 | 62,298 | 1.45% |
| Carlsbad-Artesia | 52,706 | 51,658 | –2.03% |
| Clovis | 44,407 | 45,044 | –1.41% |
| Deming | 27,044 | 25,016 | 8.11% |
| Espanola | 40,678 | 41,190 | –1.24% |
| Gallup | 70,513 | 74,798 | –5.73% |
| Grants | 27,036 | 25,595 | 5.63% |
| Hobbs | 60,232 | 55,511 | 8.50% |
| Las Vegas | 28,323 | 30,126 | –5.98% |
| Los Alamos | 18,074 | 18,343 | –1.47% |
| Portales | 18,817 | 18,018 | 4.43% |
| Roswell | 63,322 | 61,382 | 3.65% |
| Ruidoso | 21,016 | 19,411 | 8.27% |
| Silver City | 29,903 | 31,002 | –3.54% |
| Taos | 31,507 | 29,979 | 5.10% |
- List of metropolitan areas in New Mexico
- List of cities in New Mexico
- New Mexico census statistical areas
- Table of United States primary census statistical areas (PCSA)
- Table of United States Combined Statistical Areas (CSA)
- Table of United States Metropolitan Statistical Areas (MSA)
- Table of United States Micropolitan Statistical Areas (μSA)
- ^ "Table 1. Annual Estimates of the Population for Counties of New Mexico: April 1, 2000 to July 1, 2009" ( CSV). 2009 Population Estimates. United States Census Bureau, Population Division. March 23, 2010. Retrieved March 28, 2010.