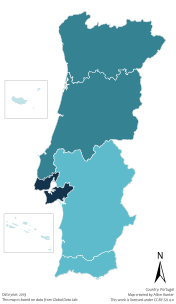
Scale:
> 0.900
0.875 – 0.850
0.850 – 0.825
< 0.825
This is a list of NUTS2 statistical regions of Portugal by Human Development Index as of 2021. [1]
| Rank | Province | HDI (2021) |
|---|---|---|
| Very high human development | ||
| 1 | Lisbon metropolitan area | 0.900 |
| – | 0.866 | |
| 2 | Centro | 0.857 |
| 3 | Norte | 0.852 |
| 4 | Algarve | 0.849 |
| 5 | Alentejo | 0.842 |
| 6 | Madeira | 0.819 |
| 7 | Azores | 0.808 |
References
- ^ "Sub-national HDI - Subnational HDI - Global Data Lab". globaldatalab.org. Retrieved 31 July 2023.