Hermrigen | |
|---|---|
 Coat of arms | |
 Hermrigen  Hermrigen | |
| Coordinates: 47°5′N 7°15′E / 47.083°N 7.250°E | |
| Country | Switzerland |
| Canton | Bern |
| District | Seeland |
| Area | |
| • Total | 3.5 km2 (1.4 sq mi) |
| Elevation | 513 m (1,683 ft) |
| Population (31 December 2018)
[2] | |
| • Total | 321 |
| • Density | 92/km2 (240/sq mi) |
| Time zone | UTC+01:00 ( Central European Time) |
| • Summer ( DST) | UTC+02:00 ( Central European Summer Time) |
| Postal code(s) | 3274 |
| SFOS number | 0737 |
| ISO 3166 code | CH-BE |
| Surrounded by | Bellmund, Bühl, Epsach, Kappelen, Merzligen, Mörigen, Sutz-Lattrigen |
| Website |
http://www.hermrigen.ch SFSO statistics |
Hermrigen is a municipality in the Seeland administrative district in the canton of Bern in Switzerland.
History
Hermrigen is first mentioned in 1249 as Hermeringen. [3]
The oldest trace of a settlement in the area are scattered Stone Age (probably Mesolithic) items which were found at Schönbrünnefeld. A Hallstatt era grave mound has been found in the Hermrigenmoos-Holehölzli. A few Roman era artifacts were also found around the municipality. During the Middle Ages a number of Ministerialis (unfree knights in the service of a feudal overlord) or knightly families owned land or rights in the village along with Frienisberg Abbey. In 1335 the Knight Ulrich von Sutz sold his land in Hermrigen to the Count of Neuchâtel- Nidau. In 1398, the city of Bern acquired the lands of the Counts, including Hermeigen. Under Bernese rule it was combined with the village of Merzligen-Niklaus to form the court of Hermrigen. That organization remained until the reorganization following the 1798 French invasion. [3]
The village is part of the parish of Täuffelen. [3]
The Jura water correction projects of 1868 to 1891 helped drain many of the marshes outside the village. Drainage projects in 1925-33 and 1977-89 helped open up additional farmland. A primary school was built in 1971 and is shared with the municipality of Merzligen. Today about two-thirds of the working population commutes to jobs in nearby towns and cities. [3]
Geography
Hermrigen has an area of 3.42 km2 (1.32 sq mi). [4] As of 2012, a total of 1.73 km2 (0.67 sq mi) or 50.6% is used for agricultural purposes, while 1.45 km2 (0.56 sq mi) or 42.4% is forested. Of the rest of the land, 0.26 km2 (0.10 sq mi) or 7.6% is settled (buildings or roads) and 0.01 km2 (2.5 acres) or 0.3% is unproductive land. [5]
During the same year, housing and buildings made up 4.7% and transportation infrastructure made up 2.3%. Out of the forested land, all of the forested land area is covered with heavy forests. Of the agricultural land, 39.5% is used for growing crops and 9.1% is pastures, while 2.0% is used for orchards or vine crops. [5]
The village of Hermrigen is located on the main road between Bern, Aarberg and Biel. It is on the southern edge of the Oberholz woods, between Lake Biel and the Bernese Seeland.
On 31 December 2009 Amtsbezirk Nidau, the municipality's former district, was dissolved. On the following day, 1 January 2010, it joined the newly created Verwaltungskreis Seeland. [6]
Coat of arms
The blazon of the municipal coat of arms is Gules a Sword in pale Argent hilted and pommed Or between two Oak Leaves of the last. [7]
Demographics
Hermrigen has a population (as of December 2020 [update]) of 307. [8] As of 2010 [update], 3.3% of the population are resident foreign nationals. Over the last 10 years (2001-2011) the population has changed at a rate of 4.1%. Migration accounted for 2.8%, while births and deaths accounted for 0.4%. [9]
Most of the population (as of 2000 [update]) speaks German (253 or 97.3%) as their first language, French is the second most common (3 or 1.2%) and Italian is the third (1 or 0.4%). [10]
As of 2008 [update], the population was 50.4% male and 49.6% female. The population was made up of 119 Swiss men (48.4% of the population) and 5 (2.0%) non-Swiss men. There were 119 Swiss women (48.4%) and 3 (1.2%) non-Swiss women. [11] Of the population in the municipality, 91 or about 35.0% were born in Hermrigen and lived there in 2000. There were 104 or 40.0% who were born in the same canton, while 37 or 14.2% were born somewhere else in Switzerland, and 10 or 3.8% were born outside of Switzerland. [10]
As of 2011 [update], children and teenagers (0–19 years old) make up 15.2% of the population, while adults (20–64 years old) make up 61.3% and seniors (over 64 years old) make up 23.4%. [9]
As of 2000 [update], there were 97 people who were single and never married in the municipality. There were 141 married individuals, 10 widows or widowers and 12 individuals who are divorced. [10]
As of 2010 [update], there were 31 households that consist of only one person and 6 households with five or more people. [12] In 2000 [update], a total of 108 apartments (93.1% of the total) were permanently occupied, while 2 apartments (1.7%) were seasonally occupied and 6 apartments (5.2%) were empty. [13] As of 2010 [update], the construction rate of new housing units was 8.1 new units per 1000 residents. [9] In 2011, single family homes made up 57.1% of the total housing in the municipality. [14]
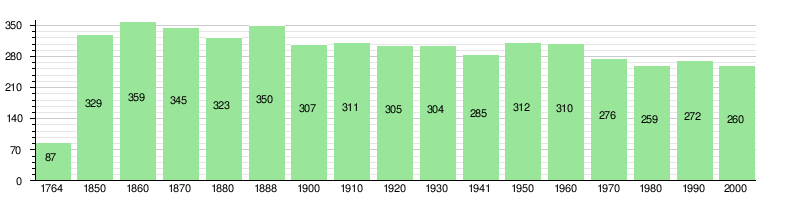
The historical population is given in the following chart: [3] [15]
Politics
In the 2011 federal election the most popular party was the Swiss People's Party (SVP) which received 57.6% of the vote. The next three most popular parties were the Conservative Democratic Party (BDP) (18.7%), the Social Democratic Party (SP) (10.2%) and the FDP.The Liberals (4.9%). In the federal election, a total of 105 votes were cast, and the voter turnout was 50.7%. [16]
Economy
As of 2011 [update], Hermrigen had an unemployment rate of 0.68%. As of 2008 [update], there were a total of 72 people employed in the municipality. Of these, there were 32 people employed in the primary economic sector and about 14 businesses involved in this sector. 11 people were employed in the secondary sector and there were 4 businesses in this sector. 29 people were employed in the tertiary sector, with 9 businesses in this sector. [9] There were 144 residents of the municipality who were employed in some capacity, of which females made up 42.4% of the workforce.
In 2008 [update] there were a total of 54 full-time equivalent jobs. The number of jobs in the primary sector was 22, all of which were in agriculture. The number of jobs in the secondary sector was 10 of which 2 were in manufacturing and 8 were in construction. The number of jobs in the tertiary sector was 22. In the tertiary sector; 2 or 9.1% were in wholesale or retail sales or the repair of motor vehicles, 3 or 13.6% were in a hotel or restaurant, 6 or 27.3% were in education. [17]
In 2000 [update], there were 28 workers who commuted into the municipality and 102 workers who commuted away. The municipality is a net exporter of workers, with about 3.6 workers leaving the municipality for every one entering. A total of 42 workers (60.0% of the 70 total workers in the municipality) both lived and worked in Hermrigen. [18] Of the working population, 13.2% used public transportation to get to work, and 56.3% used a private car. [9]
In 2011 the average local and cantonal tax rate on a married resident, with two children, of Hermrigen making 150,000 CHF was 12.8%, while an unmarried resident's rate was 18.9%. [19] For comparison, the rate for the entire canton in the same year, was 14.2% and 22.0%, while the nationwide rate was 12.3% and 21.1% respectively. [20] In 2009 there were a total of 122 tax payers in the municipality. Of that total, 32 made over 75,000 CHF per year. There was one person who made between 15,000 and 20,000 per year. The greatest number of workers, 40, made between 50,000 and 75,000 CHF per year. The average income of the over 75,000 CHF group in Hermrigen was 113,153 CHF, while the average across all of Switzerland was 130,478 CHF. [21]
In 2011 a total of 1.6% of the population received direct financial assistance from the government. [22]
Religion
From the 2000 census [update], 208 or 80.0% belonged to the Swiss Reformed Church, while 17 or 6.5% were Roman Catholic. Of the rest of the population, there were 2 members of an Orthodox church (or about 0.77% of the population). There was 1 individual who was Jewish, and 20 (or about 7.69% of the population) belonged to no church, are agnostic or atheist, and 12 individuals (or about 4.62% of the population) did not answer the question. [10]
Education
In Hermrigen about 61.5% of the population have completed non-mandatory upper secondary education, and 12.2% have completed additional higher education (either university or a Fachhochschule). [9] Of the 22 who had completed some form of tertiary schooling listed in the census, 68.2% were Swiss men, 31.8% were Swiss women. [10]
The Canton of Bern school system provides one year of non-obligatory Kindergarten, followed by six years of Primary school. This is followed by three years of obligatory lower Secondary school where the students are separated according to ability and aptitude. Following the lower Secondary students may attend additional schooling or they may enter an apprenticeship. [23]
During the 2011-12 school year, there were a total of 51 students attending classes in Hermrigen. There was one kindergarten class with a total of 12 students in the municipality. Of the kindergarten students, 16.7% have a different mother language than the classroom language. The municipality had one primary class and 33 students. Of the primary students, 3.0% were permanent or temporary residents of Switzerland (not citizens) and 6.1% have a different mother language than the classroom language. During the same year, there was one lower secondary class with a total of 6 students. There were 16.7% who were permanent or temporary residents of Switzerland (not citizens) and 16.7% have a different mother language than the classroom language. [24]
As of 2000 [update], there were a total of 72 students attending any school in the municipality. Of those, 18 both lived and attended school in the municipality, while 54 students came from another municipality. During the same year, 12 residents attended schools outside the municipality. [18]
References
- ^ a b "Arealstatistik Standard - Gemeinden nach 4 Hauptbereichen". Federal Statistical Office. Retrieved 13 January 2019.
- ^ "Ständige Wohnbevölkerung nach Staatsangehörigkeitskategorie Geschlecht und Gemeinde; Provisorische Jahresergebnisse; 2018". Federal Statistical Office. 9 April 2019. Retrieved 11 April 2019.
- ^ a b c d e Hermrigen in German, French and Italian in the online Historical Dictionary of Switzerland.
- ^ Arealstatistik Standard - Gemeindedaten nach 4 Hauptbereichen
- ^ a b Swiss Federal Statistical Office-Land Use Statistics 2009 data (in German) accessed 25 March 2010
- ^ Nomenklaturen – Amtliches Gemeindeverzeichnis der Schweiz (in German) accessed 4 April 2011
- ^ Flags of the World.com accessed 8 August 2013
- ^ "Ständige und nichtständige Wohnbevölkerung nach institutionellen Gliederungen, Geburtsort und Staatsangehörigkeit". bfs.admin.ch (in German). Swiss Federal Statistical Office - STAT-TAB. 31 December 2020. Retrieved 21 September 2021.
- ^ a b c d e f Swiss Federal Statistical Office Archived 2016-01-05 at the Wayback Machine accessed 8 August 2013
- ^ a b c d e STAT-TAB Datenwürfel für Thema 40.3 - 2000 Archived 2014-04-09 at the Wayback Machine (in German) accessed 2 February 2011
- ^ Statistical office of the Canton of Bern Archived 2012-02-15 at the Wayback Machine (in German) accessed 4 January 2012
- ^ Swiss Federal Statistical Office - Haushaltsgrösse Archived 2014-10-06 at the Wayback Machine (in German) accessed 8 May 2013
- ^ Swiss Federal Statistical Office STAT-TAB - Datenwürfel für Thema 09.2 - Gebäude und Wohnungen Archived 2014-09-07 at the Wayback Machine (in German) accessed 28 January 2011
- ^ Statistischer Atlas der Schweiz - Anteil Einfamilienhäuser am gesamten Gebäudebestand, 2011 accessed 17 June 2013
- ^ Swiss Federal Statistical Office STAT-TAB Bevölkerungsentwicklung nach Region, 1850-2000 Archived 2014-09-30 at the Wayback Machine (in German) accessed 29 January 2011
- ^ Swiss Federal Statistical Office 2011 Election Archived 2013-11-14 at the Wayback Machine (in German) accessed 8 May 2012
- ^ Swiss Federal Statistical Office STAT-TAB Betriebszählung: Arbeitsstätten nach Gemeinde und NOGA 2008 (Abschnitte), Sektoren 1-3 Archived 2014-12-25 at the Wayback Machine (in German) accessed 28 January 2011
- ^ a b Swiss Federal Statistical Office - Statweb (in German) accessed 24 June 2010
- ^ Statistischer Atlas der Schweiz - Steuerbelastung, 2011 Politische Gemeinden (in German) accessed 15 May 2013
- ^ Swiss Federal Tax Administration - Grafische Darstellung der Steuerbelastung 2011 in den Kantonen (in German and French) accessed 17 June 2013
- ^ Federal Tax Administration Report Direkte Bundessteuer - Natürliche Personen - Gemeinden - Steuerjahr 2009 Archived 2014-10-06 at the Wayback Machine (in German and French) accessed 15 May 2013
- ^ Statistischer Atlas der Schweiz - Bezüger/-innen von Sozialhilfeleistungen (Sozialhilfeempfänger/-innen), 2011 accessed 18 June 2013
- ^ EDK/CDIP/IDES (2010). Kantonale Schulstrukturen in der Schweiz und im Fürstentum Liechtenstein / Structures Scolaires Cantonales en Suisse et Dans la Principauté du Liechtenstein (PDF) (Report). Retrieved 24 June 2010.
- ^ Schuljahr 2011/12 pdf document(in German) accessed 9 May 2013
External links
- Official website: http://www.hermrigen.ch
- Hermrigen in German, French and Italian in the online Historical Dictionary of Switzerland.
| International | |
|---|---|
| National | |
| Other | |
Hermrigen | |
|---|---|
|
Coat of arms | |
Hermrigen Hermrigen | |
| Coordinates: 47°5′N 7°15′E / 47.083°N 7.250°E | |
| Country | Switzerland |
| Canton | Bern |
| District | Seeland |
| Area | |
| • Total | 3.5 km2 (1.4 sq mi) |
| Elevation | 513 m (1,683 ft) |
| Population (31 December 2018)
[2] | |
| • Total | 321 |
| • Density | 92/km2 (240/sq mi) |
| Time zone | UTC+01:00 ( Central European Time) |
| • Summer ( DST) | UTC+02:00 ( Central European Summer Time) |
| Postal code(s) | 3274 |
| SFOS number | 0737 |
| ISO 3166 code | CH-BE |
| Surrounded by | Bellmund, Bühl, Epsach, Kappelen, Merzligen, Mörigen, Sutz-Lattrigen |
| Website |
http://www.hermrigen.ch SFSO statistics |
Hermrigen is a municipality in the Seeland administrative district in the canton of Bern in Switzerland.
History
Hermrigen is first mentioned in 1249 as Hermeringen. [3]
The oldest trace of a settlement in the area are scattered Stone Age (probably Mesolithic) items which were found at Schönbrünnefeld. A Hallstatt era grave mound has been found in the Hermrigenmoos-Holehölzli. A few Roman era artifacts were also found around the municipality. During the Middle Ages a number of Ministerialis (unfree knights in the service of a feudal overlord) or knightly families owned land or rights in the village along with Frienisberg Abbey. In 1335 the Knight Ulrich von Sutz sold his land in Hermrigen to the Count of Neuchâtel- Nidau. In 1398, the city of Bern acquired the lands of the Counts, including Hermeigen. Under Bernese rule it was combined with the village of Merzligen-Niklaus to form the court of Hermrigen. That organization remained until the reorganization following the 1798 French invasion. [3]
The village is part of the parish of Täuffelen. [3]
The Jura water correction projects of 1868 to 1891 helped drain many of the marshes outside the village. Drainage projects in 1925-33 and 1977-89 helped open up additional farmland. A primary school was built in 1971 and is shared with the municipality of Merzligen. Today about two-thirds of the working population commutes to jobs in nearby towns and cities. [3]
Geography
Hermrigen has an area of 3.42 km2 (1.32 sq mi). [4] As of 2012, a total of 1.73 km2 (0.67 sq mi) or 50.6% is used for agricultural purposes, while 1.45 km2 (0.56 sq mi) or 42.4% is forested. Of the rest of the land, 0.26 km2 (0.10 sq mi) or 7.6% is settled (buildings or roads) and 0.01 km2 (2.5 acres) or 0.3% is unproductive land. [5]
During the same year, housing and buildings made up 4.7% and transportation infrastructure made up 2.3%. Out of the forested land, all of the forested land area is covered with heavy forests. Of the agricultural land, 39.5% is used for growing crops and 9.1% is pastures, while 2.0% is used for orchards or vine crops. [5]
The village of Hermrigen is located on the main road between Bern, Aarberg and Biel. It is on the southern edge of the Oberholz woods, between Lake Biel and the Bernese Seeland.
On 31 December 2009 Amtsbezirk Nidau, the municipality's former district, was dissolved. On the following day, 1 January 2010, it joined the newly created Verwaltungskreis Seeland. [6]
Coat of arms
The blazon of the municipal coat of arms is Gules a Sword in pale Argent hilted and pommed Or between two Oak Leaves of the last. [7]
Demographics
Hermrigen has a population (as of December 2020 [update]) of 307. [8] As of 2010 [update], 3.3% of the population are resident foreign nationals. Over the last 10 years (2001-2011) the population has changed at a rate of 4.1%. Migration accounted for 2.8%, while births and deaths accounted for 0.4%. [9]
Most of the population (as of 2000 [update]) speaks German (253 or 97.3%) as their first language, French is the second most common (3 or 1.2%) and Italian is the third (1 or 0.4%). [10]
As of 2008 [update], the population was 50.4% male and 49.6% female. The population was made up of 119 Swiss men (48.4% of the population) and 5 (2.0%) non-Swiss men. There were 119 Swiss women (48.4%) and 3 (1.2%) non-Swiss women. [11] Of the population in the municipality, 91 or about 35.0% were born in Hermrigen and lived there in 2000. There were 104 or 40.0% who were born in the same canton, while 37 or 14.2% were born somewhere else in Switzerland, and 10 or 3.8% were born outside of Switzerland. [10]
As of 2011 [update], children and teenagers (0–19 years old) make up 15.2% of the population, while adults (20–64 years old) make up 61.3% and seniors (over 64 years old) make up 23.4%. [9]
As of 2000 [update], there were 97 people who were single and never married in the municipality. There were 141 married individuals, 10 widows or widowers and 12 individuals who are divorced. [10]
As of 2010 [update], there were 31 households that consist of only one person and 6 households with five or more people. [12] In 2000 [update], a total of 108 apartments (93.1% of the total) were permanently occupied, while 2 apartments (1.7%) were seasonally occupied and 6 apartments (5.2%) were empty. [13] As of 2010 [update], the construction rate of new housing units was 8.1 new units per 1000 residents. [9] In 2011, single family homes made up 57.1% of the total housing in the municipality. [14]
The historical population is given in the following chart: [3] [15]
Politics
In the 2011 federal election the most popular party was the Swiss People's Party (SVP) which received 57.6% of the vote. The next three most popular parties were the Conservative Democratic Party (BDP) (18.7%), the Social Democratic Party (SP) (10.2%) and the FDP.The Liberals (4.9%). In the federal election, a total of 105 votes were cast, and the voter turnout was 50.7%. [16]
Economy
As of 2011 [update], Hermrigen had an unemployment rate of 0.68%. As of 2008 [update], there were a total of 72 people employed in the municipality. Of these, there were 32 people employed in the primary economic sector and about 14 businesses involved in this sector. 11 people were employed in the secondary sector and there were 4 businesses in this sector. 29 people were employed in the tertiary sector, with 9 businesses in this sector. [9] There were 144 residents of the municipality who were employed in some capacity, of which females made up 42.4% of the workforce.
In 2008 [update] there were a total of 54 full-time equivalent jobs. The number of jobs in the primary sector was 22, all of which were in agriculture. The number of jobs in the secondary sector was 10 of which 2 were in manufacturing and 8 were in construction. The number of jobs in the tertiary sector was 22. In the tertiary sector; 2 or 9.1% were in wholesale or retail sales or the repair of motor vehicles, 3 or 13.6% were in a hotel or restaurant, 6 or 27.3% were in education. [17]
In 2000 [update], there were 28 workers who commuted into the municipality and 102 workers who commuted away. The municipality is a net exporter of workers, with about 3.6 workers leaving the municipality for every one entering. A total of 42 workers (60.0% of the 70 total workers in the municipality) both lived and worked in Hermrigen. [18] Of the working population, 13.2% used public transportation to get to work, and 56.3% used a private car. [9]
In 2011 the average local and cantonal tax rate on a married resident, with two children, of Hermrigen making 150,000 CHF was 12.8%, while an unmarried resident's rate was 18.9%. [19] For comparison, the rate for the entire canton in the same year, was 14.2% and 22.0%, while the nationwide rate was 12.3% and 21.1% respectively. [20] In 2009 there were a total of 122 tax payers in the municipality. Of that total, 32 made over 75,000 CHF per year. There was one person who made between 15,000 and 20,000 per year. The greatest number of workers, 40, made between 50,000 and 75,000 CHF per year. The average income of the over 75,000 CHF group in Hermrigen was 113,153 CHF, while the average across all of Switzerland was 130,478 CHF. [21]
In 2011 a total of 1.6% of the population received direct financial assistance from the government. [22]
Religion
From the 2000 census [update], 208 or 80.0% belonged to the Swiss Reformed Church, while 17 or 6.5% were Roman Catholic. Of the rest of the population, there were 2 members of an Orthodox church (or about 0.77% of the population). There was 1 individual who was Jewish, and 20 (or about 7.69% of the population) belonged to no church, are agnostic or atheist, and 12 individuals (or about 4.62% of the population) did not answer the question. [10]
Education
In Hermrigen about 61.5% of the population have completed non-mandatory upper secondary education, and 12.2% have completed additional higher education (either university or a Fachhochschule). [9] Of the 22 who had completed some form of tertiary schooling listed in the census, 68.2% were Swiss men, 31.8% were Swiss women. [10]
The Canton of Bern school system provides one year of non-obligatory Kindergarten, followed by six years of Primary school. This is followed by three years of obligatory lower Secondary school where the students are separated according to ability and aptitude. Following the lower Secondary students may attend additional schooling or they may enter an apprenticeship. [23]
During the 2011-12 school year, there were a total of 51 students attending classes in Hermrigen. There was one kindergarten class with a total of 12 students in the municipality. Of the kindergarten students, 16.7% have a different mother language than the classroom language. The municipality had one primary class and 33 students. Of the primary students, 3.0% were permanent or temporary residents of Switzerland (not citizens) and 6.1% have a different mother language than the classroom language. During the same year, there was one lower secondary class with a total of 6 students. There were 16.7% who were permanent or temporary residents of Switzerland (not citizens) and 16.7% have a different mother language than the classroom language. [24]
As of 2000 [update], there were a total of 72 students attending any school in the municipality. Of those, 18 both lived and attended school in the municipality, while 54 students came from another municipality. During the same year, 12 residents attended schools outside the municipality. [18]
References
- ^ a b "Arealstatistik Standard - Gemeinden nach 4 Hauptbereichen". Federal Statistical Office. Retrieved 13 January 2019.
- ^ "Ständige Wohnbevölkerung nach Staatsangehörigkeitskategorie Geschlecht und Gemeinde; Provisorische Jahresergebnisse; 2018". Federal Statistical Office. 9 April 2019. Retrieved 11 April 2019.
- ^ a b c d e Hermrigen in German, French and Italian in the online Historical Dictionary of Switzerland.
- ^ Arealstatistik Standard - Gemeindedaten nach 4 Hauptbereichen
- ^ a b Swiss Federal Statistical Office-Land Use Statistics 2009 data (in German) accessed 25 March 2010
- ^ Nomenklaturen – Amtliches Gemeindeverzeichnis der Schweiz (in German) accessed 4 April 2011
- ^ Flags of the World.com accessed 8 August 2013
- ^ "Ständige und nichtständige Wohnbevölkerung nach institutionellen Gliederungen, Geburtsort und Staatsangehörigkeit". bfs.admin.ch (in German). Swiss Federal Statistical Office - STAT-TAB. 31 December 2020. Retrieved 21 September 2021.
- ^ a b c d e f Swiss Federal Statistical Office Archived 2016-01-05 at the Wayback Machine accessed 8 August 2013
- ^ a b c d e STAT-TAB Datenwürfel für Thema 40.3 - 2000 Archived 2014-04-09 at the Wayback Machine (in German) accessed 2 February 2011
- ^ Statistical office of the Canton of Bern Archived 2012-02-15 at the Wayback Machine (in German) accessed 4 January 2012
- ^ Swiss Federal Statistical Office - Haushaltsgrösse Archived 2014-10-06 at the Wayback Machine (in German) accessed 8 May 2013
- ^ Swiss Federal Statistical Office STAT-TAB - Datenwürfel für Thema 09.2 - Gebäude und Wohnungen Archived 2014-09-07 at the Wayback Machine (in German) accessed 28 January 2011
- ^ Statistischer Atlas der Schweiz - Anteil Einfamilienhäuser am gesamten Gebäudebestand, 2011 accessed 17 June 2013
- ^ Swiss Federal Statistical Office STAT-TAB Bevölkerungsentwicklung nach Region, 1850-2000 Archived 2014-09-30 at the Wayback Machine (in German) accessed 29 January 2011
- ^ Swiss Federal Statistical Office 2011 Election Archived 2013-11-14 at the Wayback Machine (in German) accessed 8 May 2012
- ^ Swiss Federal Statistical Office STAT-TAB Betriebszählung: Arbeitsstätten nach Gemeinde und NOGA 2008 (Abschnitte), Sektoren 1-3 Archived 2014-12-25 at the Wayback Machine (in German) accessed 28 January 2011
- ^ a b Swiss Federal Statistical Office - Statweb (in German) accessed 24 June 2010
- ^ Statistischer Atlas der Schweiz - Steuerbelastung, 2011 Politische Gemeinden (in German) accessed 15 May 2013
- ^ Swiss Federal Tax Administration - Grafische Darstellung der Steuerbelastung 2011 in den Kantonen (in German and French) accessed 17 June 2013
- ^ Federal Tax Administration Report Direkte Bundessteuer - Natürliche Personen - Gemeinden - Steuerjahr 2009 Archived 2014-10-06 at the Wayback Machine (in German and French) accessed 15 May 2013
- ^ Statistischer Atlas der Schweiz - Bezüger/-innen von Sozialhilfeleistungen (Sozialhilfeempfänger/-innen), 2011 accessed 18 June 2013
- ^ EDK/CDIP/IDES (2010). Kantonale Schulstrukturen in der Schweiz und im Fürstentum Liechtenstein / Structures Scolaires Cantonales en Suisse et Dans la Principauté du Liechtenstein (PDF) (Report). Retrieved 24 June 2010.
- ^ Schuljahr 2011/12 pdf document(in German) accessed 9 May 2013
External links
- Official website: http://www.hermrigen.ch
- Hermrigen in German, French and Italian in the online Historical Dictionary of Switzerland.
| International | |
|---|---|
| National | |
| Other | |