
Original file (4,000 × 3,000 pixels, file size: 1.87 MB, MIME type: image/jpeg)
| This is a file from the
Wikimedia Commons. Information from its
description page there is shown below. Commons is a freely licensed media file repository. You can help. |
Summary
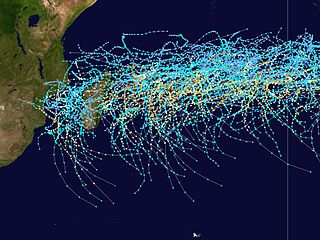
| Saffir-Simpson Hurricane Scale | ||||||
| TD | TS | 1 | 2 | 3 | 4 | 5 |
This map shows the tracks of all Tropical cyclones in the Southwest Indian Ocean from 1980 to 2005. 90° E longitude is marked on the map, this is the eastern boundary of the basin. The points show the locations of the storms at six-hourly intervals and use the color scheme shown above from Saffir-Simpson Hurricane Scale.
Licensing
Created using User:jdorje/Tracks by Nilfanion on 2007-02-19. Background image from Image:Whole world - land and oceans.jpg ( NASA). The best track information is from the Joint Typhoon Warning Center. [1]
| I, the copyright holder of this work, release this work into the
public domain. This applies worldwide. In some countries this may not be legally possible; if so: I grant anyone the right to use this work for any purpose, without any conditions, unless such conditions are required by law. |
File history
Click on a date/time to view the file as it appeared at that time.
| Date/Time | Thumbnail | Dimensions | User | Comment | |
|---|---|---|---|---|---|
| current | 21:24, 27 February 2007 |
| 4,000 × 3,000 (1.87 MB) | Nilfanion | {|Description={|align="{{{align|right}}}" border="0" cellspacing="0" cellpadding="0" style="background:transparent;text-align:center" |- |colspan="7" nowrap="nowrap"| <small> Saffir-Simpson Hurricane Scale</small> |- |s |
File usage
Global file usage
The following other wikis use this file:
- Usage on de.wikipedia.org
- Usage on fr.wikipedia.org
- Usage on id.wikipedia.org
- Usage on ms.wikipedia.org
- Usage on pt.wikipedia.org
- Usage on ru.wikipedia.org
- Usage on th.wikipedia.org
- Usage on uk.wikipedia.org
- Usage on zh.wikipedia.org
Metadata
Original file (4,000 × 3,000 pixels, file size: 1.87 MB, MIME type: image/jpeg)
| This is a file from the
Wikimedia Commons. Information from its
description page there is shown below. Commons is a freely licensed media file repository. You can help. |
Summary
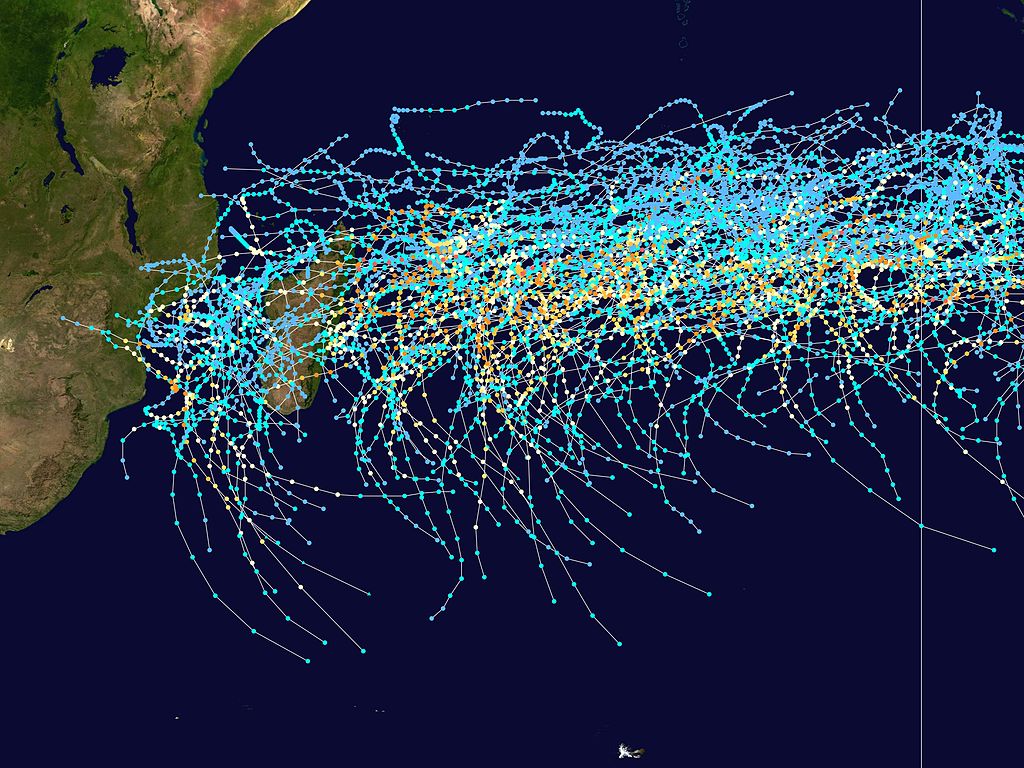
| Saffir-Simpson Hurricane Scale | ||||||
| TD | TS | 1 | 2 | 3 | 4 | 5 |
This map shows the tracks of all Tropical cyclones in the Southwest Indian Ocean from 1980 to 2005. 90° E longitude is marked on the map, this is the eastern boundary of the basin. The points show the locations of the storms at six-hourly intervals and use the color scheme shown above from Saffir-Simpson Hurricane Scale.
Licensing
Created using User:jdorje/Tracks by Nilfanion on 2007-02-19. Background image from Image:Whole world - land and oceans.jpg ( NASA). The best track information is from the Joint Typhoon Warning Center. [1]
| I, the copyright holder of this work, release this work into the
public domain. This applies worldwide. In some countries this may not be legally possible; if so: I grant anyone the right to use this work for any purpose, without any conditions, unless such conditions are required by law. |
File history
Click on a date/time to view the file as it appeared at that time.
| Date/Time | Thumbnail | Dimensions | User | Comment | |
|---|---|---|---|---|---|
| current | 21:24, 27 February 2007 |
| 4,000 × 3,000 (1.87 MB) | Nilfanion | {|Description={|align="{{{align|right}}}" border="0" cellspacing="0" cellpadding="0" style="background:transparent;text-align:center" |- |colspan="7" nowrap="nowrap"| <small> Saffir-Simpson Hurricane Scale</small> |- |s |
File usage
Global file usage
The following other wikis use this file:
- Usage on de.wikipedia.org
- Usage on fr.wikipedia.org
- Usage on id.wikipedia.org
- Usage on ms.wikipedia.org
- Usage on pt.wikipedia.org
- Usage on ru.wikipedia.org
- Usage on th.wikipedia.org
- Usage on uk.wikipedia.org
- Usage on zh.wikipedia.org