Original file (1,641 × 2,673 pixels, file size: 209 KB, MIME type: image/png)
| This is a file from the
Wikimedia Commons. Information from its
description page there is shown below. Commons is a freely licensed media file repository. You can help. |
Summary
| Description |
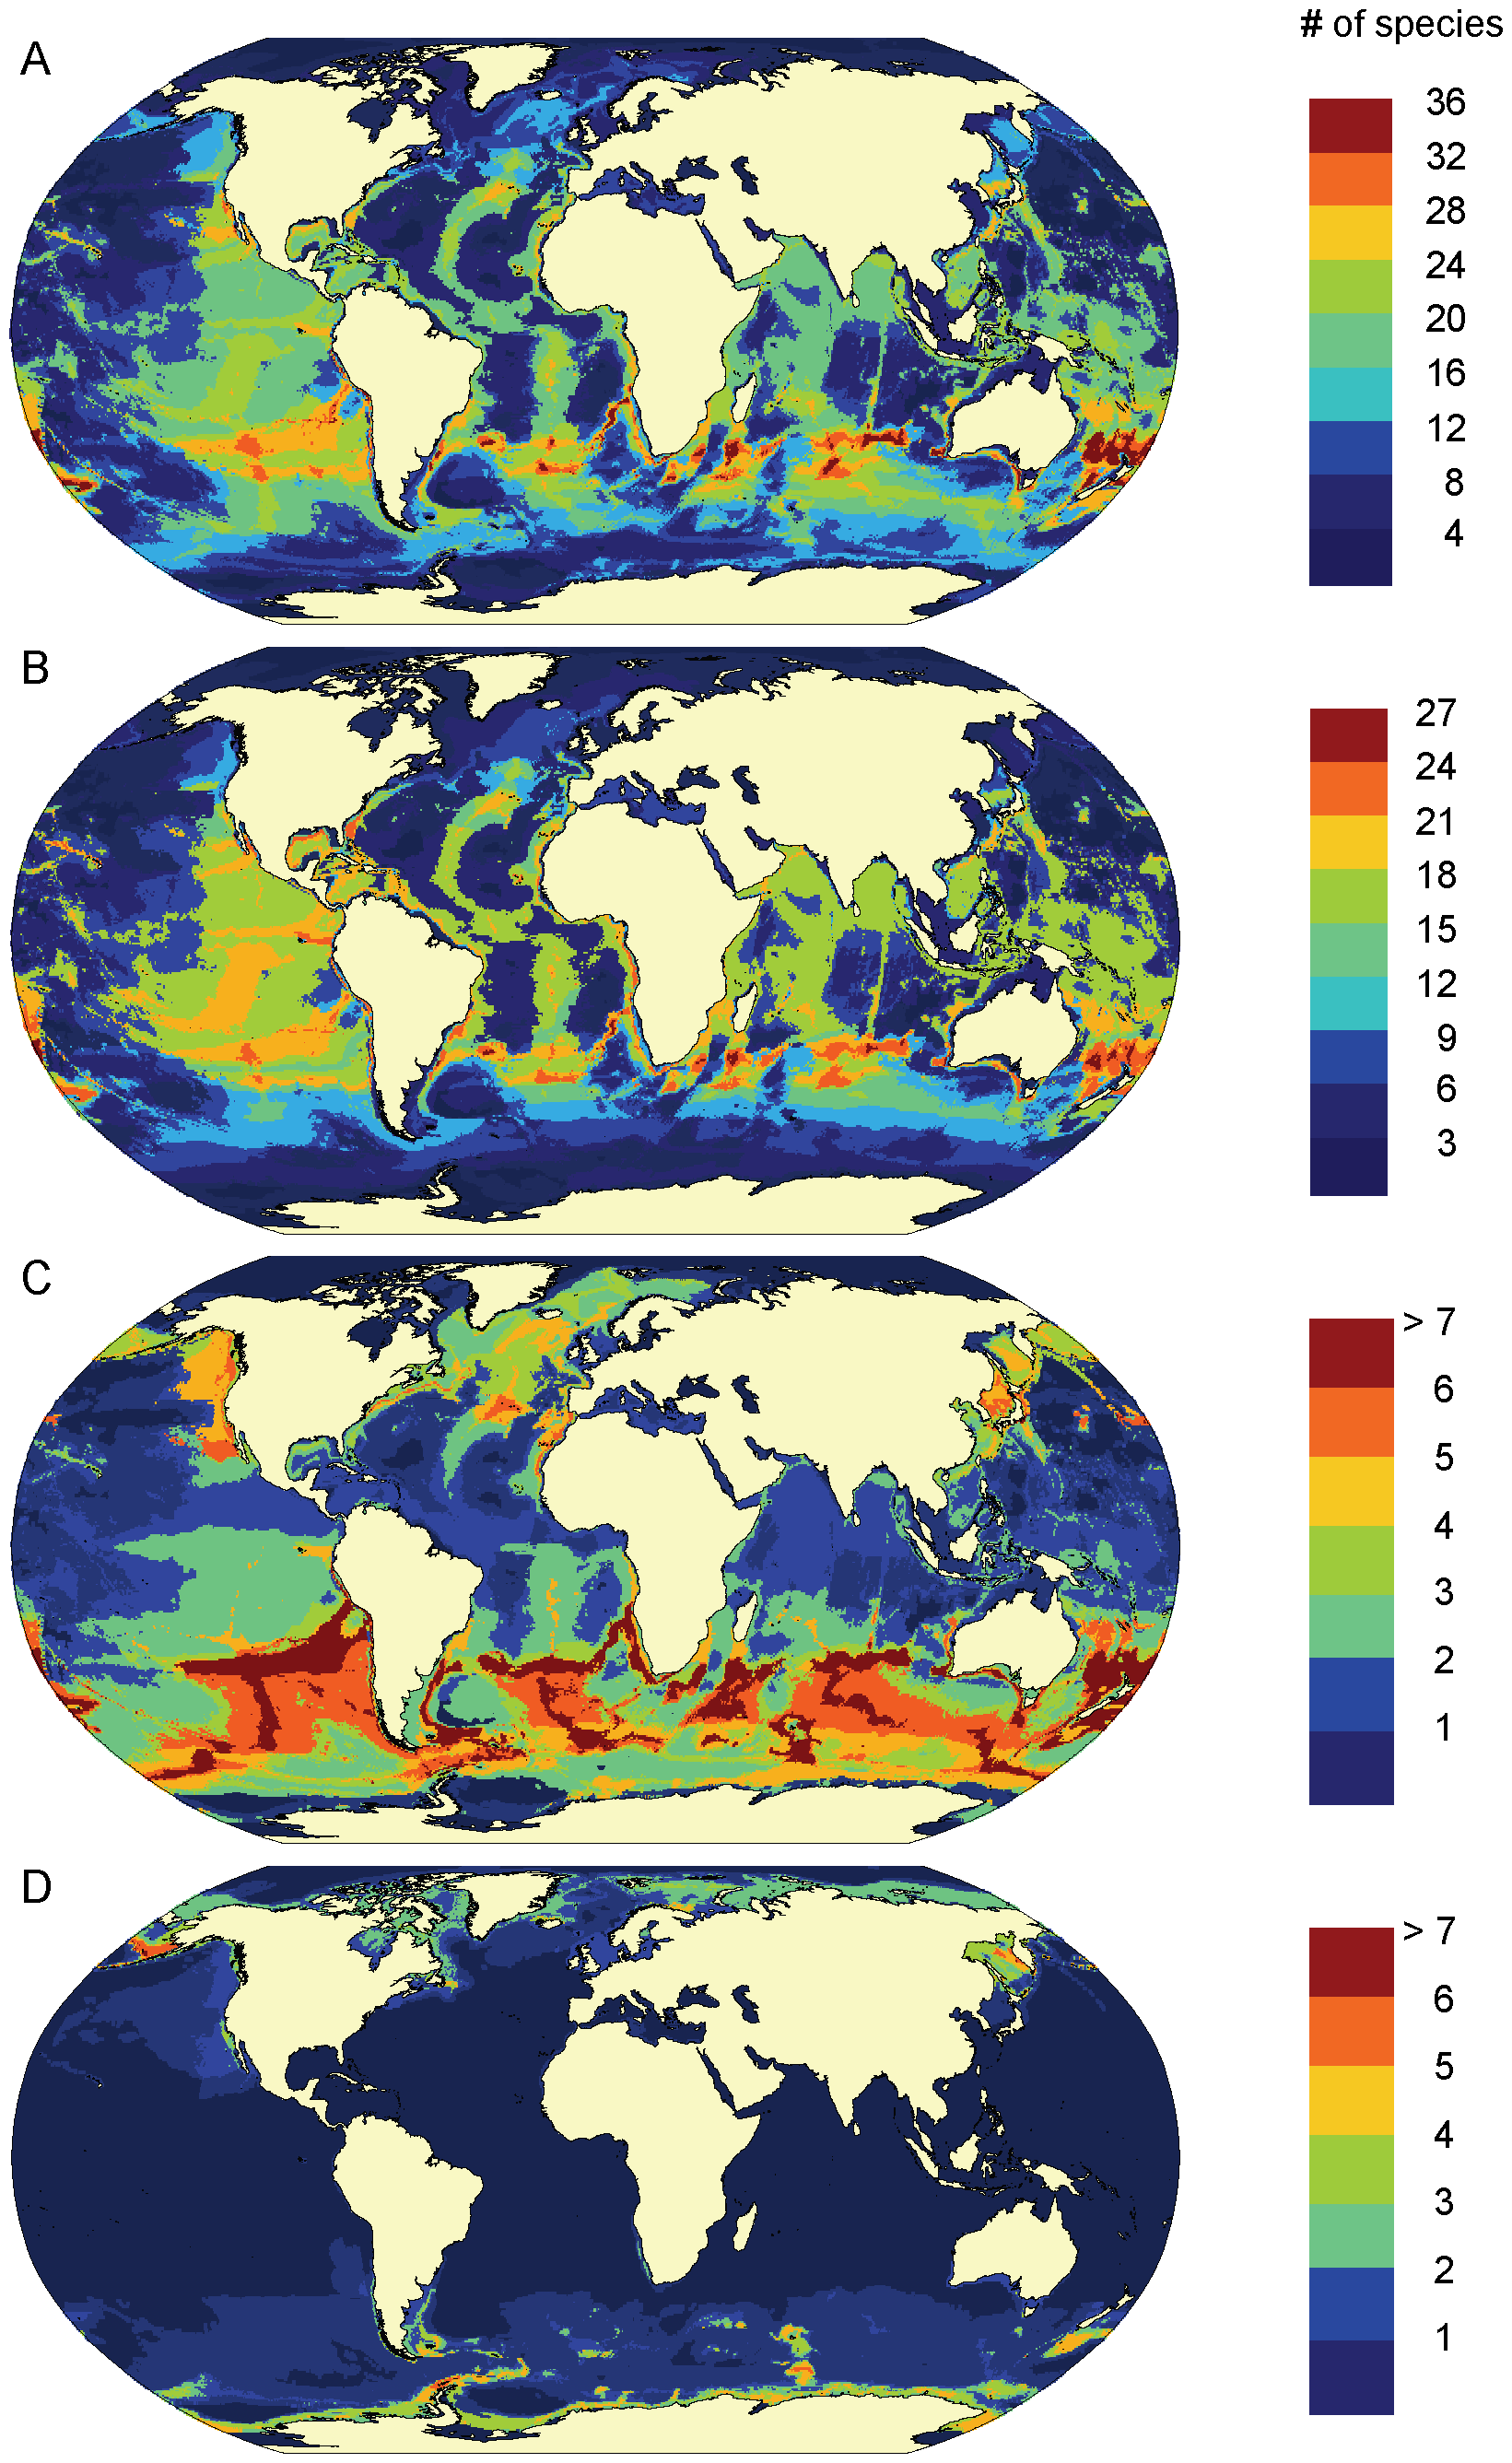
English: Predicted patterns of marine mammal species richness.
A. All species (n = 115), B. Odontocetes (n = 69), C. Mysticetes (n = 14), D. Pinnipeds (n = 32). Colors indicate the number of species predicted to occur in each 0.5°x0.5° grid cell from a relative environmental suitability (RES) model, using environmental data from 1990–1999, and assuming a presence threshold of RES>0.6. See: Kaschner, K., Tittensor, D.P., Ready, J., Gerrodette, T. and Worm, B. (2011) "Current and future patterns of global marine mammal biodiversity". PLoS One, 6 (5): e19653. doi: 10.1371/journal.pone.0019653 |
| Date | |
| Source | https://dx.doi.org/10.1371/journal.pone.0019653.g001 |
| Author | Selig, E.R., Turner, W.R., Troëng, S., Wallace, B.P., Halpern, B.S., Kaschner, K., Lascelles, B.G., Carpenter, K.E. and Mittermeier, R.A. |
Licensing
- You are free:
- to share – to copy, distribute and transmit the work
- to remix – to adapt the work
- Under the following conditions:
- attribution – You must give appropriate credit, provide a link to the license, and indicate if changes were made. You may do so in any reasonable manner, but not in any way that suggests the licensor endorses you or your use.
- share alike – If you remix, transform, or build upon the material, you must distribute your contributions under the same or compatible license as the original.
File history
Click on a date/time to view the file as it appeared at that time.
| Date/Time | Thumbnail | Dimensions | User | Comment | |
|---|---|---|---|---|---|
| current | 05:41, 27 November 2016 |
| 1,641 × 2,673 (209 KB) | Epipelagic | User created page with UploadWizard |
File usage
Global file usage
The following other wikis use this file:
- Usage on eo.wikipedia.org
- Usage on eu.wikipedia.org
- Usage on gl.wikipedia.org
- Usage on la.wikipedia.org
- Usage on lv.wikipedia.org
- Usage on ru.wikipedia.org
- Usage on sq.wikipedia.org
- Usage on vi.wikipedia.org
- Usage on zh.wikipedia.org
Original file (1,641 × 2,673 pixels, file size: 209 KB, MIME type: image/png)
| This is a file from the
Wikimedia Commons. Information from its
description page there is shown below. Commons is a freely licensed media file repository. You can help. |
Summary
| Description |
English: Predicted patterns of marine mammal species richness.
A. All species (n = 115), B. Odontocetes (n = 69), C. Mysticetes (n = 14), D. Pinnipeds (n = 32). Colors indicate the number of species predicted to occur in each 0.5°x0.5° grid cell from a relative environmental suitability (RES) model, using environmental data from 1990–1999, and assuming a presence threshold of RES>0.6. See: Kaschner, K., Tittensor, D.P., Ready, J., Gerrodette, T. and Worm, B. (2011) "Current and future patterns of global marine mammal biodiversity". PLoS One, 6 (5): e19653. doi: 10.1371/journal.pone.0019653 |
| Date | |
| Source | https://dx.doi.org/10.1371/journal.pone.0019653.g001 |
| Author | Selig, E.R., Turner, W.R., Troëng, S., Wallace, B.P., Halpern, B.S., Kaschner, K., Lascelles, B.G., Carpenter, K.E. and Mittermeier, R.A. |
Licensing
- You are free:
- to share – to copy, distribute and transmit the work
- to remix – to adapt the work
- Under the following conditions:
- attribution – You must give appropriate credit, provide a link to the license, and indicate if changes were made. You may do so in any reasonable manner, but not in any way that suggests the licensor endorses you or your use.
- share alike – If you remix, transform, or build upon the material, you must distribute your contributions under the same or compatible license as the original.
File history
Click on a date/time to view the file as it appeared at that time.
| Date/Time | Thumbnail | Dimensions | User | Comment | |
|---|---|---|---|---|---|
| current | 05:41, 27 November 2016 |
| 1,641 × 2,673 (209 KB) | Epipelagic | User created page with UploadWizard |
File usage
Global file usage
The following other wikis use this file:
- Usage on eo.wikipedia.org
- Usage on eu.wikipedia.org
- Usage on gl.wikipedia.org
- Usage on la.wikipedia.org
- Usage on lv.wikipedia.org
- Usage on ru.wikipedia.org
- Usage on sq.wikipedia.org
- Usage on vi.wikipedia.org
- Usage on zh.wikipedia.org