
Size of this preview:
800 × 303 pixels. Other resolutions:
320 × 121 pixels |
640 × 243 pixels |
1,280 × 485 pixels.
Original file (1,280 × 485 pixels, file size: 208 KB, MIME type: image/png)
| This is a file from the
Wikimedia Commons. Information from its
description page there is shown below. Commons is a freely licensed media file repository. You can help. |
Summary
| Description |
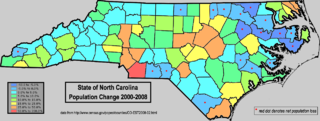
English: Map of North Carolina, using color shading to denote net county-level population change from the 2000 thru 2008 period (2008 population estimates vs. 2000 census values). Data retrieved from
https://www.census.gov\/popest/counties/CO-EST2008-02.html Note the large-scale area of net population loss in the inland northeastern part of the state; these counties are all related to each other in that they contain the highest percentage of blacks, according to the Census 2000 data.
[1] |
| Date | |
| Source | I created this work entirely by myself. FWIW, though I live in Alabama now, I grew up in Vance County N.C. |
| Author | Nuberger13 ( talk) |
Licensing
This image or file is a work of a
United States Census Bureau employee, taken or made as part of that person's official duties. As a
work of the
U.S. federal government, the image is in the
public domain.
|
 |
Original upload log
Transferred from en.wikipedia to Commons by Magnus Manske using CommonsHelper.
The original description page was
here. All following user names refer to en.wikipedia.
- 2009-05-02 11:50 Nuberger13 1280×485× (212867 bytes) {{Information |Description = Map of North Carolina, using color shading to denote net county-level population change from the 2000 thru 2008 period (2008 population estimates vs. 2000 census values). Data retrieved from http://www.census.gov/popest/co
File history
Click on a date/time to view the file as it appeared at that time.
| Date/Time | Thumbnail | Dimensions | User | Comment | |
|---|---|---|---|---|---|
| current | 08:41, 21 February 2011 |
| 1,280 × 485 (208 KB) | File Upload Bot (Magnus Manske) | {{BotMoveToCommons|en.wikipedia|year={{subst:CURRENTYEAR}}|month={{subst:CURRENTMONTHNAME}}|day={{subst:CURRENTDAY}}}} {{Information |Description={{en|Map of North Carolina, using color shading to denote net county-level population change from the 2000 t |
File usage
The following pages on the English Wikipedia use this file (pages on other projects are not listed):
Global file usage
The following other wikis use this file:
- Usage on ro.wikipedia.org
Size of this preview:
800 × 303 pixels. Other resolutions:
320 × 121 pixels |
640 × 243 pixels |
1,280 × 485 pixels.
Original file (1,280 × 485 pixels, file size: 208 KB, MIME type: image/png)
| This is a file from the
Wikimedia Commons. Information from its
description page there is shown below. Commons is a freely licensed media file repository. You can help. |
Summary
| Description |
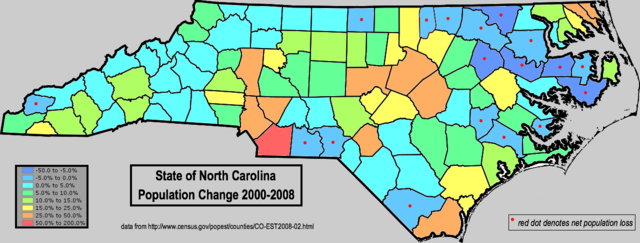
English: Map of North Carolina, using color shading to denote net county-level population change from the 2000 thru 2008 period (2008 population estimates vs. 2000 census values). Data retrieved from
https://www.census.gov\/popest/counties/CO-EST2008-02.html Note the large-scale area of net population loss in the inland northeastern part of the state; these counties are all related to each other in that they contain the highest percentage of blacks, according to the Census 2000 data.
[1] |
| Date | |
| Source | I created this work entirely by myself. FWIW, though I live in Alabama now, I grew up in Vance County N.C. |
| Author | Nuberger13 ( talk) |
Licensing
This image or file is a work of a
United States Census Bureau employee, taken or made as part of that person's official duties. As a
work of the
U.S. federal government, the image is in the
public domain.
|
|
Original upload log
Transferred from en.wikipedia to Commons by Magnus Manske using CommonsHelper.
The original description page was
here. All following user names refer to en.wikipedia.
- 2009-05-02 11:50 Nuberger13 1280×485× (212867 bytes) {{Information |Description = Map of North Carolina, using color shading to denote net county-level population change from the 2000 thru 2008 period (2008 population estimates vs. 2000 census values). Data retrieved from http://www.census.gov/popest/co
File history
Click on a date/time to view the file as it appeared at that time.
| Date/Time | Thumbnail | Dimensions | User | Comment | |
|---|---|---|---|---|---|
| current | 08:41, 21 February 2011 |
| 1,280 × 485 (208 KB) | File Upload Bot (Magnus Manske) | {{BotMoveToCommons|en.wikipedia|year={{subst:CURRENTYEAR}}|month={{subst:CURRENTMONTHNAME}}|day={{subst:CURRENTDAY}}}} {{Information |Description={{en|Map of North Carolina, using color shading to denote net county-level population change from the 2000 t |
File usage
The following pages on the English Wikipedia use this file (pages on other projects are not listed):
Global file usage
The following other wikis use this file:
- Usage on ro.wikipedia.org