Size of this PNG preview of this WEBP file:
710 × 599 pixels. Other resolutions:
284 × 240 pixels |
569 × 480 pixels |
910 × 768 pixels |
1,213 × 1,024 pixels |
1,296 × 1,094 pixels.
Original file (1,296 × 1,094 pixels, file size: 109 KB, MIME type: image/webp)
| This is a file from the
Wikimedia Commons. Information from its
description page there is shown below. Commons is a freely licensed media file repository. You can help. |
Summary
| Description |
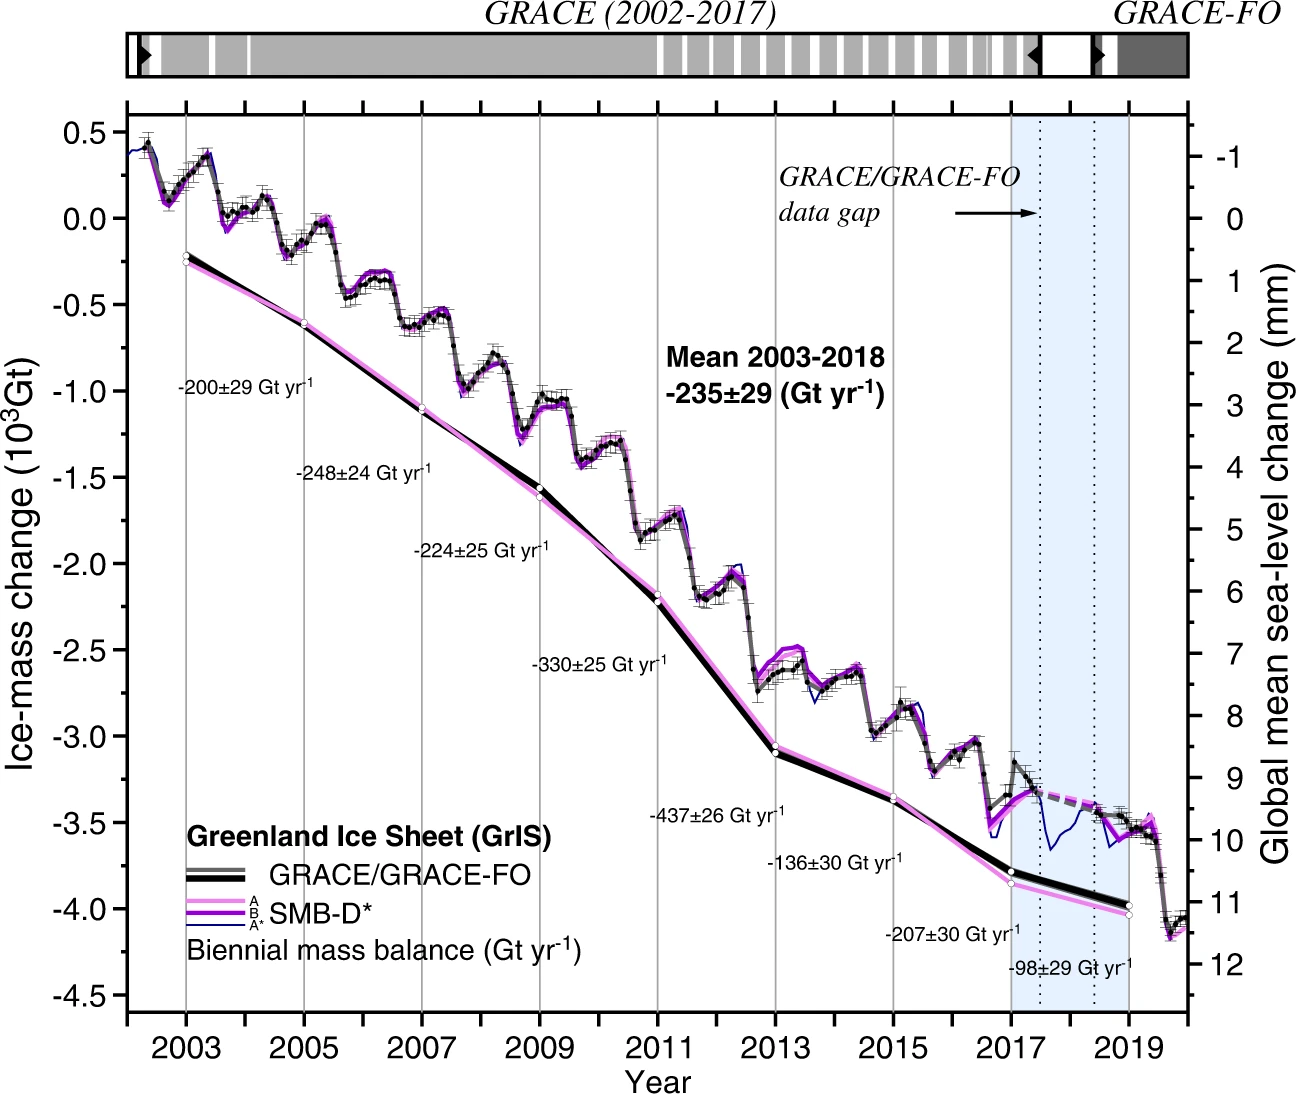
English: "Time series of mass change from the GRACE and GRACE-FO missions (black, with 2-σ error bars) and simulations using the regional climate models MARv3.1030 (A; light violet) and RACMO2.3p231 (B; dark violet) and calibrated outflow measurements from feature tracking of optical and radar imagery (SMB-D*), updated from32 (“Methods” section). The top bar indicates the availability of GRACE and GRACE-FO measurements, the vertical dashed lines frame the data gap between both missions. The blue shading covers the biennial period 2017–2018, which contains the GRACE/GRACE-FO data gap (dotted line). The monthly SMB-D* data shown for MARv3.10 (A*; dark blue) are linearly interpolated to match the GRACE/GRACE-FO measurement timeframes. Both datasets are fitted with a biennial piecewise linear trend (breakpoints on January 1st of each year), revealing accelerated mass losses until 2012, followed by a slowdown and particularly small loss during the years 2017 and 2018. Values denote biennial mass balances in Gt year−1." |
| Date | |
| Source | https://www.nature.com/articles/s43247-020-0010-1#Fig1 |
| Author | Authors of the study: Ingo Sasgen, Bert Wouters, Alex S. Gardner, Michalea D. King, Marco Tedesco, Felix W. Landerer, Christoph Dahle, Himanshu Save & Xavier Fettweis |
Licensing
This file is licensed under the
Creative Commons
Attribution 4.0 International license.
- You are free:
- to share – to copy, distribute and transmit the work
- to remix – to adapt the work
- Under the following conditions:
- attribution – You must give appropriate credit, provide a link to the license, and indicate if changes were made. You may do so in any reasonable manner, but not in any way that suggests the licensor endorses you or your use.
File history
Click on a date/time to view the file as it appeared at that time.
| Date/Time | Thumbnail | Dimensions | User | Comment | |
|---|---|---|---|---|---|
| current | 11:14, 6 September 2020 |
| 1,296 × 1,094 (109 KB) | Prototyperspective | Uploaded a work by Authors of the study: Ingo Sasgen, Bert Wouters, Alex S. Gardner, Michalea D. King, Marco Tedesco, Felix W. Landerer, Christoph Dahle, Himanshu Save & Xavier Fettweis from https://www.nature.com/articles/s43247-020-0010-1#Fig1 with UploadWizard |
File usage
The following pages on the English Wikipedia use this file (pages on other projects are not listed):
Global file usage
The following other wikis use this file:
- Usage on de.wikipedia.org
Size of this PNG preview of this WEBP file:
710 × 599 pixels. Other resolutions:
284 × 240 pixels |
569 × 480 pixels |
910 × 768 pixels |
1,213 × 1,024 pixels |
1,296 × 1,094 pixels.
Original file (1,296 × 1,094 pixels, file size: 109 KB, MIME type: image/webp)
| This is a file from the
Wikimedia Commons. Information from its
description page there is shown below. Commons is a freely licensed media file repository. You can help. |
Summary
| Description |
English: "Time series of mass change from the GRACE and GRACE-FO missions (black, with 2-σ error bars) and simulations using the regional climate models MARv3.1030 (A; light violet) and RACMO2.3p231 (B; dark violet) and calibrated outflow measurements from feature tracking of optical and radar imagery (SMB-D*), updated from32 (“Methods” section). The top bar indicates the availability of GRACE and GRACE-FO measurements, the vertical dashed lines frame the data gap between both missions. The blue shading covers the biennial period 2017–2018, which contains the GRACE/GRACE-FO data gap (dotted line). The monthly SMB-D* data shown for MARv3.10 (A*; dark blue) are linearly interpolated to match the GRACE/GRACE-FO measurement timeframes. Both datasets are fitted with a biennial piecewise linear trend (breakpoints on January 1st of each year), revealing accelerated mass losses until 2012, followed by a slowdown and particularly small loss during the years 2017 and 2018. Values denote biennial mass balances in Gt year−1." |
| Date | |
| Source | https://www.nature.com/articles/s43247-020-0010-1#Fig1 |
| Author | Authors of the study: Ingo Sasgen, Bert Wouters, Alex S. Gardner, Michalea D. King, Marco Tedesco, Felix W. Landerer, Christoph Dahle, Himanshu Save & Xavier Fettweis |
Licensing
This file is licensed under the
Creative Commons
Attribution 4.0 International license.
- You are free:
- to share – to copy, distribute and transmit the work
- to remix – to adapt the work
- Under the following conditions:
- attribution – You must give appropriate credit, provide a link to the license, and indicate if changes were made. You may do so in any reasonable manner, but not in any way that suggests the licensor endorses you or your use.
File history
Click on a date/time to view the file as it appeared at that time.
| Date/Time | Thumbnail | Dimensions | User | Comment | |
|---|---|---|---|---|---|
| current | 11:14, 6 September 2020 |
| 1,296 × 1,094 (109 KB) | Prototyperspective | Uploaded a work by Authors of the study: Ingo Sasgen, Bert Wouters, Alex S. Gardner, Michalea D. King, Marco Tedesco, Felix W. Landerer, Christoph Dahle, Himanshu Save & Xavier Fettweis from https://www.nature.com/articles/s43247-020-0010-1#Fig1 with UploadWizard |
File usage
The following pages on the English Wikipedia use this file (pages on other projects are not listed):
Global file usage
The following other wikis use this file:
- Usage on de.wikipedia.org