
Original file (1,500 × 1,217 pixels, file size: 702 KB, MIME type: image/png)
| This is a file from the
Wikimedia Commons. Information from its
description page there is shown below. Commons is a freely licensed media file repository. You can help. |
Summary
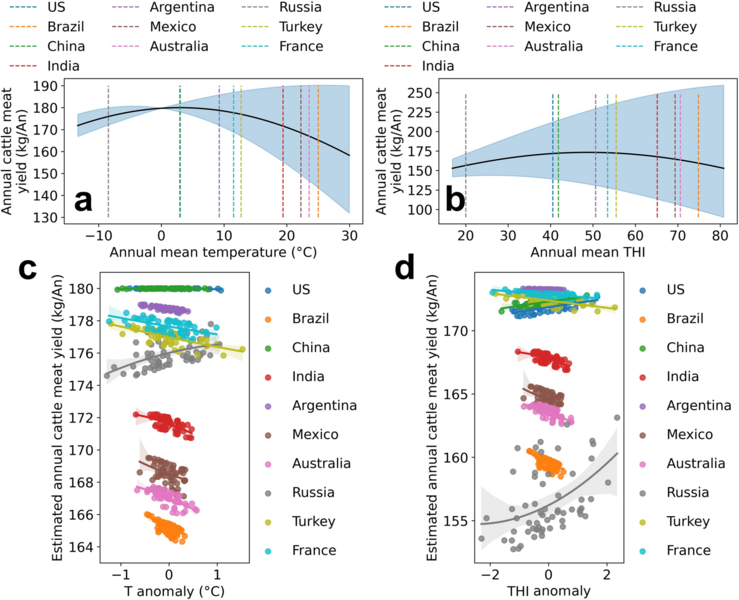
This graphic, from Liu et al., 2024, shows how increases in temperature and thermal heat index associated with w:climate change affect w:beef production in the top 10 producer countries. The graphic has been modified from the original to correct two typos in the caption ("anomlay" > anomaly).
Licensing
- You are free:
- to share – to copy, distribute and transmit the work
- to remix – to adapt the work
- Under the following conditions:
- attribution – You must give appropriate credit, provide a link to the license, and indicate if changes were made. You may do so in any reasonable manner, but not in any way that suggests the licensor endorses you or your use.
File history
Click on a date/time to view the file as it appeared at that time.
| Date/Time | Thumbnail | Dimensions | User | Comment | |
|---|---|---|---|---|---|
| current | 15:46, 2 March 2024 |
| 1,500 × 1,217 (702 KB) | InformationToKnowledge | This graphic, from [https://www.nature.com/articles/s43247-024-01232-x Liu et al., 2024], shows how increases in temperature and thermal heat index associated with climate change affect beef production in the top 10 producer countries. |
File usage
Original file (1,500 × 1,217 pixels, file size: 702 KB, MIME type: image/png)
| This is a file from the
Wikimedia Commons. Information from its
description page there is shown below. Commons is a freely licensed media file repository. You can help. |
Summary
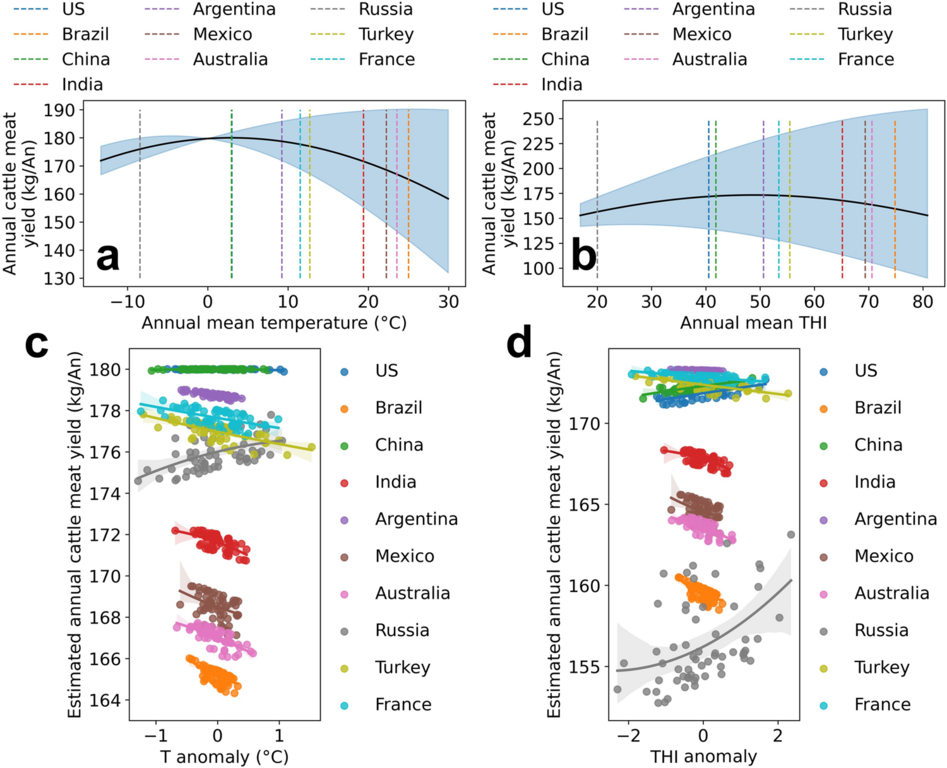
This graphic, from Liu et al., 2024, shows how increases in temperature and thermal heat index associated with w:climate change affect w:beef production in the top 10 producer countries. The graphic has been modified from the original to correct two typos in the caption ("anomlay" > anomaly).
Licensing
- You are free:
- to share – to copy, distribute and transmit the work
- to remix – to adapt the work
- Under the following conditions:
- attribution – You must give appropriate credit, provide a link to the license, and indicate if changes were made. You may do so in any reasonable manner, but not in any way that suggests the licensor endorses you or your use.
File history
Click on a date/time to view the file as it appeared at that time.
| Date/Time | Thumbnail | Dimensions | User | Comment | |
|---|---|---|---|---|---|
| current | 15:46, 2 March 2024 |
| 1,500 × 1,217 (702 KB) | InformationToKnowledge | This graphic, from [https://www.nature.com/articles/s43247-024-01232-x Liu et al., 2024], shows how increases in temperature and thermal heat index associated with climate change affect beef production in the top 10 producer countries. |