
Size of this PNG preview of this SVG file:
560 × 330 pixels. Other resolutions:
320 × 189 pixels |
640 × 377 pixels |
1,024 × 603 pixels |
1,280 × 754 pixels |
2,560 × 1,509 pixels.
Original file (SVG file, nominally 560 × 330 pixels, file size: 244 KB)
| This is a file from the
Wikimedia Commons. Information from its
description page there is shown below. Commons is a freely licensed media file repository. You can help. |
Summary
| Description |
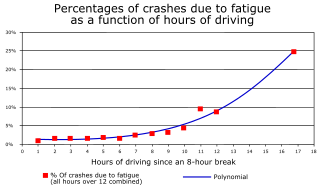
English: Graph outlining the relationship between number of hours driving and incidents of crashes involving truck drivers in the United States. All hours over 12 are combined, due to the low number of sample data. |
| Date | |
| Source | http://www.fmcsa.dot.gov/rules-regulations/topics/hos/regulatory-impact-analysis.htm |
| Author | FMCSA |
| Other versions | File:Regulatory-impact-analysis-image012.gif |
This W3C-unspecified
vector image was created with
Inkscape .
Licensing
This work is in the
public domain in the United States because it is a
work prepared by an officer or employee of the United States Government as part of that person’s official duties under the terms of
Title 17, Chapter 1, Section 105 of the
US Code.
Note: This only applies to original works of the Federal Government and not to the work of any individual
U.S. state,
territory, commonwealth, county, municipality, or any other subdivision. This template also does not apply to postage stamp designs published by the
United States Postal Service
since 1978. (See §
313.6(C)(1) of Compendium of U.S. Copyright Office Practices). It also does not apply to certain US coins; see
The US Mint Terms of Use.
|
 | |
| This file has been identified as being free of known restrictions under copyright law, including all related and neighboring rights. | ||
File history
Click on a date/time to view the file as it appeared at that time.
| Date/Time | Thumbnail | Dimensions | User | Comment | |
|---|---|---|---|---|---|
| current | 03:44, 15 June 2009 |
| 560 × 330 (244 KB) | ErgoSum88~commonswiki | remove black boxes |
| 03:32, 15 June 2009 |
 | 580 × 350 (244 KB) | ErgoSum88~commonswiki | {{Information |Description={{en|1=Graph outlining the relationship between number of hours driving and incidents of crashes involving truck drivers in the United States. All hours over 12 are combined, due to the low number of sample data.}} |Source=http: |
File usage
The following pages on the English Wikipedia use this file (pages on other projects are not listed):
Global file usage
The following other wikis use this file:
- Usage on ar.wikipedia.org
- Usage on de.wikipedia.org
- Usage on fa.wikipedia.org
- Usage on fr.wikipedia.org
- Usage on fr.wikiversity.org
- Usage on ja.wikipedia.org
- Usage on ml.wikipedia.org
- Usage on pt.wikipedia.org
- Usage on ru.wikipedia.org
- Usage on uk.wikipedia.org
Size of this PNG preview of this SVG file:
560 × 330 pixels. Other resolutions:
320 × 189 pixels |
640 × 377 pixels |
1,024 × 603 pixels |
1,280 × 754 pixels |
2,560 × 1,509 pixels.
Original file (SVG file, nominally 560 × 330 pixels, file size: 244 KB)
| This is a file from the
Wikimedia Commons. Information from its
description page there is shown below. Commons is a freely licensed media file repository. You can help. |
Summary
| Description |
English: Graph outlining the relationship between number of hours driving and incidents of crashes involving truck drivers in the United States. All hours over 12 are combined, due to the low number of sample data. |
| Date | |
| Source | http://www.fmcsa.dot.gov/rules-regulations/topics/hos/regulatory-impact-analysis.htm |
| Author | FMCSA |
| Other versions | File:Regulatory-impact-analysis-image012.gif |
This W3C-unspecified
vector image was created with
Inkscape .
Licensing
This work is in the
public domain in the United States because it is a
work prepared by an officer or employee of the United States Government as part of that person’s official duties under the terms of
Title 17, Chapter 1, Section 105 of the
US Code.
Note: This only applies to original works of the Federal Government and not to the work of any individual
U.S. state,
territory, commonwealth, county, municipality, or any other subdivision. This template also does not apply to postage stamp designs published by the
United States Postal Service
since 1978. (See §
313.6(C)(1) of Compendium of U.S. Copyright Office Practices). It also does not apply to certain US coins; see
The US Mint Terms of Use.
|
| |
| This file has been identified as being free of known restrictions under copyright law, including all related and neighboring rights. | ||
File history
Click on a date/time to view the file as it appeared at that time.
| Date/Time | Thumbnail | Dimensions | User | Comment | |
|---|---|---|---|---|---|
| current | 03:44, 15 June 2009 |
| 560 × 330 (244 KB) | ErgoSum88~commonswiki | remove black boxes |
| 03:32, 15 June 2009 |
| 580 × 350 (244 KB) | ErgoSum88~commonswiki | {{Information |Description={{en|1=Graph outlining the relationship between number of hours driving and incidents of crashes involving truck drivers in the United States. All hours over 12 are combined, due to the low number of sample data.}} |Source=http: |
File usage
The following pages on the English Wikipedia use this file (pages on other projects are not listed):
Global file usage
The following other wikis use this file:
- Usage on ar.wikipedia.org
- Usage on de.wikipedia.org
- Usage on fa.wikipedia.org
- Usage on fr.wikipedia.org
- Usage on fr.wikiversity.org
- Usage on ja.wikipedia.org
- Usage on ml.wikipedia.org
- Usage on pt.wikipedia.org
- Usage on ru.wikipedia.org
- Usage on uk.wikipedia.org