
Original file (1,688 × 1,041 pixels, file size: 118 KB, MIME type: image/png)
| This is a file from the
Wikimedia Commons. Information from its
description page there is shown below. Commons is a freely licensed media file repository. You can help. |
Summary
| Description |
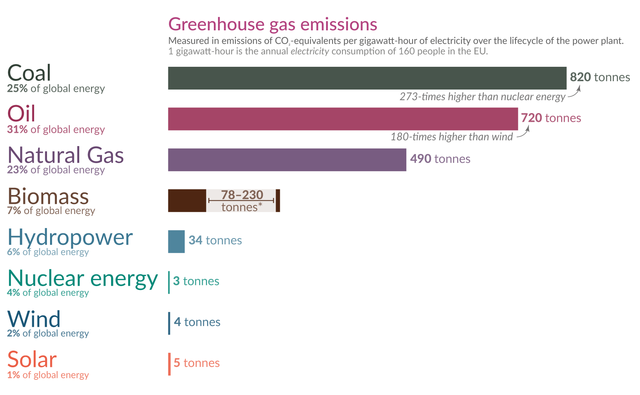
English: The world’s energy supply today is neither safe nor sustainable. What can we do to change this and make progress against this twin-problem of the status quo?
To see the way forward we have to understand the present. Today fossil fuels – coal, oil, and gas – account for 79% of the world’s energy production and as the chart below shows they have very large negative side effects. The bars to the left show the number of deaths and the bars on the right compare the greenhouse gas emissions. My colleague Hannah Ritchie explains the data in this chart in detail in her post ‘What are the safest sources of energy?’. This makes two things very clear. As the burning of fossil fuels accounts for 87% of the world’s CO2 emissions, a world run on fossil fuels is not sustainable, they endanger the lives and livelihoods of future generations and the biosphere around us. And the very same energy sources lead to the deaths of many people right now – the air pollution from burning fossil fuels kills 3.6 million people in countries around the world every year; this is 6-times the annual death toll of all murders, war deaths, and terrorist attacks combined. It is important to keep in mind that electric energy is only one of several forms of energy that humanity relies on; the transition to low-carbon energy is therefore a bigger task than the transition to low-carbon electricity. What the chart makes clear is that the alternatives to fossil fuels – renewable energy sources and nuclear power – are orders of magnitude safer and cleaner than fossil fuels. |
| Date | |
| Source | https://ourworldindata.org/cheap-renewables-growth |
| Author | Our World In Data - Max Roser |
| Other versions |

Licensing
- You are free:
- to share – to copy, distribute and transmit the work
- to remix – to adapt the work
- Under the following conditions:
- attribution – You must give appropriate credit, provide a link to the license, and indicate if changes were made. You may do so in any reasonable manner, but not in any way that suggests the licensor endorses you or your use.
- share alike – If you remix, transform, or build upon the material, you must distribute your contributions under the same or compatible license as the original.
File history
Click on a date/time to view the file as it appeared at that time.
| Date/Time | Thumbnail | Dimensions | User | Comment | |
|---|---|---|---|---|---|
| current | 13:13, 25 March 2023 |
| 1,688 × 1,041 (118 KB) | PJ Geest | File:5-Bar-chart-–-What-is-the-safest-form-of-energy.png cropped 36 % horizontally, 26 % vertically using CropTool with precise mode. |
File usage
Global file usage
The following other wikis use this file:
- Usage on cs.wikipedia.org
- Usage on de.wikipedia.org
- Usage on es.wikipedia.org
- Usage on fa.wikipedia.org
- Usage on fr.wikipedia.org
- Usage on nl.wikipedia.org
- Usage on uk.wikipedia.org
- Usage on zh.wikipedia.org
Metadata
Original file (1,688 × 1,041 pixels, file size: 118 KB, MIME type: image/png)
| This is a file from the
Wikimedia Commons. Information from its
description page there is shown below. Commons is a freely licensed media file repository. You can help. |
Summary
| Description |
English: The world’s energy supply today is neither safe nor sustainable. What can we do to change this and make progress against this twin-problem of the status quo?
To see the way forward we have to understand the present. Today fossil fuels – coal, oil, and gas – account for 79% of the world’s energy production and as the chart below shows they have very large negative side effects. The bars to the left show the number of deaths and the bars on the right compare the greenhouse gas emissions. My colleague Hannah Ritchie explains the data in this chart in detail in her post ‘What are the safest sources of energy?’. This makes two things very clear. As the burning of fossil fuels accounts for 87% of the world’s CO2 emissions, a world run on fossil fuels is not sustainable, they endanger the lives and livelihoods of future generations and the biosphere around us. And the very same energy sources lead to the deaths of many people right now – the air pollution from burning fossil fuels kills 3.6 million people in countries around the world every year; this is 6-times the annual death toll of all murders, war deaths, and terrorist attacks combined. It is important to keep in mind that electric energy is only one of several forms of energy that humanity relies on; the transition to low-carbon energy is therefore a bigger task than the transition to low-carbon electricity. What the chart makes clear is that the alternatives to fossil fuels – renewable energy sources and nuclear power – are orders of magnitude safer and cleaner than fossil fuels. |
| Date | |
| Source | https://ourworldindata.org/cheap-renewables-growth |
| Author | Our World In Data - Max Roser |
| Other versions |
Licensing
- You are free:
- to share – to copy, distribute and transmit the work
- to remix – to adapt the work
- Under the following conditions:
- attribution – You must give appropriate credit, provide a link to the license, and indicate if changes were made. You may do so in any reasonable manner, but not in any way that suggests the licensor endorses you or your use.
- share alike – If you remix, transform, or build upon the material, you must distribute your contributions under the same or compatible license as the original.
File history
Click on a date/time to view the file as it appeared at that time.
| Date/Time | Thumbnail | Dimensions | User | Comment | |
|---|---|---|---|---|---|
| current | 13:13, 25 March 2023 |
| 1,688 × 1,041 (118 KB) | PJ Geest | File:5-Bar-chart-–-What-is-the-safest-form-of-energy.png cropped 36 % horizontally, 26 % vertically using CropTool with precise mode. |
File usage
Global file usage
The following other wikis use this file:
- Usage on cs.wikipedia.org
- Usage on de.wikipedia.org
- Usage on es.wikipedia.org
- Usage on fa.wikipedia.org
- Usage on fr.wikipedia.org
- Usage on nl.wikipedia.org
- Usage on uk.wikipedia.org
- Usage on zh.wikipedia.org