Carbon_basic_phase_diagram.png (672 × 509 pixels, file size: 13 KB, MIME type: image/png)
| This is a file from the
Wikimedia Commons. Information from its
description page there is shown below. Commons is a freely licensed media file repository. You can help. |

|
File:Carbon-phase-diagramp.svg is a vector version of this file. It should be used in place of this PNG file when not inferior.
File:Carbon basic phase diagram.png →
File:Carbon-phase-diagramp.svg
For more information, see
Help:SVG. |
 |
Summary
| Description |
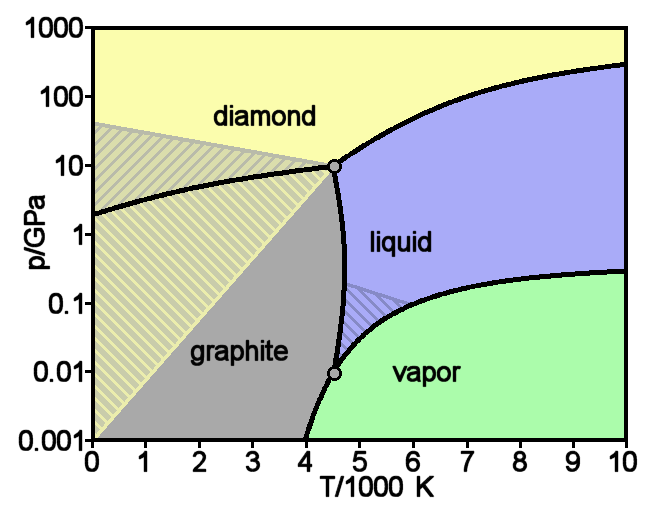
English: Theoretical phase diagram of carbon, which shows the state of matter for varying temperatures and pressures. The hatched regions indicate conditions under which one phase is metastable, so that two phases can coexist. The source reference says that the phase diagram is well established only up to around 100 GPa. More recent work shows that the melting point does not go as high as 10,000 K.
Accurate illustration but not a pixel-exact plot. Also note that a considerable disagreement exists between theory and experiment, e.g., for the triple point
doi:
10.1016/0008-6223(76)90010-5 |
| Date | Source: English Wikipedia, original upload 16 April 2005 by Femto en:Image:Carbon basic phase diagram.png |
| Source |
Own work using:
|
| Author | User name at English Wikipedia |
| Other versions |
.png:
.jpg:
|


| |
This work has been released into the
public domain by its author,
Femto, at the
English Wikipedia project. This applies worldwide. In case this is not legally possible: |
File history
Click on a date/time to view the file as it appeared at that time.
| Date/Time | Thumbnail | Dimensions | User | Comment | |
|---|---|---|---|---|---|
| current | 08:19, 7 September 2005 |
| 672 × 509 (13 KB) | Saperaud~commonswiki | Basic phase diagram of carbon, which shows the state of matter for varying temperatures and pressures. The hatched regions indicate conditions under which one phase is metastable, so that two phases can coexist. Accurate illustration but not a pixel-exac |
File usage
- Graphite
- List of minerals recognized by the International Mineralogical Association
- Wikipedia:Reference desk/Archives/Science/2010 December 19
- Wikipedia:Reference desk/Archives/Science/2012 December 20
- Wikipedia:Reference desk/Archives/Science/2012 November 27
- Wikipedia:Reference desk/Archives/Science/2013 May 21
- Wikipedia:WikiProject WikiFundi Content/Diamond
Global file usage
The following other wikis use this file:
- Usage on ba.wikipedia.org
- Usage on bg.wikipedia.org
- Usage on cv.wikipedia.org
- Usage on da.wikipedia.org
- Usage on el.wikipedia.org
- Usage on eo.wikipedia.org
- Usage on es.wikipedia.org
- Usage on eu.wikipedia.org
- Usage on fr.wikipedia.org
- Usage on fr.wikibooks.org
- Usage on hu.wikipedia.org
- Usage on hy.wikipedia.org
- Usage on ja.wikipedia.org
- Usage on ka.wikipedia.org
- Usage on lez.wikipedia.org
- Usage on nl.wikipedia.org
- Usage on si.wikipedia.org
- Usage on sl.wikipedia.org
- Usage on sr.wikipedia.org
- Usage on th.wikipedia.org
- Usage on tt.wikipedia.org
- Usage on vi.wikipedia.org
- Usage on www.wikidata.org
- Usage on yo.wikipedia.org
- Usage on zh.wikipedia.org
Carbon_basic_phase_diagram.png (672 × 509 pixels, file size: 13 KB, MIME type: image/png)
| This is a file from the
Wikimedia Commons. Information from its
description page there is shown below. Commons is a freely licensed media file repository. You can help. |
|
|
File:Carbon-phase-diagramp.svg is a vector version of this file. It should be used in place of this PNG file when not inferior.
File:Carbon basic phase diagram.png →
File:Carbon-phase-diagramp.svg
For more information, see
Help:SVG. |
|
Summary
| Description |
English: Theoretical phase diagram of carbon, which shows the state of matter for varying temperatures and pressures. The hatched regions indicate conditions under which one phase is metastable, so that two phases can coexist. The source reference says that the phase diagram is well established only up to around 100 GPa. More recent work shows that the melting point does not go as high as 10,000 K.
Accurate illustration but not a pixel-exact plot. Also note that a considerable disagreement exists between theory and experiment, e.g., for the triple point
doi:
10.1016/0008-6223(76)90010-5 |
| Date | Source: English Wikipedia, original upload 16 April 2005 by Femto en:Image:Carbon basic phase diagram.png |
| Source |
Own work using:
|
| Author | User name at English Wikipedia |
| Other versions |
.png:
.jpg:
|
| |
This work has been released into the
public domain by its author,
Femto, at the
English Wikipedia project. This applies worldwide. In case this is not legally possible: |
File history
Click on a date/time to view the file as it appeared at that time.
| Date/Time | Thumbnail | Dimensions | User | Comment | |
|---|---|---|---|---|---|
| current | 08:19, 7 September 2005 |
| 672 × 509 (13 KB) | Saperaud~commonswiki | Basic phase diagram of carbon, which shows the state of matter for varying temperatures and pressures. The hatched regions indicate conditions under which one phase is metastable, so that two phases can coexist. Accurate illustration but not a pixel-exac |
File usage
- Graphite
- List of minerals recognized by the International Mineralogical Association
- Wikipedia:Reference desk/Archives/Science/2010 December 19
- Wikipedia:Reference desk/Archives/Science/2012 December 20
- Wikipedia:Reference desk/Archives/Science/2012 November 27
- Wikipedia:Reference desk/Archives/Science/2013 May 21
- Wikipedia:WikiProject WikiFundi Content/Diamond
Global file usage
The following other wikis use this file:
- Usage on ba.wikipedia.org
- Usage on bg.wikipedia.org
- Usage on cv.wikipedia.org
- Usage on da.wikipedia.org
- Usage on el.wikipedia.org
- Usage on eo.wikipedia.org
- Usage on es.wikipedia.org
- Usage on eu.wikipedia.org
- Usage on fr.wikipedia.org
- Usage on fr.wikibooks.org
- Usage on hu.wikipedia.org
- Usage on hy.wikipedia.org
- Usage on ja.wikipedia.org
- Usage on ka.wikipedia.org
- Usage on lez.wikipedia.org
- Usage on nl.wikipedia.org
- Usage on si.wikipedia.org
- Usage on sl.wikipedia.org
- Usage on sr.wikipedia.org
- Usage on th.wikipedia.org
- Usage on tt.wikipedia.org
- Usage on vi.wikipedia.org
- Usage on www.wikidata.org
- Usage on yo.wikipedia.org
- Usage on zh.wikipedia.org