
Size of this PNG preview of this SVG file:
800 × 450 pixels. Other resolutions:
320 × 180 pixels |
640 × 360 pixels |
1,024 × 576 pixels |
1,280 × 720 pixels |
2,560 × 1,440 pixels |
1,200 × 675 pixels.
Original file (SVG file, nominally 1,200 × 675 pixels, file size: 12 KB)
| This is a file from the
Wikimedia Commons. Information from its
description page there is shown below. Commons is a freely licensed media file repository. You can help. |
Summary
| Description |
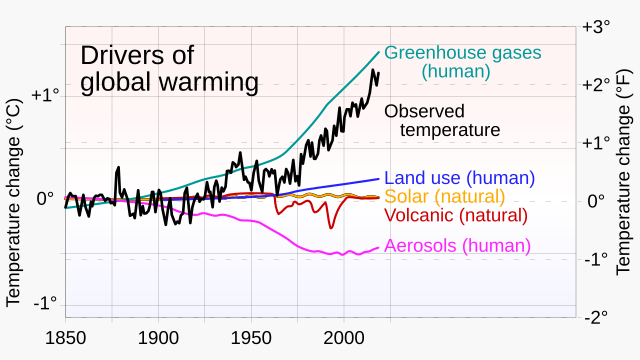
English: Chart showing attribution of global warming to climate drivers, from Fig. 3.1.c of the Fifth National Climate Assessment (NCA5) of the US Global Change Research Program (USGCRP)
|
||
| Date | |||
| Source | Own work | ||
| Author | RCraig09 |

Related files
-
 20231114 Attribution of global warming to climate drivers- NCA5 Fig. 3.1.c.jpg —
NCA5 original -
 20231114 Attribution of global warming to climate drivers- based on NCA5 Fig. 3.1.c.svg —
SVG "traced" from NCA5 original -
 20231114 Attribution of global warming to climate drivers- based on NCA5 Fig. 3.1.c.gif
GIF with frames derived from SVG


Licensing
I, the copyright holder of this work, hereby publish it under the following license:
This file is licensed under the
Creative Commons
Attribution-Share Alike 4.0 International license.
- You are free:
- to share – to copy, distribute and transmit the work
- to remix – to adapt the work
- Under the following conditions:
- attribution – You must give appropriate credit, provide a link to the license, and indicate if changes were made. You may do so in any reasonable manner, but not in any way that suggests the licensor endorses you or your use.
- share alike – If you remix, transform, or build upon the material, you must distribute your contributions under the same or compatible license as the original.
File history
Click on a date/time to view the file as it appeared at that time.
| Date/Time | Thumbnail | Dimensions | User | Comment | |
|---|---|---|---|---|---|
| current | 16:16, 24 November 2023 |
| 1,200 × 675 (12 KB) | RCraig09 | Version 3: commented out the confidence intervals . . . changed color of "Solar..." label . . . moved "Observed temperature" . . . per discussion at en.WP's Talk:Attribution of recent climate change |
| 21:57, 19 November 2023 |
 | 1,200 × 675 (12 KB) | RCraig09 | Version 2: changing legends per discussion at Talk:Attribution of recent climate change . . . add gradient of subtle blue and red shading in chart area to signify cooling and warming influences | |
| 06:08, 18 November 2023 |
 | 1,200 × 675 (12 KB) | RCraig09 | Uploaded own work with UploadWizard |
File usage
The following pages on the English Wikipedia use this file (pages on other projects are not listed):
Metadata
Size of this PNG preview of this SVG file:
800 × 450 pixels. Other resolutions:
320 × 180 pixels |
640 × 360 pixels |
1,024 × 576 pixels |
1,280 × 720 pixels |
2,560 × 1,440 pixels |
1,200 × 675 pixels.
Original file (SVG file, nominally 1,200 × 675 pixels, file size: 12 KB)
| This is a file from the
Wikimedia Commons. Information from its
description page there is shown below. Commons is a freely licensed media file repository. You can help. |
Summary
| Description |
English: Chart showing attribution of global warming to climate drivers, from Fig. 3.1.c of the Fifth National Climate Assessment (NCA5) of the US Global Change Research Program (USGCRP)
|
||
| Date | |||
| Source | Own work | ||
| Author | RCraig09 |
Related files
-
20231114 Attribution of global warming to climate drivers- NCA5 Fig. 3.1.c.jpg —
NCA5 original -
20231114 Attribution of global warming to climate drivers- based on NCA5 Fig. 3.1.c.svg —
SVG "traced" from NCA5 original -
20231114 Attribution of global warming to climate drivers- based on NCA5 Fig. 3.1.c.gif
GIF with frames derived from SVG
Licensing
I, the copyright holder of this work, hereby publish it under the following license:
This file is licensed under the
Creative Commons
Attribution-Share Alike 4.0 International license.
- You are free:
- to share – to copy, distribute and transmit the work
- to remix – to adapt the work
- Under the following conditions:
- attribution – You must give appropriate credit, provide a link to the license, and indicate if changes were made. You may do so in any reasonable manner, but not in any way that suggests the licensor endorses you or your use.
- share alike – If you remix, transform, or build upon the material, you must distribute your contributions under the same or compatible license as the original.
File history
Click on a date/time to view the file as it appeared at that time.
| Date/Time | Thumbnail | Dimensions | User | Comment | |
|---|---|---|---|---|---|
| current | 16:16, 24 November 2023 |
| 1,200 × 675 (12 KB) | RCraig09 | Version 3: commented out the confidence intervals . . . changed color of "Solar..." label . . . moved "Observed temperature" . . . per discussion at en.WP's Talk:Attribution of recent climate change |
| 21:57, 19 November 2023 |
| 1,200 × 675 (12 KB) | RCraig09 | Version 2: changing legends per discussion at Talk:Attribution of recent climate change . . . add gradient of subtle blue and red shading in chart area to signify cooling and warming influences | |
| 06:08, 18 November 2023 |
| 1,200 × 675 (12 KB) | RCraig09 | Uploaded own work with UploadWizard |
File usage
The following pages on the English Wikipedia use this file (pages on other projects are not listed):