
Original file (SVG file, nominally 1,000 × 643 pixels, file size: 72 KB)
| This is a file from the
Wikimedia Commons. Information from its
description page there is shown below. Commons is a freely licensed media file repository. You can help. |
_GISS.svg)
Summary
| Description |
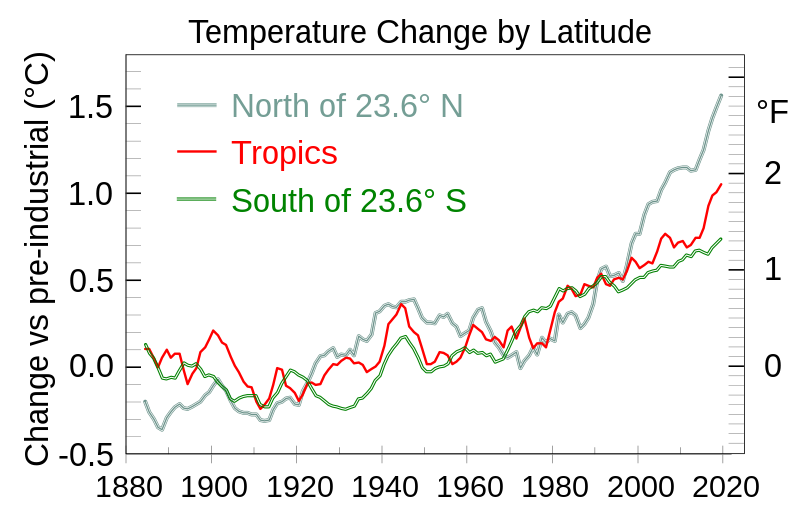
English: Graphs of average temperature changes for three latitude bands, 1880- , 5-year smoothed.
Data source:
Description from source:
Notes on this file itself:
|
| Date | |
| Source | Own work |
| Author | RCraig09 |
Actual data
| Click at right to show/hide actual data used to make the chart |
|---|
|
To the right of Year, the first three columns are the annual data from NASA GISS, and the last three columns are the five-year-averaged data. Field names like "24N-90N" denote boundaries of latitude bands. Year 24N-90N 24S-24N 90S-24S N-5MA Tropic-5MA S-5MA
|
Licensing
- You are free:
- to share – to copy, distribute and transmit the work
- to remix – to adapt the work
- Under the following conditions:
- attribution – You must give appropriate credit, provide a link to the license, and indicate if changes were made. You may do so in any reasonable manner, but not in any way that suggests the licensor endorses you or your use.
- share alike – If you remix, transform, or build upon the material, you must distribute your contributions under the same or compatible license as the original.
File history
Click on a date/time to view the file as it appeared at that time.
| Date/Time | Thumbnail | Dimensions | User | Comment | |
|---|---|---|---|---|---|
| current | 20:14, 26 August 2020 |
| 1,000 × 643 (72 KB) | RCraig09 | Version 6: Add Fahrenheit scale at right |
| 18:36, 23 March 2020 |
 | 960 × 643 (65 KB) | Efbrazil | Made design consistent with other graph showing temperature change by location | |
| 20:22, 21 March 2020 |
 | 2,000 × 1,500 (229 KB) | RCraig09 | Version 4: Changed legend: "Tr" to "T". Moved time axis up. Added minor explanatory text to tiny text in lower right. | |
| 16:55, 15 March 2020 |
 | 2,000 × 1,500 (230 KB) | RCraig09 | Version 3: Updated with GISS data for 2019. Changing of central legends. | |
| 03:06, 15 March 2020 |
 | 2,000 × 1,500 (214 KB) | RCraig09 | Version 2: Add extra layer of text that has been converted to "paths" (vectors) in Inkscape, to avoid gross rendering issues in Version 1. . . . Adding reference period in tiny text in lower right. | |
| 22:17, 14 March 2020 |
 | 2,000 × 1,500 (57 KB) | RCraig09 | Uploaded own work with UploadWizard |
File usage
Global file usage
The following other wikis use this file:
- Usage on zh.wikipedia.org
Metadata
_GISS.svg)
Original file (SVG file, nominally 1,000 × 643 pixels, file size: 72 KB)
| This is a file from the
Wikimedia Commons. Information from its
description page there is shown below. Commons is a freely licensed media file repository. You can help. |
Summary
| Description |
English: Graphs of average temperature changes for three latitude bands, 1880- , 5-year smoothed.
Data source:
Description from source:
Notes on this file itself:
|
| Date | |
| Source | Own work |
| Author | RCraig09 |
Actual data
| Click at right to show/hide actual data used to make the chart |
|---|
|
To the right of Year, the first three columns are the annual data from NASA GISS, and the last three columns are the five-year-averaged data. Field names like "24N-90N" denote boundaries of latitude bands. Year 24N-90N 24S-24N 90S-24S N-5MA Tropic-5MA S-5MA
|
Licensing
- You are free:
- to share – to copy, distribute and transmit the work
- to remix – to adapt the work
- Under the following conditions:
- attribution – You must give appropriate credit, provide a link to the license, and indicate if changes were made. You may do so in any reasonable manner, but not in any way that suggests the licensor endorses you or your use.
- share alike – If you remix, transform, or build upon the material, you must distribute your contributions under the same or compatible license as the original.
File history
Click on a date/time to view the file as it appeared at that time.
| Date/Time | Thumbnail | Dimensions | User | Comment | |
|---|---|---|---|---|---|
| current | 20:14, 26 August 2020 |
| 1,000 × 643 (72 KB) | RCraig09 | Version 6: Add Fahrenheit scale at right |
| 18:36, 23 March 2020 |
| 960 × 643 (65 KB) | Efbrazil | Made design consistent with other graph showing temperature change by location | |
| 20:22, 21 March 2020 |
| 2,000 × 1,500 (229 KB) | RCraig09 | Version 4: Changed legend: "Tr" to "T". Moved time axis up. Added minor explanatory text to tiny text in lower right. | |
| 16:55, 15 March 2020 |
| 2,000 × 1,500 (230 KB) | RCraig09 | Version 3: Updated with GISS data for 2019. Changing of central legends. | |
| 03:06, 15 March 2020 |
| 2,000 × 1,500 (214 KB) | RCraig09 | Version 2: Add extra layer of text that has been converted to "paths" (vectors) in Inkscape, to avoid gross rendering issues in Version 1. . . . Adding reference period in tiny text in lower right. | |
| 22:17, 14 March 2020 |
| 2,000 × 1,500 (57 KB) | RCraig09 | Uploaded own work with UploadWizard |
File usage
Global file usage
The following other wikis use this file:
- Usage on zh.wikipedia.org