
Size of this PNG preview of this SVG file:
800 × 567 pixels. Other resolutions:
320 × 227 pixels |
640 × 453 pixels |
1,024 × 725 pixels |
1,280 × 907 pixels |
2,560 × 1,813 pixels |
1,200 × 850 pixels.
Original file (SVG file, nominally 1,200 × 850 pixels, file size: 3 KB)
| This is a file from the
Wikimedia Commons. Information from its
description page there is shown below. Commons is a freely licensed media file repository. You can help. |
Summary
| Description |
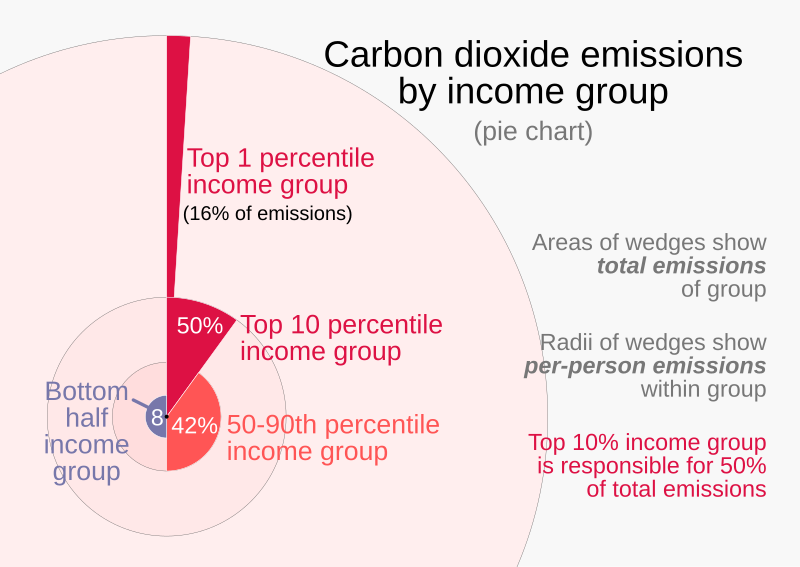
English: Chart showing total and per-person carbon dioxide emissions by income group, based on data from Oxfam International
|
||
| Date | |||
| Source | Own work | ||
| Author | RCraig09 |

Licensing
I, the copyright holder of this work, hereby publish it under the following license:
This file is licensed under the
Creative Commons
Attribution-Share Alike 4.0 International license.
- You are free:
- to share – to copy, distribute and transmit the work
- to remix – to adapt the work
- Under the following conditions:
- attribution – You must give appropriate credit, provide a link to the license, and indicate if changes were made. You may do so in any reasonable manner, but not in any way that suggests the licensor endorses you or your use.
- share alike – If you remix, transform, or build upon the material, you must distribute your contributions under the same or compatible license as the original.
File history
Click on a date/time to view the file as it appeared at that time.
| Date/Time | Thumbnail | Dimensions | User | Comment | |
|---|---|---|---|---|---|
| current | 16:45, 24 November 2023 |
| 1,200 × 850 (3 KB) | RCraig09 | Version 2: change wording at right . . . increase stroke-width of background circles |
| 19:39, 23 November 2023 |
 | 1,200 × 850 (2 KB) | RCraig09 | Uploaded own work with UploadWizard |
File usage
The following pages on the English Wikipedia use this file (pages on other projects are not listed):
Global file usage
The following other wikis use this file:
- Usage on zh.wikipedia.org
Metadata
Size of this PNG preview of this SVG file:
800 × 567 pixels. Other resolutions:
320 × 227 pixels |
640 × 453 pixels |
1,024 × 725 pixels |
1,280 × 907 pixels |
2,560 × 1,813 pixels |
1,200 × 850 pixels.
Original file (SVG file, nominally 1,200 × 850 pixels, file size: 3 KB)
| This is a file from the
Wikimedia Commons. Information from its
description page there is shown below. Commons is a freely licensed media file repository. You can help. |
Summary
| Description |
English: Chart showing total and per-person carbon dioxide emissions by income group, based on data from Oxfam International
|
||
| Date | |||
| Source | Own work | ||
| Author | RCraig09 |
Licensing
I, the copyright holder of this work, hereby publish it under the following license:
This file is licensed under the
Creative Commons
Attribution-Share Alike 4.0 International license.
- You are free:
- to share – to copy, distribute and transmit the work
- to remix – to adapt the work
- Under the following conditions:
- attribution – You must give appropriate credit, provide a link to the license, and indicate if changes were made. You may do so in any reasonable manner, but not in any way that suggests the licensor endorses you or your use.
- share alike – If you remix, transform, or build upon the material, you must distribute your contributions under the same or compatible license as the original.
File history
Click on a date/time to view the file as it appeared at that time.
| Date/Time | Thumbnail | Dimensions | User | Comment | |
|---|---|---|---|---|---|
| current | 16:45, 24 November 2023 |
| 1,200 × 850 (3 KB) | RCraig09 | Version 2: change wording at right . . . increase stroke-width of background circles |
| 19:39, 23 November 2023 |
| 1,200 × 850 (2 KB) | RCraig09 | Uploaded own work with UploadWizard |
File usage
The following pages on the English Wikipedia use this file (pages on other projects are not listed):
Global file usage
The following other wikis use this file:
- Usage on zh.wikipedia.org