
Size of this preview:
800 × 465 pixels. Other resolutions:
320 × 186 pixels |
640 × 372 pixels |
1,024 × 595 pixels |
1,280 × 744 pixels |
2,560 × 1,488 pixels |
4,116 × 2,392 pixels.
Original file (4,116 × 2,392 pixels, file size: 122 KB, MIME type: image/png)
| This is a file from the
Wikimedia Commons. Information from its
description page there is shown below. Commons is a freely licensed media file repository. You can help. |
.png)
Summary
| Description |
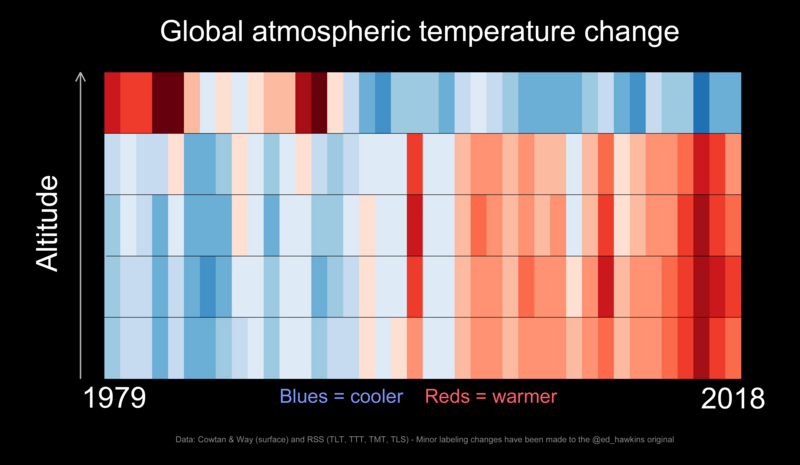
English: Stacked
warming stripes
data visualization by
Ed Hawkins (scientist), showing changes in temperature in different layers of earth's atmosphere (1979- )
General notes:
|
| Date | |
| Source | Hawkins, Ed, Atmospheric temperature trends. Climate Lab Book (12 September 2019). Archived from the original on 12 September 2019. |
| Author | Ed Hawkins (scientist), climate scientist at the University of Reading |
}}
Licensing
This file is licensed under the
Creative Commons
Attribution-Share Alike 4.0 International license.
- You are free:
- to share – to copy, distribute and transmit the work
- to remix – to adapt the work
- Under the following conditions:
- attribution – You must give appropriate credit, provide a link to the license, and indicate if changes were made. You may do so in any reasonable manner, but not in any way that suggests the licensor endorses you or your use.
- share alike – If you remix, transform, or build upon the material, you must distribute your contributions under the same or compatible license as the original.
File history
Click on a date/time to view the file as it appeared at that time.
| Date/Time | Thumbnail | Dimensions | User | Comment | |
|---|---|---|---|---|---|
| current | 05:18, 16 September 2023 |
| 4,116 × 2,392 (122 KB) | RCraig09 | Version 2: reduce file size at tinypng.com |
| 19:39, 12 September 2019 |
 | 4,116 × 2,392 (168 KB) | RCraig09 | User created page with UploadWizard |
File usage
The following pages on the English Wikipedia use this file (pages on other projects are not listed):
Global file usage
The following other wikis use this file:
- Usage on fr.wikipedia.org
- Usage on zh.wikipedia.org
.png)
Size of this preview:
800 × 465 pixels. Other resolutions:
320 × 186 pixels |
640 × 372 pixels |
1,024 × 595 pixels |
1,280 × 744 pixels |
2,560 × 1,488 pixels |
4,116 × 2,392 pixels.
Original file (4,116 × 2,392 pixels, file size: 122 KB, MIME type: image/png)
| This is a file from the
Wikimedia Commons. Information from its
description page there is shown below. Commons is a freely licensed media file repository. You can help. |
Summary
| Description |
English: Stacked
warming stripes
data visualization by
Ed Hawkins (scientist), showing changes in temperature in different layers of earth's atmosphere (1979- )
General notes:
|
| Date | |
| Source | Hawkins, Ed, Atmospheric temperature trends. Climate Lab Book (12 September 2019). Archived from the original on 12 September 2019. |
| Author | Ed Hawkins (scientist), climate scientist at the University of Reading |
}}
Licensing
This file is licensed under the
Creative Commons
Attribution-Share Alike 4.0 International license.
- You are free:
- to share – to copy, distribute and transmit the work
- to remix – to adapt the work
- Under the following conditions:
- attribution – You must give appropriate credit, provide a link to the license, and indicate if changes were made. You may do so in any reasonable manner, but not in any way that suggests the licensor endorses you or your use.
- share alike – If you remix, transform, or build upon the material, you must distribute your contributions under the same or compatible license as the original.
File history
Click on a date/time to view the file as it appeared at that time.
| Date/Time | Thumbnail | Dimensions | User | Comment | |
|---|---|---|---|---|---|
| current | 05:18, 16 September 2023 |
| 4,116 × 2,392 (122 KB) | RCraig09 | Version 2: reduce file size at tinypng.com |
| 19:39, 12 September 2019 |
| 4,116 × 2,392 (168 KB) | RCraig09 | User created page with UploadWizard |
File usage
The following pages on the English Wikipedia use this file (pages on other projects are not listed):
Global file usage
The following other wikis use this file:
- Usage on fr.wikipedia.org
- Usage on zh.wikipedia.org