
Original file (SVG file, nominally 1,000 × 750 pixels, file size: 251 KB)
| This is a file from the
Wikimedia Commons. Information from its
description page there is shown below. Commons is a freely licensed media file repository. You can help. |
Summary
| Description |
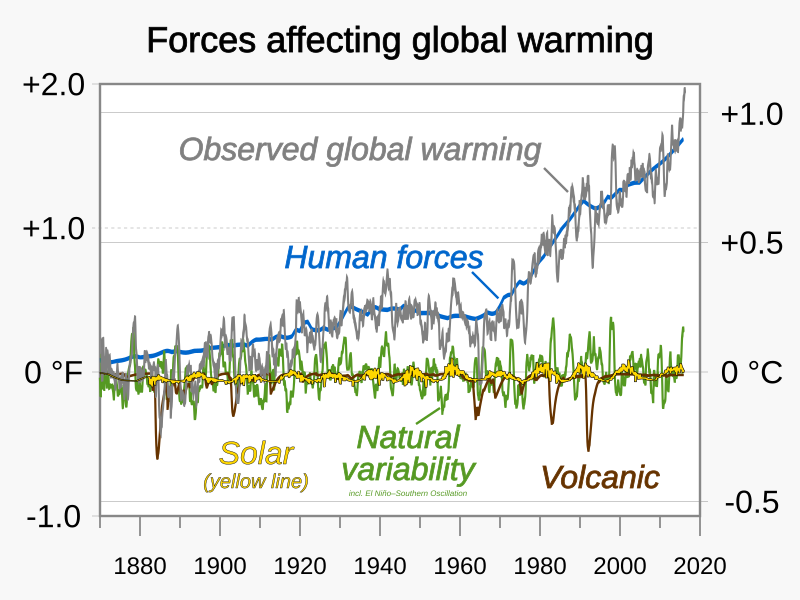
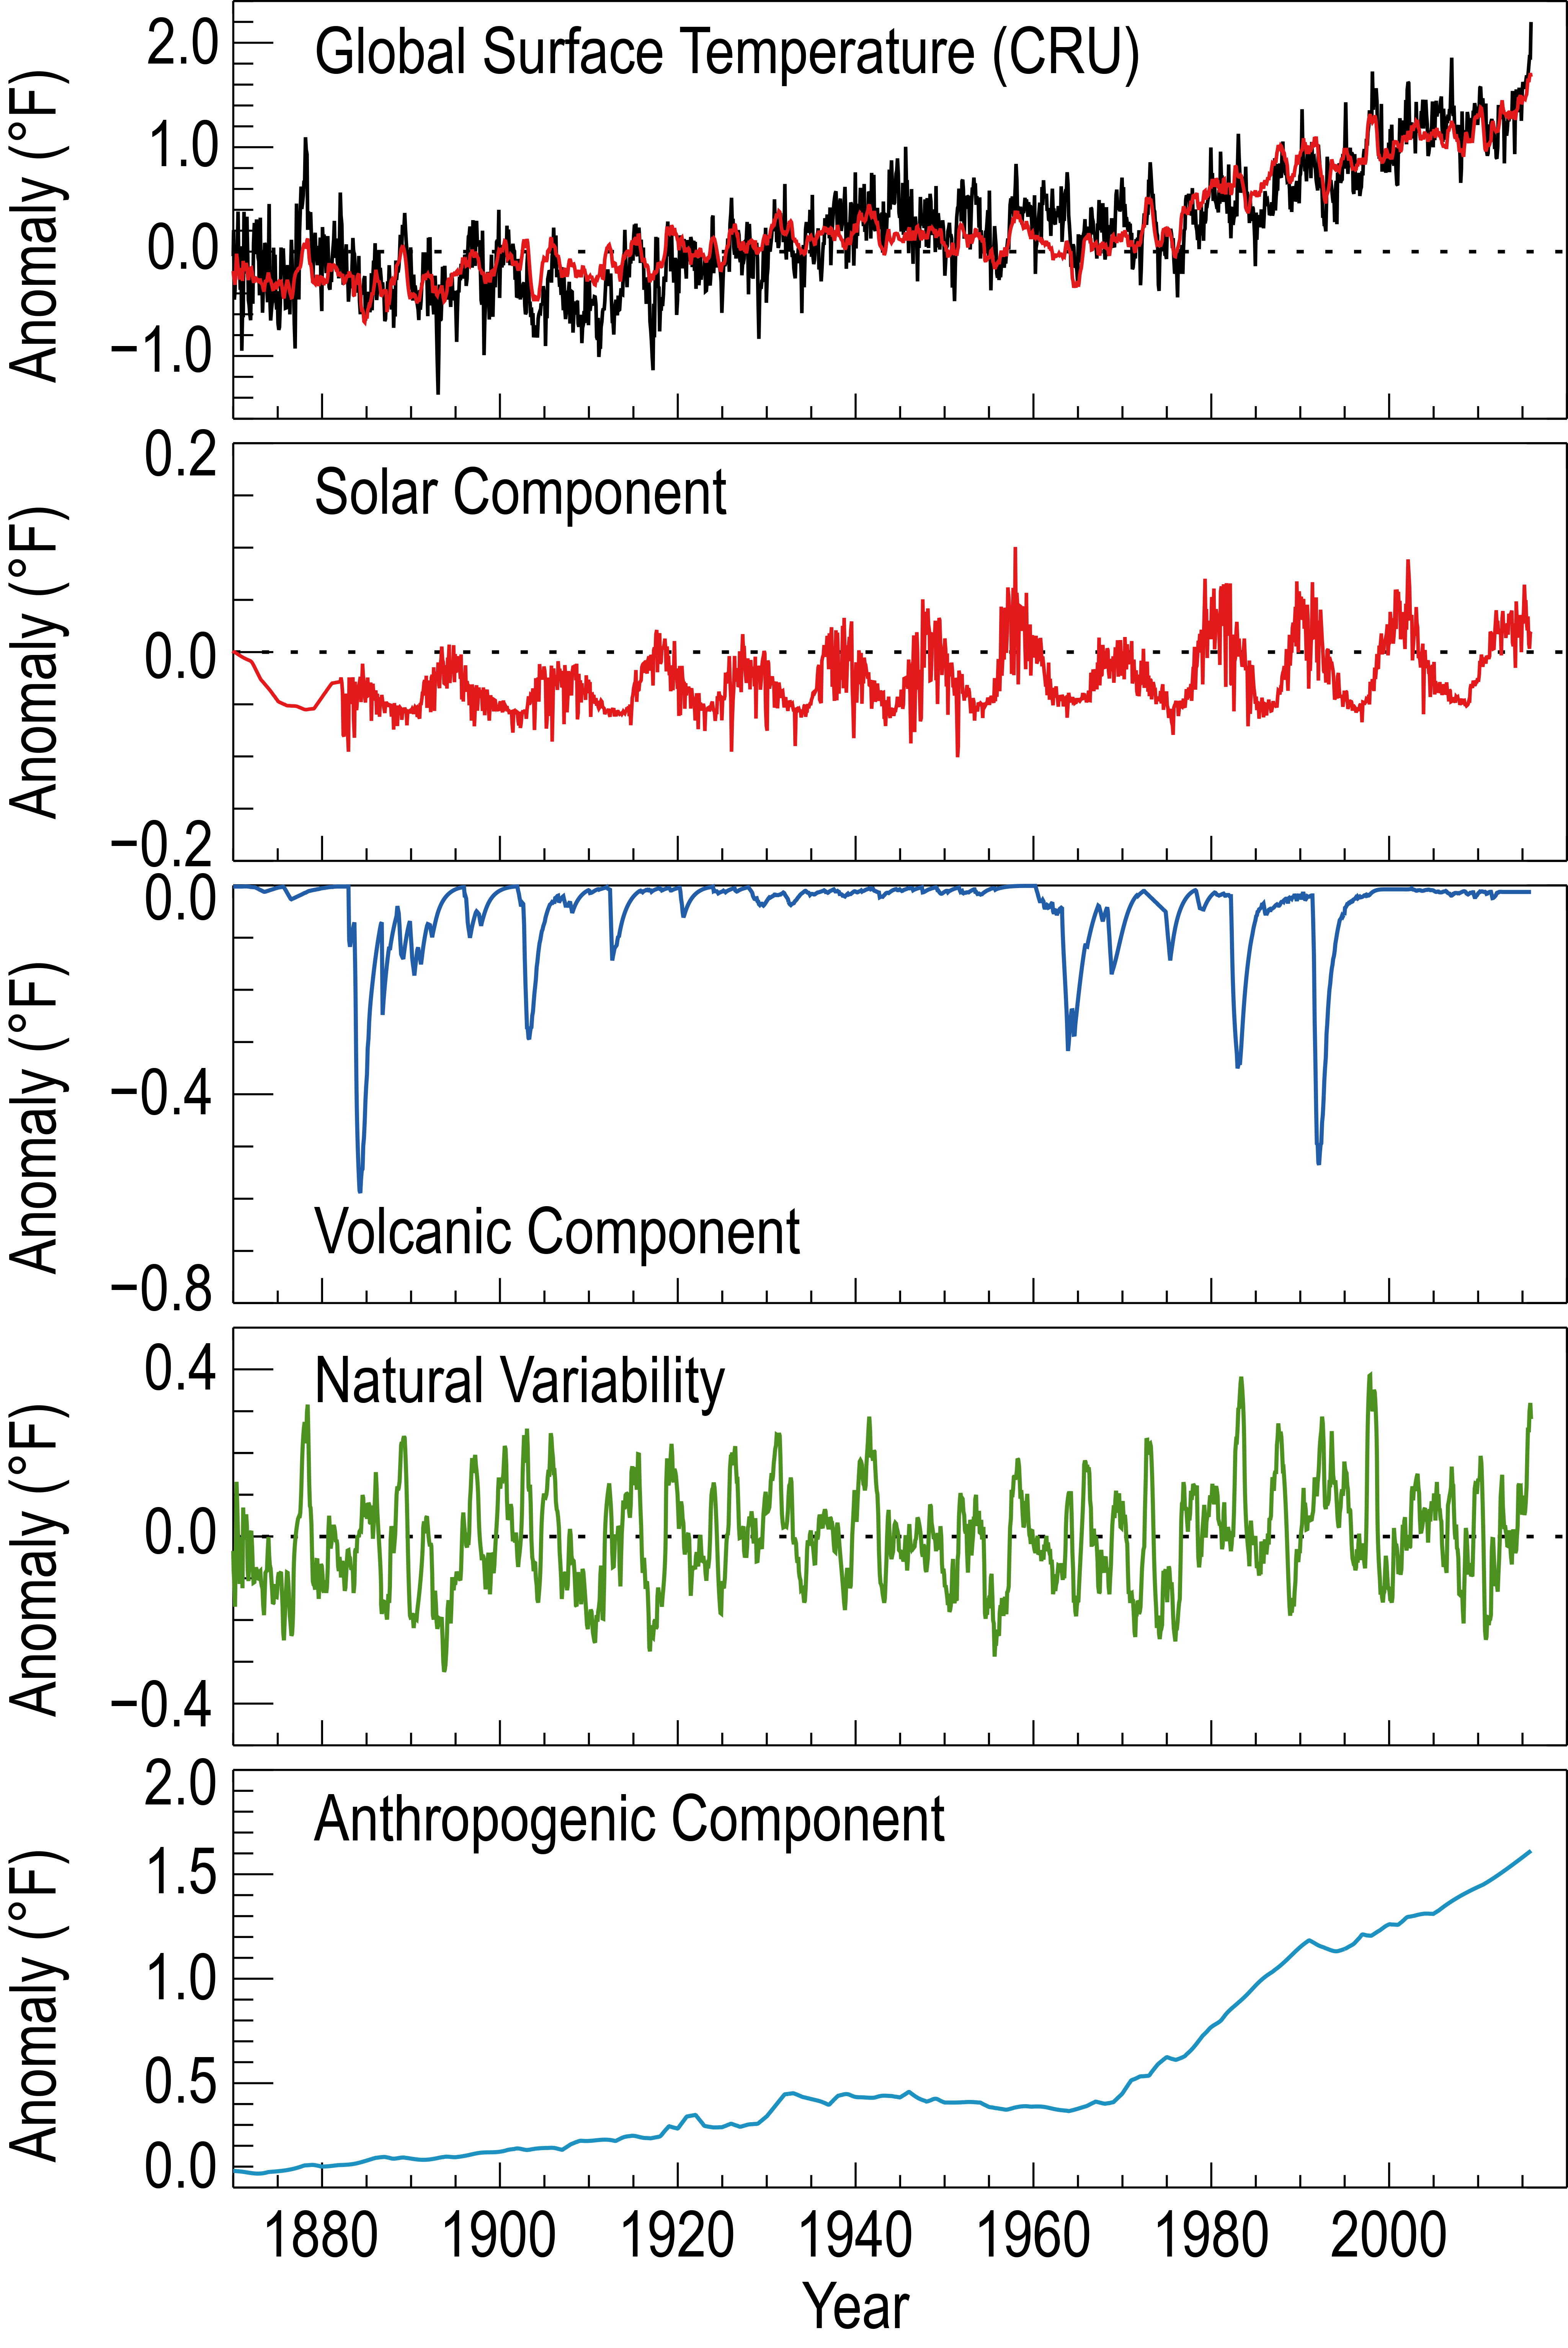
English: Graph showing global warming attribution - based on NCA4 (2017) Fig 3.3. Modeled forcing responses of forces affecting global temperature (1870 - ~2017).
Uploader took separate charts, changed them in Photoshop to a common vertical (temperature anomaly) scale, and merged them into this composite graphic. Source of charts from which the above composite chart was formed:
|
| Date | |
| Source | Own work |
| Author | RCraig09 |
| Other versions |
|


Related file(s)
-
 Global Temperature And Forces.svg — This image by Efbrazil consolidates natural drivers into a single trace.

Licensing
- You are free:
- to share – to copy, distribute and transmit the work
- to remix – to adapt the work
- Under the following conditions:
- attribution – You must give appropriate credit, provide a link to the license, and indicate if changes were made. You may do so in any reasonable manner, but not in any way that suggests the licensor endorses you or your use.
- share alike – If you remix, transform, or build upon the material, you must distribute your contributions under the same or compatible license as the original.
File history
Click on a date/time to view the file as it appeared at that time.
| Date/Time | Thumbnail | Dimensions | User | Comment | |
|---|---|---|---|---|---|
| current | 05:40, 15 January 2022 |
| 1,000 × 750 (251 KB) | RCraig09 | Uploaded own work with UploadWizard |
File usage
- Causes of climate change
- Climate change
- Climate change denial
- District of Columbia v. Exxon Mobil Corp.
- Scientific consensus on climate change
- Talk:Climate change
- Talk:History of climate change science
- Talk:Scientific consensus on climate change/Archive 25
- User talk:InformationToKnowledge/sandbox
- Portal:Climate change
Global file usage
The following other wikis use this file:
- Usage on el.wikipedia.org
- Usage on eu.wikipedia.org
- Usage on he.wikipedia.org
- Usage on tr.wikipedia.org
- Usage on zh.wikipedia.org
Metadata
Original file (SVG file, nominally 1,000 × 750 pixels, file size: 251 KB)
| This is a file from the
Wikimedia Commons. Information from its
description page there is shown below. Commons is a freely licensed media file repository. You can help. |
Summary
| Description |
English: Graph showing global warming attribution - based on NCA4 (2017) Fig 3.3. Modeled forcing responses of forces affecting global temperature (1870 - ~2017).
Uploader took separate charts, changed them in Photoshop to a common vertical (temperature anomaly) scale, and merged them into this composite graphic. Source of charts from which the above composite chart was formed:
|
| Date | |
| Source | Own work |
| Author | RCraig09 |
| Other versions |
|
Related file(s)
-
Global Temperature And Forces.svg — This image by Efbrazil consolidates natural drivers into a single trace.
Licensing
- You are free:
- to share – to copy, distribute and transmit the work
- to remix – to adapt the work
- Under the following conditions:
- attribution – You must give appropriate credit, provide a link to the license, and indicate if changes were made. You may do so in any reasonable manner, but not in any way that suggests the licensor endorses you or your use.
- share alike – If you remix, transform, or build upon the material, you must distribute your contributions under the same or compatible license as the original.
File history
Click on a date/time to view the file as it appeared at that time.
| Date/Time | Thumbnail | Dimensions | User | Comment | |
|---|---|---|---|---|---|
| current | 05:40, 15 January 2022 |
| 1,000 × 750 (251 KB) | RCraig09 | Uploaded own work with UploadWizard |
File usage
- Causes of climate change
- Climate change
- Climate change denial
- District of Columbia v. Exxon Mobil Corp.
- Scientific consensus on climate change
- Talk:Climate change
- Talk:History of climate change science
- Talk:Scientific consensus on climate change/Archive 25
- User talk:InformationToKnowledge/sandbox
- Portal:Climate change
Global file usage
The following other wikis use this file:
- Usage on el.wikipedia.org
- Usage on eu.wikipedia.org
- Usage on he.wikipedia.org
- Usage on tr.wikipedia.org
- Usage on zh.wikipedia.org