
Original file (3,193 × 4,500 pixels, file size: 260 KB, MIME type: image/png)
| This is a file from the
Wikimedia Commons. Information from its
description page there is shown below. Commons is a freely licensed media file repository. You can help. |
Summary
| Description |
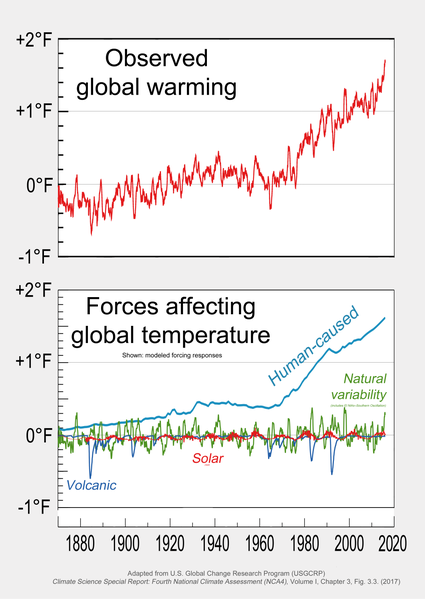
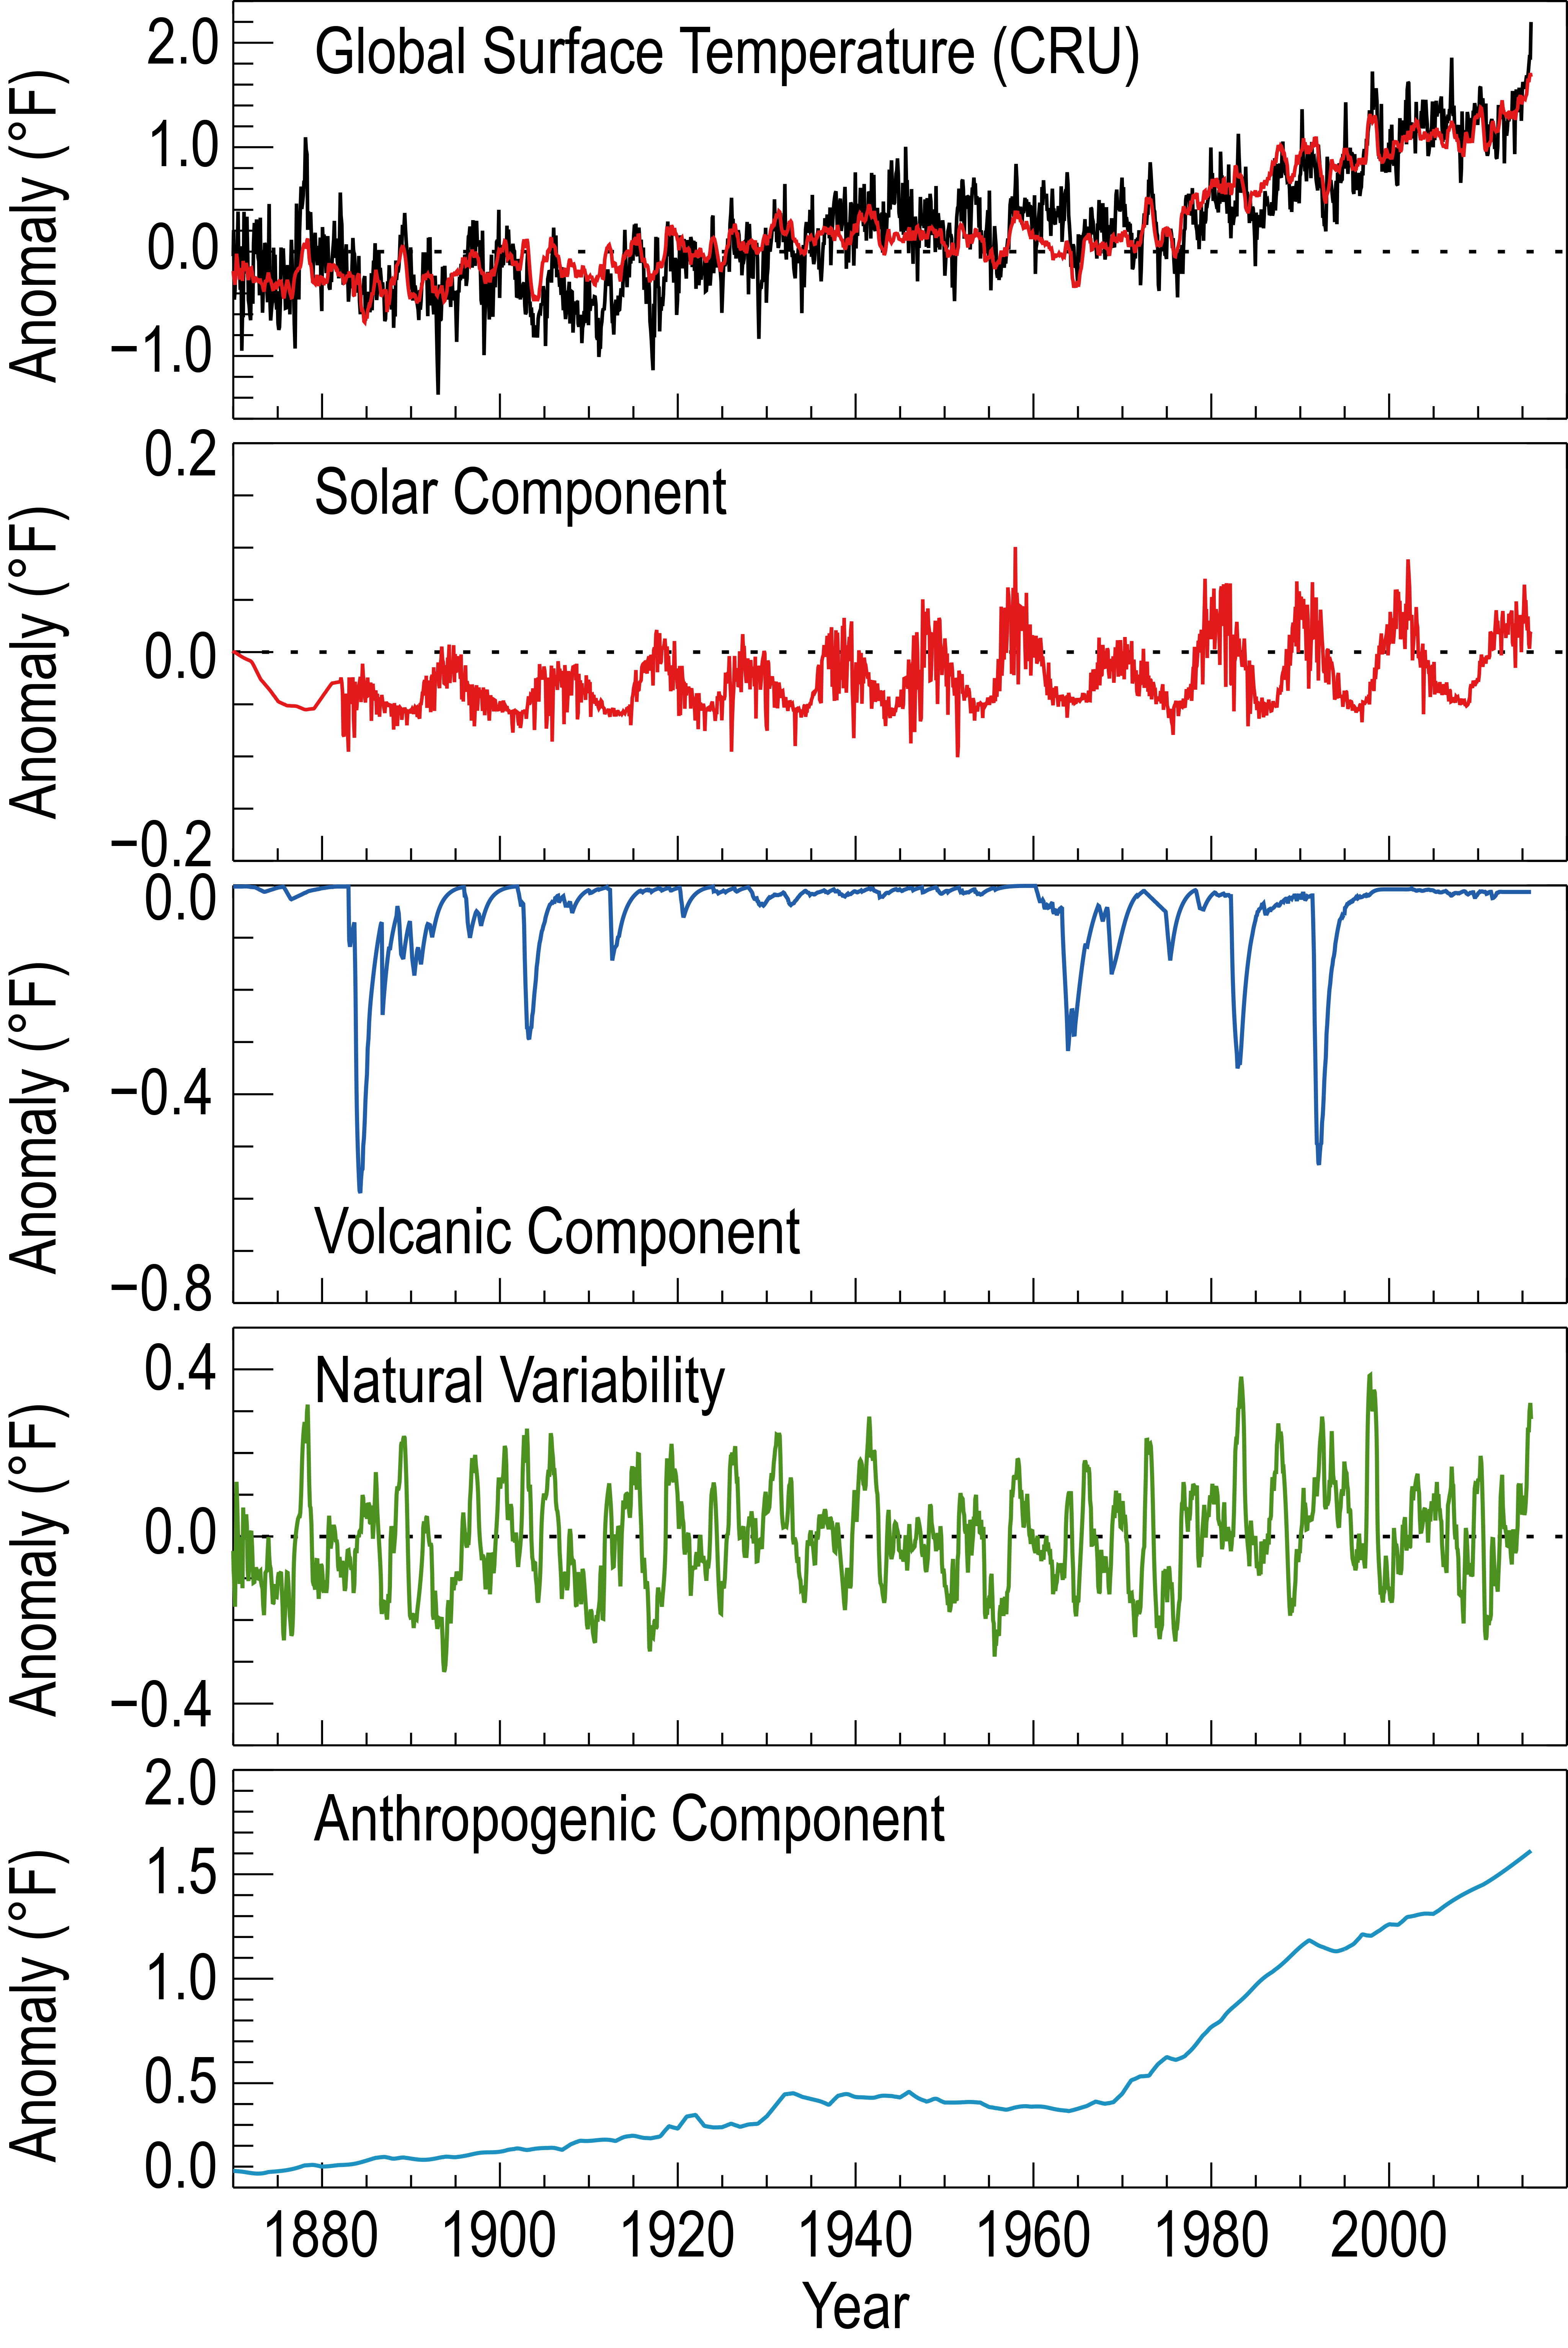
English: Graph showing global warming attribution - based on NCA4 (2017) Fig 3.3. Modeled forcing responses of forces affecting global temperature (1870 - ~2017).
Uploader took separate charts, changed them in Photoshop to a common vertical (temperature anomaly) scale, and merged them into this composite graphic. Source of charts from which the above composite chart was formed:
|
| Date | |
| Source | Own work |
| Author | RCraig09 |
| Other versions |
|
![2017 Global warming attribution - based on NCA4 Fig 3.3 - single-panel version — — — — — Uploaded 13 Feb 2020. Combines the two charts above into a single chart to reduce space and to avoid redundancy in the Global warming article]]](https://commons.wikimedia.org/wiki/File:2017_Global_warming_attribution_-_based_on_NCA4_Fig_3.3_-_single-panel_version.png)

Related files
-
 Global Temperature And Forces — This image by Efbrazil consolidates natural drivers into a single trace.
 -
 2017 Global warming attribution - based on NCA4 Fig 3.3 - single-panel version.svg
SVG successor (2022-01-15)


Licensing
Uploader licenses this chart under CC-by-SA-4.0.
- You are free:
- to share – to copy, distribute and transmit the work
- to remix – to adapt the work
- Under the following conditions:
- attribution – You must give appropriate credit, provide a link to the license, and indicate if changes were made. You may do so in any reasonable manner, but not in any way that suggests the licensor endorses you or your use.
- share alike – If you remix, transform, or build upon the material, you must distribute your contributions under the same or compatible license as the original.
The graphed data from which the chart is derived, is a product of the U.S. government (National Climate Assessment, NCA) and is in the public domain.
This work is in the
public domain in the United States because it is a
work prepared by an officer or employee of the United States Government as part of that person’s official duties under the terms of
Title 17, Chapter 1, Section 105 of the
US Code.
Note: This only applies to original works of the Federal Government and not to the work of any individual
U.S. state,
territory, commonwealth, county, municipality, or any other subdivision. This template also does not apply to postage stamp designs published by the
United States Postal Service
since 1978. (See §
313.6(C)(1) of Compendium of U.S. Copyright Office Practices). It also does not apply to certain US coins; see
The US Mint Terms of Use.
|
 | |
| This file has been identified as being free of known restrictions under copyright law, including all related and neighboring rights. | ||
The NCA in turn credits the above Atmospheric Chemistry and Physics article which states "This work is distributed under the Creative Commons Attribution 3.0 License."
- You are free:
- to share – to copy, distribute and transmit the work
- to remix – to adapt the work
- Under the following conditions:
- attribution – You must give appropriate credit, provide a link to the license, and indicate if changes were made. You may do so in any reasonable manner, but not in any way that suggests the licensor endorses you or your use.
- share alike – If you remix, transform, or build upon the material, you must distribute your contributions under the same or compatible license as the original.
File history
Click on a date/time to view the file as it appeared at that time.
| Date/Time | Thumbnail | Dimensions | User | Comment | |
|---|---|---|---|---|---|
| current | 03:58, 15 April 2021 |
| 3,193 × 4,500 (260 KB) | RCraig09 | Version 3: reduced file size at tinypng.com |
| 04:45, 14 October 2019 |
 | 3,193 × 4,500 (621 KB) | RCraig09 | Minor formal changes to legends (removing colors within parentheses, except for red for Solar forcing), and sourcing legend at bottom. | |
| 17:20, 12 October 2019 |
 | 3,193 × 4,500 (626 KB) | RCraig09 | User created page with UploadWizard |
File usage
Global file usage
The following other wikis use this file:
- Usage on ar.wikipedia.org
- Usage on cs.wikipedia.org
- Usage on fr.wikipedia.org
- Usage on it.wikipedia.org
- Usage on zh.wikipedia.org
Original file (3,193 × 4,500 pixels, file size: 260 KB, MIME type: image/png)
| This is a file from the
Wikimedia Commons. Information from its
description page there is shown below. Commons is a freely licensed media file repository. You can help. |
Summary
| Description |
English: Graph showing global warming attribution - based on NCA4 (2017) Fig 3.3. Modeled forcing responses of forces affecting global temperature (1870 - ~2017).
Uploader took separate charts, changed them in Photoshop to a common vertical (temperature anomaly) scale, and merged them into this composite graphic. Source of charts from which the above composite chart was formed:
|
| Date | |
| Source | Own work |
| Author | RCraig09 |
| Other versions |
|
Related files
-
Global Temperature And Forces — This image by Efbrazil consolidates natural drivers into a single trace.
-
2017 Global warming attribution - based on NCA4 Fig 3.3 - single-panel version.svg
SVG successor (2022-01-15)
Licensing
Uploader licenses this chart under CC-by-SA-4.0.
- You are free:
- to share – to copy, distribute and transmit the work
- to remix – to adapt the work
- Under the following conditions:
- attribution – You must give appropriate credit, provide a link to the license, and indicate if changes were made. You may do so in any reasonable manner, but not in any way that suggests the licensor endorses you or your use.
- share alike – If you remix, transform, or build upon the material, you must distribute your contributions under the same or compatible license as the original.
The graphed data from which the chart is derived, is a product of the U.S. government (National Climate Assessment, NCA) and is in the public domain.
This work is in the
public domain in the United States because it is a
work prepared by an officer or employee of the United States Government as part of that person’s official duties under the terms of
Title 17, Chapter 1, Section 105 of the
US Code.
Note: This only applies to original works of the Federal Government and not to the work of any individual
U.S. state,
territory, commonwealth, county, municipality, or any other subdivision. This template also does not apply to postage stamp designs published by the
United States Postal Service
since 1978. (See §
313.6(C)(1) of Compendium of U.S. Copyright Office Practices). It also does not apply to certain US coins; see
The US Mint Terms of Use.
|
| |
| This file has been identified as being free of known restrictions under copyright law, including all related and neighboring rights. | ||
The NCA in turn credits the above Atmospheric Chemistry and Physics article which states "This work is distributed under the Creative Commons Attribution 3.0 License."
- You are free:
- to share – to copy, distribute and transmit the work
- to remix – to adapt the work
- Under the following conditions:
- attribution – You must give appropriate credit, provide a link to the license, and indicate if changes were made. You may do so in any reasonable manner, but not in any way that suggests the licensor endorses you or your use.
- share alike – If you remix, transform, or build upon the material, you must distribute your contributions under the same or compatible license as the original.
File history
Click on a date/time to view the file as it appeared at that time.
| Date/Time | Thumbnail | Dimensions | User | Comment | |
|---|---|---|---|---|---|
| current | 03:58, 15 April 2021 |
| 3,193 × 4,500 (260 KB) | RCraig09 | Version 3: reduced file size at tinypng.com |
| 04:45, 14 October 2019 |
| 3,193 × 4,500 (621 KB) | RCraig09 | Minor formal changes to legends (removing colors within parentheses, except for red for Solar forcing), and sourcing legend at bottom. | |
| 17:20, 12 October 2019 |
| 3,193 × 4,500 (626 KB) | RCraig09 | User created page with UploadWizard |
File usage
Global file usage
The following other wikis use this file:
- Usage on ar.wikipedia.org
- Usage on cs.wikipedia.org
- Usage on fr.wikipedia.org
- Usage on it.wikipedia.org
- Usage on zh.wikipedia.org