No higher resolution available.
Y-factor_sketch.jpg (320 × 240 pixels, file size: 29 KB, MIME type: image/jpeg)
| This is a file from the
Wikimedia Commons. Information from its
description page there is shown below. Commons is a freely licensed media file repository. You can help. |


Summary
| Description |
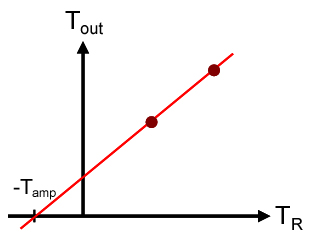
English: Sketch of a typical plot used in the Y-factor method for determining the gain and noise temperature of an amplifier. By D.F. Santavicca. |
| Date | 2 September 2011 (original upload date) |
| Source | Transferred from en.wikipedia to Commons. |
| Author | Tls60 at English Wikipedia |
Licensing
Tls60 at
English Wikipedia, the copyright holder of this work, hereby publishes it under the following license:
This file is licensed under the
Creative Commons
Attribution 3.0 Unported license.
Attribution:
Tls60 at
English Wikipedia
- You are free:
- to share – to copy, distribute and transmit the work
- to remix – to adapt the work
- Under the following conditions:
- attribution – You must give appropriate credit, provide a link to the license, and indicate if changes were made. You may do so in any reasonable manner, but not in any way that suggests the licensor endorses you or your use.
Original upload log
The original description page was
here. All following user names refer to en.wikipedia.
| Date/Time | Dimensions | User | Comment |
|---|---|---|---|
| 2011-09-02 19:13 | 320×240× (29483 bytes) | Tls60 | Sketch of a typical plot used in the Y-factor method for determining the gain and noise temperature of an amplifier. By D.F. Santavicca. |
File history
Click on a date/time to view the file as it appeared at that time.
| Date/Time | Thumbnail | Dimensions | User | Comment | |
|---|---|---|---|---|---|
| current | 20:13, 17 November 2014 |
| 320 × 240 (29 KB) | Arthunter | Transferred from en.wikipedia |
File usage
The following pages on the English Wikipedia use this file (pages on other projects are not listed):
Global file usage
The following other wikis use this file:
- Usage on ar.wikipedia.org
Metadata
No higher resolution available.
Y-factor_sketch.jpg (320 × 240 pixels, file size: 29 KB, MIME type: image/jpeg)
| This is a file from the
Wikimedia Commons. Information from its
description page there is shown below. Commons is a freely licensed media file repository. You can help. |
Summary
| Description |
English: Sketch of a typical plot used in the Y-factor method for determining the gain and noise temperature of an amplifier. By D.F. Santavicca. |
| Date | 2 September 2011 (original upload date) |
| Source | Transferred from en.wikipedia to Commons. |
| Author | Tls60 at English Wikipedia |
Licensing
Tls60 at
English Wikipedia, the copyright holder of this work, hereby publishes it under the following license:
This file is licensed under the
Creative Commons
Attribution 3.0 Unported license.
Attribution:
Tls60 at
English Wikipedia
- You are free:
- to share – to copy, distribute and transmit the work
- to remix – to adapt the work
- Under the following conditions:
- attribution – You must give appropriate credit, provide a link to the license, and indicate if changes were made. You may do so in any reasonable manner, but not in any way that suggests the licensor endorses you or your use.
Original upload log
The original description page was
here. All following user names refer to en.wikipedia.
| Date/Time | Dimensions | User | Comment |
|---|---|---|---|
| 2011-09-02 19:13 | 320×240× (29483 bytes) | Tls60 | Sketch of a typical plot used in the Y-factor method for determining the gain and noise temperature of an amplifier. By D.F. Santavicca. |
File history
Click on a date/time to view the file as it appeared at that time.
| Date/Time | Thumbnail | Dimensions | User | Comment | |
|---|---|---|---|---|---|
| current | 20:13, 17 November 2014 |
| 320 × 240 (29 KB) | Arthunter | Transferred from en.wikipedia |
File usage
The following pages on the English Wikipedia use this file (pages on other projects are not listed):
Global file usage
The following other wikis use this file:
- Usage on ar.wikipedia.org