
Size of this preview:
800 × 557 pixels. Other resolutions:
320 × 223 pixels |
640 × 446 pixels |
1,024 × 713 pixels |
1,280 × 891 pixels |
2,560 × 1,782 pixels |
3,588 × 2,498 pixels.
Original file (3,588 × 2,498 pixels, file size: 653 KB, MIME type: image/png)
| This is a file from the
Wikimedia Commons. Information from its
description page there is shown below. Commons is a freely licensed media file repository. You can help. |
Summary
| Description |
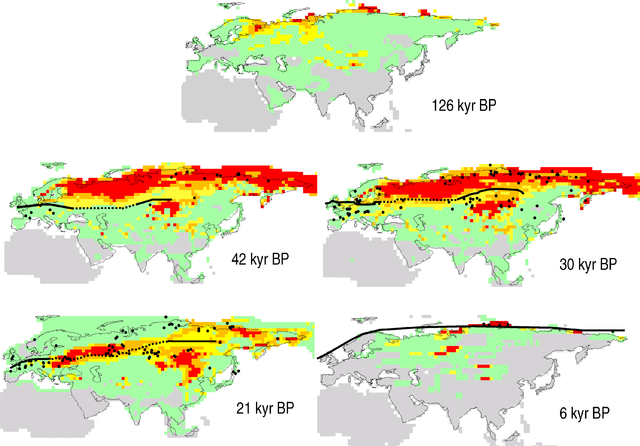
English: Climatic Suitability for the Woolly Mammoths in the Late Pleistocene and Holocene.
|
| Date | |
| Source | http://journals.plos.org/plosbiology/article?id=10.1371/journal.pbio.0060079 |
| Author | David Nogués-Bravo |
| Other versions | العربيَّة |
Licensing
|
This file is licensed under the
Creative Commons
Attribution 2.5 Generic license.
|
This file was published in a
Public Library of Science journal.
Their website
states that the content of all PLOS journals is published under the Creative Commons Attribution 4.0 license (or its previous version depending on the publication date), unless indicated otherwise.
|
File history
Click on a date/time to view the file as it appeared at that time.
| Date/Time | Thumbnail | Dimensions | User | Comment | |
|---|---|---|---|---|---|
| current | 06:00, 27 March 2016 |
| 3,588 × 2,498 (653 KB) | William Harris | User created page with UploadWizard |
File usage
The following pages on the English Wikipedia use this file (pages on other projects are not listed):
Global file usage
The following other wikis use this file:
- Usage on be.wikipedia.org
- Usage on es.wikipedia.org
- Usage on fi.wikipedia.org
- Usage on fr.wikipedia.org
- Usage on hu.wikipedia.org
- Usage on hy.wikipedia.org
- Usage on ru.wikipedia.org
Metadata
Size of this preview:
800 × 557 pixels. Other resolutions:
320 × 223 pixels |
640 × 446 pixels |
1,024 × 713 pixels |
1,280 × 891 pixels |
2,560 × 1,782 pixels |
3,588 × 2,498 pixels.
Original file (3,588 × 2,498 pixels, file size: 653 KB, MIME type: image/png)
| This is a file from the
Wikimedia Commons. Information from its
description page there is shown below. Commons is a freely licensed media file repository. You can help. |
Summary
| Description |
English: Climatic Suitability for the Woolly Mammoths in the Late Pleistocene and Holocene.
|
| Date | |
| Source | http://journals.plos.org/plosbiology/article?id=10.1371/journal.pbio.0060079 |
| Author | David Nogués-Bravo |
| Other versions | العربيَّة |
Licensing
|
This file is licensed under the
Creative Commons
Attribution 2.5 Generic license.
|
This file was published in a
Public Library of Science journal.
Their website
states that the content of all PLOS journals is published under the Creative Commons Attribution 4.0 license (or its previous version depending on the publication date), unless indicated otherwise.
|
File history
Click on a date/time to view the file as it appeared at that time.
| Date/Time | Thumbnail | Dimensions | User | Comment | |
|---|---|---|---|---|---|
| current | 06:00, 27 March 2016 |
| 3,588 × 2,498 (653 KB) | William Harris | User created page with UploadWizard |
File usage
The following pages on the English Wikipedia use this file (pages on other projects are not listed):
Global file usage
The following other wikis use this file:
- Usage on be.wikipedia.org
- Usage on es.wikipedia.org
- Usage on fi.wikipedia.org
- Usage on fr.wikipedia.org
- Usage on hu.wikipedia.org
- Usage on hy.wikipedia.org
- Usage on ru.wikipedia.org