
Original file (3,101 × 3,073 pixels, file size: 241 KB, MIME type: image/png)
Summary
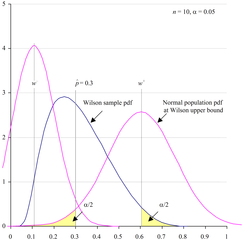
Wallis, Sean. Original image by author, method in https://corplingstats.wordpress.com/2018/09/25/plotting-the-wilson-distribution, also published in Wallis (2021: 297-313).
Example probability density function (pdf) for Wilson score distribution, and Normal pdfs at interval bounds (observed proportion = 0.3, sample size n = 10, two-tailed error level alpha = 0.05). Demonstrates the equality of tail areas (highlighted), termed the 'interval equality principle' (Wallis 2021). [1]
Licensing
|
| This work is licensed under the Creative Commons Attribution-ShareAlike 4.0 License. |
- ^ Wallis, S.A. 2021. Statistics in Corpus Linguistics, New York: Routledge.
File history
Click on a date/time to view the file as it appeared at that time.
| Date/Time | Thumbnail | Dimensions | User | Comment | |
|---|---|---|---|---|---|
| current | 08:51, 24 January 2021 |
| 3,101 × 3,073 (241 KB) | Sean a wallis ( talk | contribs) | Wallis, Sean. Original image by author, method in https://corplingstats.wordpress.com/2018/09/25/plotting-the-wilson-distribution, also published in Wallis (2021: 297-313). Example probability density function (pdf) for Wilson score distribution, and Normal pdfs at interval bounds (observed proportion = 0.3, sample size n = 10, two-tailed error level alpha = 0.05). Demonstrates the equality of tail areas (highlighted), termed the 'interval equality principle' (Wallis 2021). <ref>Wallis, S.A... |
You cannot overwrite this file.
File usage
Metadata
Original file (3,101 × 3,073 pixels, file size: 241 KB, MIME type: image/png)
Summary
Wallis, Sean. Original image by author, method in https://corplingstats.wordpress.com/2018/09/25/plotting-the-wilson-distribution, also published in Wallis (2021: 297-313).
Example probability density function (pdf) for Wilson score distribution, and Normal pdfs at interval bounds (observed proportion = 0.3, sample size n = 10, two-tailed error level alpha = 0.05). Demonstrates the equality of tail areas (highlighted), termed the 'interval equality principle' (Wallis 2021). [1]
Licensing
|
| This work is licensed under the Creative Commons Attribution-ShareAlike 4.0 License. |
- ^ Wallis, S.A. 2021. Statistics in Corpus Linguistics, New York: Routledge.
File history
Click on a date/time to view the file as it appeared at that time.
| Date/Time | Thumbnail | Dimensions | User | Comment | |
|---|---|---|---|---|---|
| current | 08:51, 24 January 2021 |
| 3,101 × 3,073 (241 KB) | Sean a wallis ( talk | contribs) | Wallis, Sean. Original image by author, method in https://corplingstats.wordpress.com/2018/09/25/plotting-the-wilson-distribution, also published in Wallis (2021: 297-313). Example probability density function (pdf) for Wilson score distribution, and Normal pdfs at interval bounds (observed proportion = 0.3, sample size n = 10, two-tailed error level alpha = 0.05). Demonstrates the equality of tail areas (highlighted), termed the 'interval equality principle' (Wallis 2021). <ref>Wallis, S.A... |
You cannot overwrite this file.