
Size of this preview:
800 × 410 pixels. Other resolutions:
320 × 164 pixels |
640 × 328 pixels |
1,024 × 525 pixels |
1,280 × 657 pixels |
2,000 × 1,026 pixels.
Original file (2,000 × 1,026 pixels, file size: 728 KB, MIME type: image/png)
| This is a file from the
Wikimedia Commons. Information from its
description page there is shown below. Commons is a freely licensed media file repository. You can help. |
Summary
| Description |
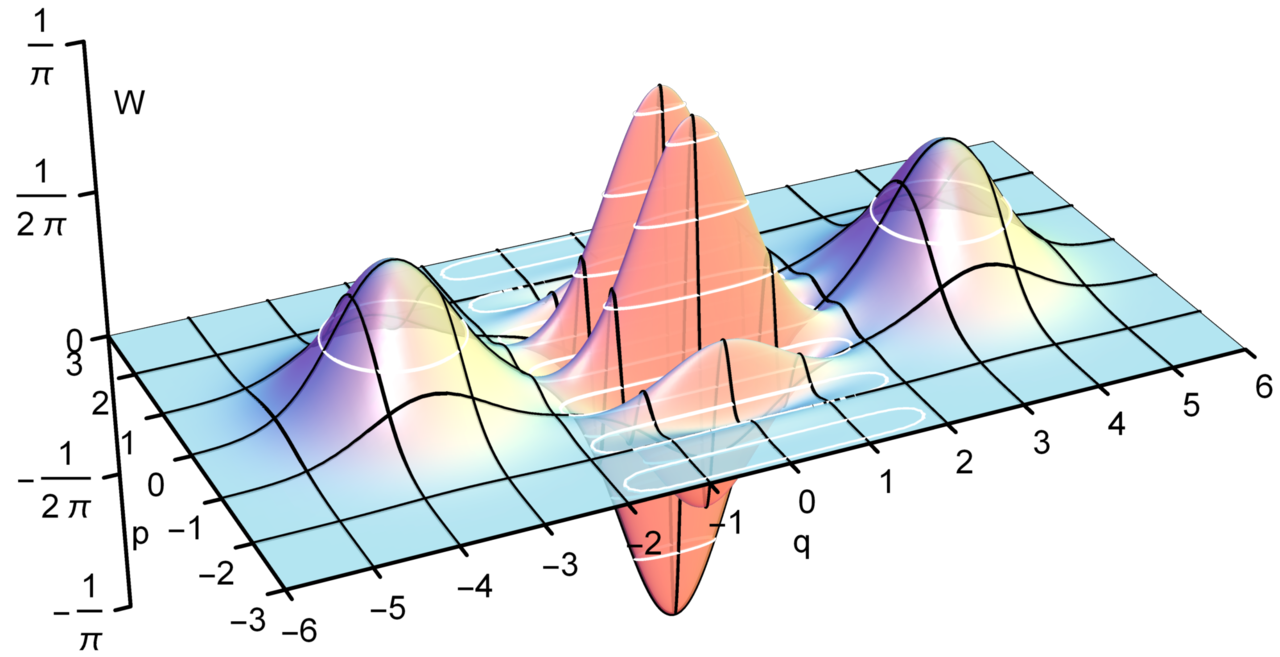
English: Wigner function of an odd cat state with amplitude α=2.5. |
| Date | |
| Source |
Own work This diagram was created with
Mathematica. |
| Author | Geek3 |
Source code
cat\Alpha_, \Theta_, q_, p_ :=
  1/(2 Pi)*1/(1 + Cos\Theta]]*Exp-2 \Alpha^2])*(
    Exp-p^2 - (q + Sqrt2 \Alpha])^2 +
     Exp-p^2 - (q - Sqrt2 \Alpha])^2 +
     2 Cos\Theta - 2 Sqrt2 \Alpha*p*Exp-q^2 - p^2]);
rq = 6; rp = 3; t = 0.003; FontS = 20;
For\Theta = 0, \Theta <= Pi, \Theta += Pi,
 For\Alpha = 1/2, \Alpha < 3, \Alpha += 1/2,
  plot = ShowPlot3Dcat\Alpha], \Theta], q, p],
     {q, -rq, rq}, {p, -rp, rp}, ImageSize -> 800,
     Mesh -> {Range-Floorrq], Floorrq ],
       Range-Floorrp], Floorrp ], Range-1, 1, 1/4/Pi},
     MeshFunctions -> {#1 &, #2 &, #3 &},
     MeshStyle -> {DirectiveBlack, Thicknesst ],
       DirectiveBlack, Thicknesst ],
       DirectiveWhite, Thicknesst ]},
     PlotRange -> {-1/Pi, 1/Pi}, PlotPoints -> 81, MaxRecursion -> 4,
     Method -> {Refinement -> {ControlValue -> 0.02} },
     PlotStyle -> Opacity0.85], Lighting -> "Classic",
     ColorFunction -> ({RGBColor1, 1, 0.75], GlowGrayLevel0.06 ],
         Specularity0.5, 60]} &),
     Axes -> False, Boxed -> False,
     ViewPoint ->
      FromSphericalCoordinates[{Sqrt229/20], Pi/3, -0.64 Pi}] ],
    Graphics3D[{Thickness -> t, Black,
      Line[{ {-rq, rp, 0}, {-rq, -rp, 0}, {rq, -rp, 0} }]}],
    Graphics3D[{Thickness -> t, Black,
      Line[{ {-rq, rp, -1/Pi}, {-rq, rp, 1/Pi} }]}],
    (* q ticks *)
    Sequence @@
     TableGraphics3D[{Thickness -> t, Black,
        Line[{ {x, -rp, 0}, {x, -0.2 - rp, 0} }]}], {x, -Floorrq],
       Floorrq]}],
    (* p ticks *)
    Sequence @@
     TableGraphics3D[{Thickness -> t, Black,
        Line[{ {-rq, y, 0}, {-rq - 0.2, y, 0} }]}], {y, -Floorrp],
       Floorrp]}],
    (*W ticks *)
    Sequence @@
     TableGraphics3D[{Thickness -> t, Black,
        Line[{ {-rq, rp, z/(2 Pi)}, {-rq - 0.2, rp,
           z/(2 Pi)} }]}], {z, -2, 2}],
    (* axes labels *)
    Graphics3DTextStyle"q", FontS, Black], {0, -rp*1.11, -0.07}] ],
    Graphics3DTextStyle"p", FontS, Black], {-rq*1.11, 0, -0.07}] ],
    Graphics3D
     TextStyle"W", FontS, Black], {-rq*0.93, rp*0.93, 0.8/Pi}] ],
    Sequence @@
     TableGraphics3D[{Text
         StyleTextStringx], FontS,
          Black], {x, -rp - 0.07 Maxrq, rp], -0.003}, {0,
          1}]}], {x, -Floorrq], Floorrq]}],
    Sequence @@
     TableGraphics3D[{Text
         StyleTextStringy], FontS, Black], {-rq - 0.07 Maxrq, rp],
          y, -0.003}, {0, 1}]}], {y, -Floorrp], Floorrp]}],
    Sequence @@
     TableGraphics3D[{Text
         StyleIfz == 0, "0", ToStringz/(2 Pi), TraditionalForm ],
          FontS, Black], {-rq - 0.3, rp, z/2/Pi}, {1, 0}]}], {z, -2,
       2}],
    BoxRatios -> {Automatic, Automatic, 8}, PlotRange -> All
    ];
  trim = { {0., .26}, {.97, .86} };
  imgname =
   "Wignerfunction_catstate_" <> If\Theta == 0, "even_", "odd_" <>
     TextString\Alpha]] <> ".png";
  Exportimgname,
   ImageResize
    ImageTrimImageplot, ImageResolution -> 400], trim,
     DataRange -> { {0, 1}, {0, 1} }], 2000, Resampling -> "Linear" ];
Licensing
I, the copyright holder of this work, hereby publish it under the following license:
This file is licensed under the
Creative Commons
Attribution-Share Alike 4.0 International license.
- You are free:
- to share – to copy, distribute and transmit the work
- to remix – to adapt the work
- Under the following conditions:
- attribution – You must give appropriate credit, provide a link to the license, and indicate if changes were made. You may do so in any reasonable manner, but not in any way that suggests the licensor endorses you or your use.
- share alike – If you remix, transform, or build upon the material, you must distribute your contributions under the same or compatible license as the original.
File history
Click on a date/time to view the file as it appeared at that time.
| Date/Time | Thumbnail | Dimensions | User | Comment | |
|---|---|---|---|---|---|
| current | 16:45, 20 May 2019 |
| 2,000 × 1,026 (728 KB) | Geek3 | User created page with UploadWizard |
File usage
The following pages on the English Wikipedia use this file (pages on other projects are not listed):
Global file usage
The following other wikis use this file:
- Usage on ca.wikipedia.org
Metadata
Size of this preview:
800 × 410 pixels. Other resolutions:
320 × 164 pixels |
640 × 328 pixels |
1,024 × 525 pixels |
1,280 × 657 pixels |
2,000 × 1,026 pixels.
Original file (2,000 × 1,026 pixels, file size: 728 KB, MIME type: image/png)
| This is a file from the
Wikimedia Commons. Information from its
description page there is shown below. Commons is a freely licensed media file repository. You can help. |
Summary
| Description |
English: Wigner function of an odd cat state with amplitude α=2.5. |
| Date | |
| Source |
Own work This diagram was created with
Mathematica. |
| Author | Geek3 |
Source code
cat\Alpha_, \Theta_, q_, p_ :=
  1/(2 Pi)*1/(1 + Cos\Theta]]*Exp-2 \Alpha^2])*(
    Exp-p^2 - (q + Sqrt2 \Alpha])^2 +
     Exp-p^2 - (q - Sqrt2 \Alpha])^2 +
     2 Cos\Theta - 2 Sqrt2 \Alpha*p*Exp-q^2 - p^2]);
rq = 6; rp = 3; t = 0.003; FontS = 20;
For\Theta = 0, \Theta <= Pi, \Theta += Pi,
 For\Alpha = 1/2, \Alpha < 3, \Alpha += 1/2,
  plot = ShowPlot3Dcat\Alpha], \Theta], q, p],
     {q, -rq, rq}, {p, -rp, rp}, ImageSize -> 800,
     Mesh -> {Range-Floorrq], Floorrq ],
       Range-Floorrp], Floorrp ], Range-1, 1, 1/4/Pi},
     MeshFunctions -> {#1 &, #2 &, #3 &},
     MeshStyle -> {DirectiveBlack, Thicknesst ],
       DirectiveBlack, Thicknesst ],
       DirectiveWhite, Thicknesst ]},
     PlotRange -> {-1/Pi, 1/Pi}, PlotPoints -> 81, MaxRecursion -> 4,
     Method -> {Refinement -> {ControlValue -> 0.02} },
     PlotStyle -> Opacity0.85], Lighting -> "Classic",
     ColorFunction -> ({RGBColor1, 1, 0.75], GlowGrayLevel0.06 ],
         Specularity0.5, 60]} &),
     Axes -> False, Boxed -> False,
     ViewPoint ->
      FromSphericalCoordinates[{Sqrt229/20], Pi/3, -0.64 Pi}] ],
    Graphics3D[{Thickness -> t, Black,
      Line[{ {-rq, rp, 0}, {-rq, -rp, 0}, {rq, -rp, 0} }]}],
    Graphics3D[{Thickness -> t, Black,
      Line[{ {-rq, rp, -1/Pi}, {-rq, rp, 1/Pi} }]}],
    (* q ticks *)
    Sequence @@
     TableGraphics3D[{Thickness -> t, Black,
        Line[{ {x, -rp, 0}, {x, -0.2 - rp, 0} }]}], {x, -Floorrq],
       Floorrq]}],
    (* p ticks *)
    Sequence @@
     TableGraphics3D[{Thickness -> t, Black,
        Line[{ {-rq, y, 0}, {-rq - 0.2, y, 0} }]}], {y, -Floorrp],
       Floorrp]}],
    (*W ticks *)
    Sequence @@
     TableGraphics3D[{Thickness -> t, Black,
        Line[{ {-rq, rp, z/(2 Pi)}, {-rq - 0.2, rp,
           z/(2 Pi)} }]}], {z, -2, 2}],
    (* axes labels *)
    Graphics3DTextStyle"q", FontS, Black], {0, -rp*1.11, -0.07}] ],
    Graphics3DTextStyle"p", FontS, Black], {-rq*1.11, 0, -0.07}] ],
    Graphics3D
     TextStyle"W", FontS, Black], {-rq*0.93, rp*0.93, 0.8/Pi}] ],
    Sequence @@
     TableGraphics3D[{Text
         StyleTextStringx], FontS,
          Black], {x, -rp - 0.07 Maxrq, rp], -0.003}, {0,
          1}]}], {x, -Floorrq], Floorrq]}],
    Sequence @@
     TableGraphics3D[{Text
         StyleTextStringy], FontS, Black], {-rq - 0.07 Maxrq, rp],
          y, -0.003}, {0, 1}]}], {y, -Floorrp], Floorrp]}],
    Sequence @@
     TableGraphics3D[{Text
         StyleIfz == 0, "0", ToStringz/(2 Pi), TraditionalForm ],
          FontS, Black], {-rq - 0.3, rp, z/2/Pi}, {1, 0}]}], {z, -2,
       2}],
    BoxRatios -> {Automatic, Automatic, 8}, PlotRange -> All
    ];
  trim = { {0., .26}, {.97, .86} };
  imgname =
   "Wignerfunction_catstate_" <> If\Theta == 0, "even_", "odd_" <>
     TextString\Alpha]] <> ".png";
  Exportimgname,
   ImageResize
    ImageTrimImageplot, ImageResolution -> 400], trim,
     DataRange -> { {0, 1}, {0, 1} }], 2000, Resampling -> "Linear" ];
Licensing
I, the copyright holder of this work, hereby publish it under the following license:
This file is licensed under the
Creative Commons
Attribution-Share Alike 4.0 International license.
- You are free:
- to share – to copy, distribute and transmit the work
- to remix – to adapt the work
- Under the following conditions:
- attribution – You must give appropriate credit, provide a link to the license, and indicate if changes were made. You may do so in any reasonable manner, but not in any way that suggests the licensor endorses you or your use.
- share alike – If you remix, transform, or build upon the material, you must distribute your contributions under the same or compatible license as the original.
File history
Click on a date/time to view the file as it appeared at that time.
| Date/Time | Thumbnail | Dimensions | User | Comment | |
|---|---|---|---|---|---|
| current | 16:45, 20 May 2019 |
| 2,000 × 1,026 (728 KB) | Geek3 | User created page with UploadWizard |
File usage
The following pages on the English Wikipedia use this file (pages on other projects are not listed):
Global file usage
The following other wikis use this file:
- Usage on ca.wikipedia.org