
Size of this preview:
800 × 364 pixels. Other resolutions:
320 × 146 pixels |
640 × 291 pixels |
1,024 × 466 pixels |
2,150 × 978 pixels.
Original file (2,150 × 978 pixels, file size: 515 KB, MIME type: image/png)
| This is a file from the
Wikimedia Commons. Information from its
description page there is shown below. Commons is a freely licensed media file repository. You can help. |
Summary
| Description |
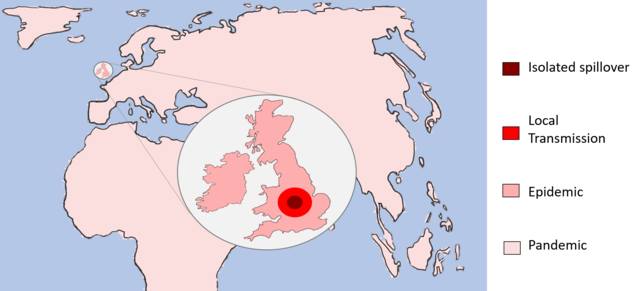
English: This image shows the potential growth in spread and reach of a pathogen during a host switch. This includes the site of the single isolated infection, the local spillover, sustained transmission in and epidemic and ending with possible pandemic potential. |
| Date | |
| Source | Inkscape and Microsoft powerpoint |
| Author | ESnook |
Licensing
I, the copyright holder of this work, hereby publish it under the following licenses:

|
Permission is granted to copy, distribute and/or modify this document under the terms of the GNU Free Documentation License, Version 1.2 or any later version published by the Free Software Foundation; with no Invariant Sections, no Front-Cover Texts, and no Back-Cover Texts. A copy of the license is included in the section entitled GNU Free Documentation License. |
This file is licensed under the
Creative Commons
Attribution-Share Alike 4.0 International license.
- You are free:
- to share – to copy, distribute and transmit the work
- to remix – to adapt the work
- Under the following conditions:
- attribution – You must give appropriate credit, provide a link to the license, and indicate if changes were made. You may do so in any reasonable manner, but not in any way that suggests the licensor endorses you or your use.
- share alike – If you remix, transform, or build upon the material, you must distribute your contributions under the same or compatible license as the original.
You may select the license of your choice.

|
This media file is uncategorized.
Please help improve this media file by adding it to one or more categories, so it may be associated with related media files (
how?), and so that it can be more easily found.
Please notify the uploader with {{subst:Please link images|File:Stages of infection from a pathogen host switch.png}} ~~~~ |
File history
Click on a date/time to view the file as it appeared at that time.
| Date/Time | Thumbnail | Dimensions | User | Comment | |
|---|---|---|---|---|---|
| current | 09:04, 17 April 2020 |
| 2,150 × 978 (515 KB) | ESnook | This image now has a colour-coordinated key describing the stages shown on the diagram |
| 16:09, 16 April 2020 |
 | 1,556 × 936 (409 KB) | ESnook | {{subst:Upload marker added by en.wp UW}} {{Information |Description = {{en|This image shows the potential growth in spread and reach of a pathogen during a host switch. This includes the site of the single isolated infection, the local spillover, sustained transmission in and epidemic and ending with possible pandemic potential. }} |Source = Inkscape and Microsoft powerpoint |Date = 2020-04-10 |Author = ESnook }} |
File usage
The following pages on the English Wikipedia use this file (pages on other projects are not listed):
Metadata
Size of this preview:
800 × 364 pixels. Other resolutions:
320 × 146 pixels |
640 × 291 pixels |
1,024 × 466 pixels |
2,150 × 978 pixels.
Original file (2,150 × 978 pixels, file size: 515 KB, MIME type: image/png)
| This is a file from the
Wikimedia Commons. Information from its
description page there is shown below. Commons is a freely licensed media file repository. You can help. |
Summary
| Description |
English: This image shows the potential growth in spread and reach of a pathogen during a host switch. This includes the site of the single isolated infection, the local spillover, sustained transmission in and epidemic and ending with possible pandemic potential. |
| Date | |
| Source | Inkscape and Microsoft powerpoint |
| Author | ESnook |
Licensing
I, the copyright holder of this work, hereby publish it under the following licenses:
|
|
Permission is granted to copy, distribute and/or modify this document under the terms of the GNU Free Documentation License, Version 1.2 or any later version published by the Free Software Foundation; with no Invariant Sections, no Front-Cover Texts, and no Back-Cover Texts. A copy of the license is included in the section entitled GNU Free Documentation License. |
This file is licensed under the
Creative Commons
Attribution-Share Alike 4.0 International license.
- You are free:
- to share – to copy, distribute and transmit the work
- to remix – to adapt the work
- Under the following conditions:
- attribution – You must give appropriate credit, provide a link to the license, and indicate if changes were made. You may do so in any reasonable manner, but not in any way that suggests the licensor endorses you or your use.
- share alike – If you remix, transform, or build upon the material, you must distribute your contributions under the same or compatible license as the original.
You may select the license of your choice.
|
|
This media file is uncategorized.
Please help improve this media file by adding it to one or more categories, so it may be associated with related media files (
how?), and so that it can be more easily found.
Please notify the uploader with {{subst:Please link images|File:Stages of infection from a pathogen host switch.png}} ~~~~ |
File history
Click on a date/time to view the file as it appeared at that time.
| Date/Time | Thumbnail | Dimensions | User | Comment | |
|---|---|---|---|---|---|
| current | 09:04, 17 April 2020 |
| 2,150 × 978 (515 KB) | ESnook | This image now has a colour-coordinated key describing the stages shown on the diagram |
| 16:09, 16 April 2020 |
| 1,556 × 936 (409 KB) | ESnook | {{subst:Upload marker added by en.wp UW}} {{Information |Description = {{en|This image shows the potential growth in spread and reach of a pathogen during a host switch. This includes the site of the single isolated infection, the local spillover, sustained transmission in and epidemic and ending with possible pandemic potential. }} |Source = Inkscape and Microsoft powerpoint |Date = 2020-04-10 |Author = ESnook }} |
File usage
The following pages on the English Wikipedia use this file (pages on other projects are not listed):