Original file (1,080 × 913 pixels, file size: 75 KB, MIME type: image/png)
| Description |
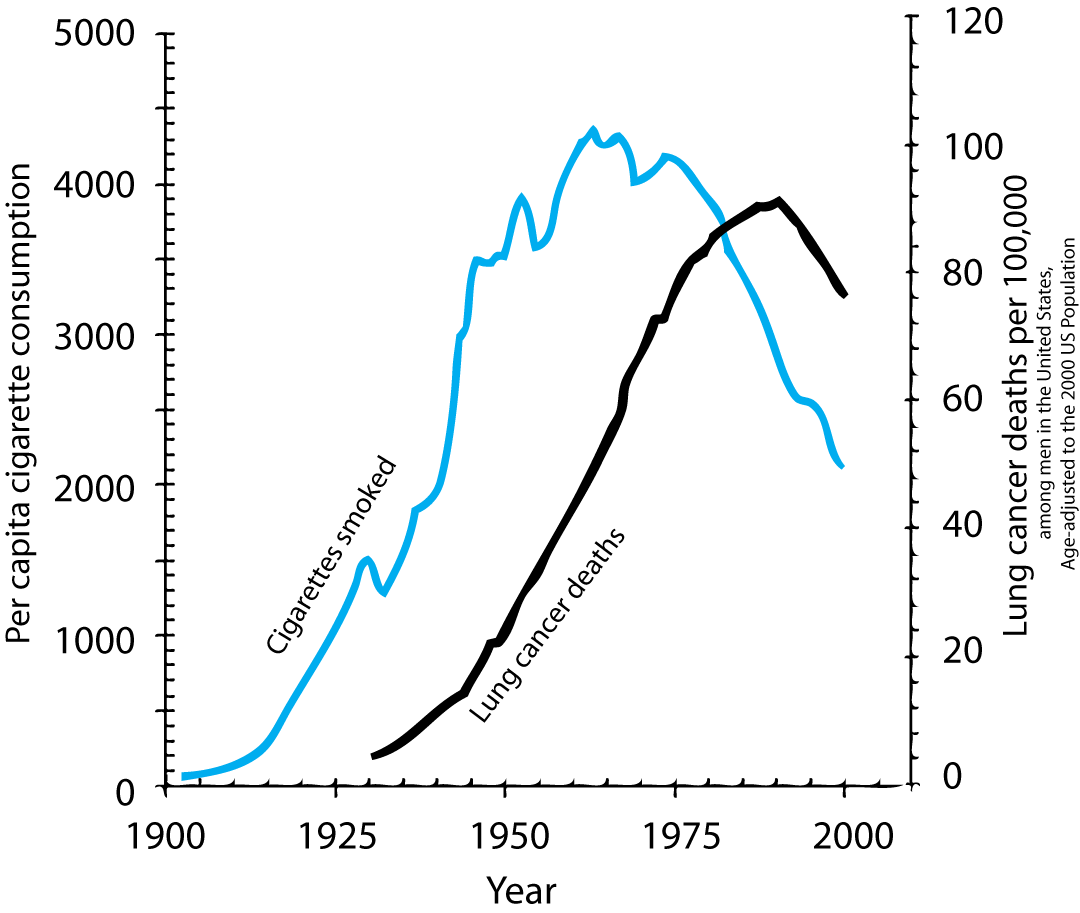
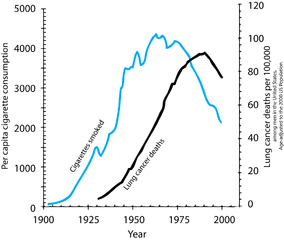
Chart showing correlation between increased Cigarette consumption and incidence of lung cancer, with a lag time. |
|---|---|
| Source |
Own work |
| Date | |
| Author | |
| Permission ( Reusing this file) |
See below.
|
Licensing
 | Permission is granted to copy, distribute and/or modify this document under the terms of the GNU Free Documentation License, Version 1.2 or any later version published by the Free Software Foundation; with no Invariant Sections, no Front-Cover Texts, and no Back-Cover Texts. Subject to disclaimers. |
|
| This work is licensed under the
Creative Commons
Attribution-ShareAlike 3.0 License. This licensing tag was added to this file as part of the GFDL licensing update. |
|
| This file is licensed under the Creative Commons Attribution-ShareAlike license versions 2.5, 2.0, and 1.0. |
| This media file is either in the public domain or published under a free license, and contains no inbound file links. If this media file is useful, then it should be transferred to the Wikimedia Commons. If this media is not useful, then please propose it for deletion or list it at files for discussion. |
 | This file is a candidate to be copied to
Wikimedia Commons.
Any user may perform this transfer; refer to Wikipedia:Moving files to Commons for details. If this file has problems with attribution, copyright, or is otherwise ineligible for Commons, then remove this tag and DO NOT transfer it; repeat violators may be blocked from editing. Other Instructions
| ||
| |||
File history
Click on a date/time to view the file as it appeared at that time.
| Date/Time | Thumbnail | Dimensions | User | Comment | |
|---|---|---|---|---|---|
| current | 18:14, 8 September 2006 |
| 1,080 × 913 (75 KB) | Jpbrody ( talk | contribs) |
You cannot overwrite this file.
File usage
Original file (1,080 × 913 pixels, file size: 75 KB, MIME type: image/png)
| Description |
Chart showing correlation between increased Cigarette consumption and incidence of lung cancer, with a lag time. |
|---|---|
| Source |
Own work |
| Date | |
| Author | |
| Permission ( Reusing this file) |
See below.
|
Licensing
|
| Permission is granted to copy, distribute and/or modify this document under the terms of the GNU Free Documentation License, Version 1.2 or any later version published by the Free Software Foundation; with no Invariant Sections, no Front-Cover Texts, and no Back-Cover Texts. Subject to disclaimers. |
|
| This work is licensed under the
Creative Commons
Attribution-ShareAlike 3.0 License. This licensing tag was added to this file as part of the GFDL licensing update. |
|
| This file is licensed under the Creative Commons Attribution-ShareAlike license versions 2.5, 2.0, and 1.0. |
| This media file is either in the public domain or published under a free license, and contains no inbound file links. If this media file is useful, then it should be transferred to the Wikimedia Commons. If this media is not useful, then please propose it for deletion or list it at files for discussion. |
|
| This file is a candidate to be copied to
Wikimedia Commons.
Any user may perform this transfer; refer to Wikipedia:Moving files to Commons for details. If this file has problems with attribution, copyright, or is otherwise ineligible for Commons, then remove this tag and DO NOT transfer it; repeat violators may be blocked from editing. Other Instructions
| ||
| |||
File history
Click on a date/time to view the file as it appeared at that time.
| Date/Time | Thumbnail | Dimensions | User | Comment | |
|---|---|---|---|---|---|
| current | 18:14, 8 September 2006 |
| 1,080 × 913 (75 KB) | Jpbrody ( talk | contribs) |
You cannot overwrite this file.