Original file (687 × 996 pixels, file size: 130 KB, MIME type: image/jpeg)
|
| This image needs to be converted to the SVG format. Once that is done, it should be moved to Wikimedia Commons in accordance with Wikipedia's image policy. Once the image is improved, see moving files to Commons for information on how to proceed. If you can not convert to SVG, go ahead and move to the Commons anyway. See Move-to-commons assistant. |
| This map image was
uploaded in a
raster graphics format such as
PNG,
GIF, or
JPEG. However, it contains information that could be stored more efficiently and/or accurately in the
SVG format, as a
vector graphic. If possible, please upload an SVG version of this image. After confirming it is of comparable quality, please replace all instances of the previous version throughout Wikipedia (noted under the " File links" header), tag the old version with {{
Vector version available|NewImage.svg}}, and remove this tag. For more information, see
Wikipedia:Preparing images for upload. For assistance with converting to SVG, please see the
Graphics Lab.Do not re-draw or auto-trace non-free images; instead, seek out vector versions from official sources. |
 |
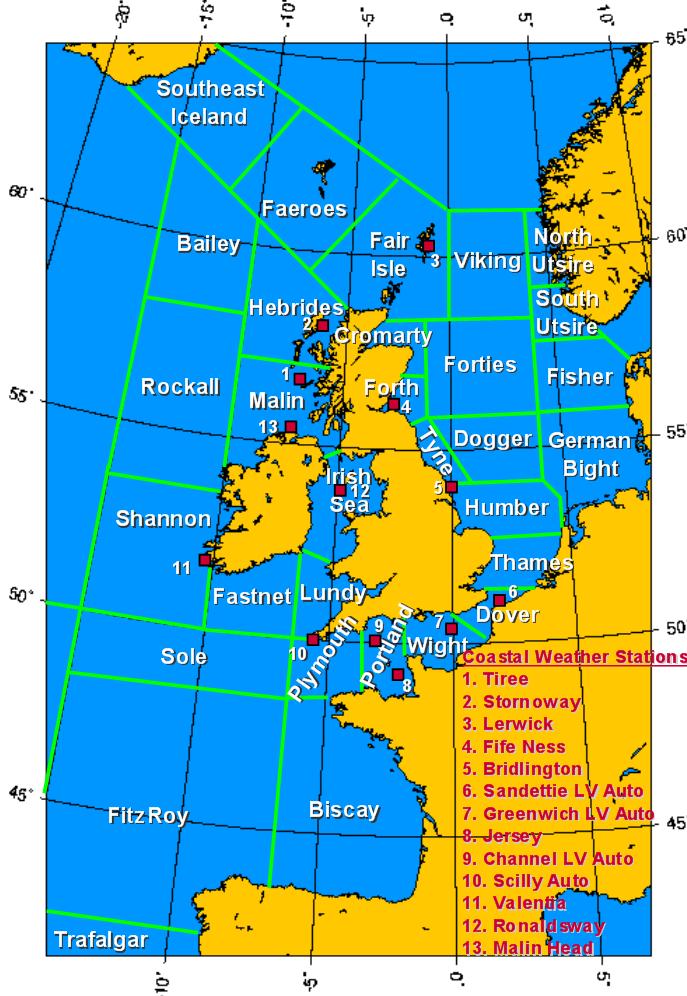
Newer version of zones for Shipping Forecast article. Shown are all sea areas, a larger scale map, latitude lines, plus the Coastal Weather Stations. Drawn by M. Lounsbery using mapping software at http://www.aquarius.geomar.de/omc/make_map.html , with added labels and lines.
 | I, the creator of this work, hereby grant the permission to copy, distribute and/or modify this document under the terms of the GNU Free Documentation License, Version 1.2 or any later version published by the Free Software Foundation; with no Invariant Sections, no Front-Cover Texts, and no Back-Cover Texts. Subject to disclaimers. |
|
| This work is licensed under the
Creative Commons
Attribution-ShareAlike 3.0 License. This licensing tag was added to this file as part of the GFDL licensing update. |
File history
Click on a date/time to view the file as it appeared at that time.
| Date/Time | Thumbnail | Dimensions | User | Comment | |
|---|---|---|---|---|---|
| current | 17:53, 24 January 2006 |
| 687 × 996 (130 KB) | Mlouns ( talk | contribs) | Newer version of zones for Shipping Forecast article. Shown are all sea areas, a larger scale map, latitude lines, plus the Coastal Weather Stations. Drawn by M. Lounsbery using mapping software at http://www.aquarius.geomar.de/omc/make_map.html , with ad |
| 08:28, 24 January 2006 |
 | 716 × 991 (136 KB) | Mlouns ( talk | contribs) | Newer version of zones for Shiiping Forecast article. Shown are all zones, a larger scale map, latitude lines, plus the Coastal Weather Stations. Drawn my M. Lounsbery using mapping software at http://www.aquarius.geomar.de/omc/make_map.html , with added |
You cannot overwrite this file.
File usage
Metadata
Original file (687 × 996 pixels, file size: 130 KB, MIME type: image/jpeg)
|
| This image needs to be converted to the SVG format. Once that is done, it should be moved to Wikimedia Commons in accordance with Wikipedia's image policy. Once the image is improved, see moving files to Commons for information on how to proceed. If you can not convert to SVG, go ahead and move to the Commons anyway. See Move-to-commons assistant. |
| This map image was
uploaded in a
raster graphics format such as
PNG,
GIF, or
JPEG. However, it contains information that could be stored more efficiently and/or accurately in the
SVG format, as a
vector graphic. If possible, please upload an SVG version of this image. After confirming it is of comparable quality, please replace all instances of the previous version throughout Wikipedia (noted under the " File links" header), tag the old version with {{
Vector version available|NewImage.svg}}, and remove this tag. For more information, see
Wikipedia:Preparing images for upload. For assistance with converting to SVG, please see the
Graphics Lab.Do not re-draw or auto-trace non-free images; instead, seek out vector versions from official sources. |
|
Newer version of zones for Shipping Forecast article. Shown are all sea areas, a larger scale map, latitude lines, plus the Coastal Weather Stations. Drawn by M. Lounsbery using mapping software at http://www.aquarius.geomar.de/omc/make_map.html , with added labels and lines.
|
| I, the creator of this work, hereby grant the permission to copy, distribute and/or modify this document under the terms of the GNU Free Documentation License, Version 1.2 or any later version published by the Free Software Foundation; with no Invariant Sections, no Front-Cover Texts, and no Back-Cover Texts. Subject to disclaimers. |
|
| This work is licensed under the
Creative Commons
Attribution-ShareAlike 3.0 License. This licensing tag was added to this file as part of the GFDL licensing update. |
File history
Click on a date/time to view the file as it appeared at that time.
| Date/Time | Thumbnail | Dimensions | User | Comment | |
|---|---|---|---|---|---|
| current | 17:53, 24 January 2006 |
| 687 × 996 (130 KB) | Mlouns ( talk | contribs) | Newer version of zones for Shipping Forecast article. Shown are all sea areas, a larger scale map, latitude lines, plus the Coastal Weather Stations. Drawn by M. Lounsbery using mapping software at http://www.aquarius.geomar.de/omc/make_map.html , with ad |
| 08:28, 24 January 2006 |
| 716 × 991 (136 KB) | Mlouns ( talk | contribs) | Newer version of zones for Shiiping Forecast article. Shown are all zones, a larger scale map, latitude lines, plus the Coastal Weather Stations. Drawn my M. Lounsbery using mapping software at http://www.aquarius.geomar.de/omc/make_map.html , with added |
You cannot overwrite this file.